Sold by: Observe, Inc.
Deployed on AWS
Observe Inc. is redefining modern AI-powered observability at scale. The only company to offer a platform built on an open data lake with a proprietary Knowledge Graph and AI SRE, Observe enables users to troubleshoot faster at drastically lower cost.
4.8
Overview

Image
Observe Architecture Diagram
Video
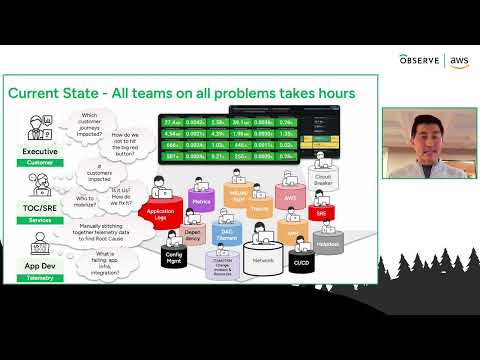
Product video
Observe is an AI-powered observability platform, engineered for scale. It ingests petabytes of telemetry per day, then structures that data using the O11y Knowledge Graph to enable fast search and correlation across logs, metrics, and traces.
With O11y AI, engineers can troubleshoot complex incidents using natural language, accelerating root cause analysis and resolution.
Built on a Snowflake data lake, Observe delivers significantly greater cost efficiency when storing and analyzing telemetry at scale.
Highlights
- Performance at Scale: Ingest 100s of TBs and run 10s of millions of queries per day without degrading performance, so you can support multiple teams and use cases on Observe.
- Faster Troubleshooting: Resolve incidents faster using O11y AI and context-aware correlation across logs, metrics, and traces, resulting in 3x faster incident resolution (MTTR) and increased engineering productivity.
- Cost-Efficient for Massive Datasets: Reduce costs by 70% and avoid vendor lock-in by using an open data lake. Ingest and retain more telemetry to avoid blind spots.
Details
Sold by
Categories
Delivery method
Deployed on AWS
New
Introducing multi-product solutions
You can now purchase comprehensive solutions tailored to use cases and industries.

Features and programs
Financing for AWS Marketplace purchases
AWS Marketplace now accepts line of credit payments through the PNC Vendor Finance program. This program is available to select AWS customers in the US, excluding NV, NC, ND, TN, & VT.

Pricing
Pricing is based on the duration and terms of your contract with the vendor. This entitles you to a specified quantity of use for the contract duration. If you choose not to renew or replace your contract before it ends, access to these entitlements will expire.
Additional AWS infrastructure costs may apply. Use the AWS Pricing Calculator to estimate your infrastructure costs.
Dimension | Description | Cost/12 months |
|---|---|---|
Observe Usage | One unit is $20K worth of compute and storage | $20,000.00 |
Dimensions summary
This listing uses a single pricing dimension: Observe Usage, measured in Units. Each unit represents a fixed amount of compute and storage. You commit to a volume of telemetry data you plan to ingest, then draw down against that commitment as you use compute and storage. Pricing scales with the number of units you purchase, so buying more units raises your total commitment. Because the model is contract-based on committed usage, your costs stay predictable. If you exceed your committed volume, the vendor works with you to adjust capacity rather than sending overage bills.
Top-of-mind questions for buyers
One unit represents a fixed pool of compute and storage that you draw down as you use the platform. Compute runs your queries and processes ingested telemetry. Storage holds your logs, metrics, and traces. You consume from this pool based on how much data you ingest and how many queries you run.
You will not receive an overage bill. If your ingestion exceeds the committed volume tied to your units, the vendor works with you to right-size your capacity instead. This keeps your costs predictable rather than triggering automatic surprise charges when usage climbs.
The volume of telemetry you ingest and the number of queries you run both draw down the pool. Compute scales with query activity, and storage scales with retained data. Data is compressed and elastic compute scales on demand, so you consume based on actual work performed.
www.observeinc.com+1
Helpful?
Vendor refund policy
Custom pricing options
Request a private offer to receive a custom quote.

Legal
Vendor terms and conditions
Upon subscribing to this product, you must acknowledge and agree to the terms and conditions outlined in the vendor's End User License Agreement (EULA) .
Content disclaimer
Vendors are responsible for their product descriptions and other product content. AWS does not warrant that vendors' product descriptions or other product content are accurate, complete, reliable, current, or error-free.
Delivery details
Software as a Service (SaaS)
SaaS delivers cloud-based software applications directly to customers over the internet. You can access these applications through a subscription model. You will pay recurring monthly usage fees through your AWS bill, while AWS handles deployment and infrastructure management, ensuring scalability, reliability, and seamless integration with other AWS services.
Resources
Vendor resources
Support
Vendor support
Observe provides world class support, including an assigned Data Engineer. Please feel free to reach out to us via support@observeinc.com
AWS infrastructure support
AWS Support is a one-on-one, fast-response support channel that is staffed 24x7x365 with experienced and technical support engineers. The service helps customers of all sizes and technical abilities to successfully utilize the products and features provided by Amazon Web Services.
Updated weekly
By Observe, Inc.

By Honeycomb.io
Top
10
In Application Performance and UX Monitoring
Top
10
In Generative AI, Log Analysis
Top
10
In Log Analysis
Sentiment is AI generated from actual customer reviews on AWS and G2
Functionality
Ease of use
Customer service
Cost effectiveness
Positive reviews
Mixed reviews
Negative reviews
AI generated from product descriptions
Data Ingestion and Query Performance
Ingests petabytes of telemetry per day with capability to process hundreds of terabytes and execute tens of millions of queries daily without performance degradation
Knowledge Graph Architecture
Utilizes O11y Knowledge Graph to structure and correlate data across logs, metrics, and traces for fast search and correlation capabilities
Natural Language Processing for Incident Analysis
Implements O11y AI to enable troubleshooting of complex incidents using natural language queries for accelerated root cause analysis
Open Data Lake Foundation
Built on Snowflake data lake architecture providing open data storage without vendor lock-in and enabling cost-efficient telemetry retention
Multi-Signal Correlation
Correlates and contextualizes data across logs, metrics, and traces to provide unified observability across multiple teams and use cases
AI-Powered Root Cause Analysis
Automatically investigates alerts and pinpoints root causes with 5x faster analysis capabilities.
Natural Language Query Interface
Enables querying of observability data using conversational natural language to identify issues and receive actionable insights.
Real-Time Anomaly Detection
Detects system anomalies in real-time to prevent incidents before they impact users.
OpenTelemetry Integration
Supports standardized OpenTelemetry integration for unified data collection across logs, metrics, and traces in cloud-native environments including Kubernetes, serverless, and microservices.
Multi-Tiered Storage Architecture
Implements multi-tiered storage and data management capabilities to optimize telemetry data retention and reduce storage costs.
Event-Based Telemetry Model
Utilizes event-based telemetry architecture to capture and analyze detailed observability data across distributed systems.
Distributed Tracing Capability
Implements distributed tracing functionality to identify and locate issues buried deeply within application stacks across complex services.
Advanced Query Engine
Provides a powerful query engine capable of slicing data across billions of rows and thousands of fields to identify hidden patterns and anomalies.
Multi-Level Data Drill-Down
Enables drilling down from high-level service performance metrics to individual user-level issues without requiring correlation across different data types.
Cloud Native Application Observability
Designed for observability of cloud native applications with integrated support for monitoring service performance and troubleshooting distributed services.
Standard contract
No
Customer reviews
Jason H.
Ingest and Connect Everything
Reviewed on Jun 17, 2021
Review provided by G2
What do you like best about the product?
To start, Observe's support team is far beyond any other vendor that I have worked with to date, which includes other top-ranked APM/Logging/Monitoring solutions on G2. They make communication easy; they are very responsive and dedicated to ensuring you are successful with the product.
Observe treats all your custom/bespoke data coming in from arbitrary data sources or 3rd party tooling the same as other more common data sources such as Kubernetes or AWS. All of your data sources and resources feel just as integrated and native to Observe as any other. If you send over data they've never seen, you aren't handicapped until they support it, and you don't need to submit a feature request to have them integrate your data source in a way that feels native.
Within Observe, you can easily model your resources across the various platforms you use. Those platforms and resources can span across EC2 instances, Kubernetes Pods, Terraform runs, CI/CD Builds, JIRA tickets, GitHub commits, and anything else relevant to you. You can then create links/connections between all of these resources and their event streams/logs.
Imagine a scenario where you see an access denied exception when accessing AWS resources in your application logs. From your app logs, you can jump to the Kubernetes Pod for that service and see the IAM Role attached to the pod. From the IAM Role, you review the attached IAM Policy and the CloudTrail events associated with that role to see more details on the failed request and what permissions you need to add to the policy. You can further investigate the change history of the policy, jumping to the Terraform run that last updated the policy, the GitHub commit that triggered the Terraform run, and the JIRA story associated with the code change.
You can genuinely connect everything in Observe, not just logs and not just your typical platforms, and do so in a way that represents your architecture and workflows.
Observe treats all your custom/bespoke data coming in from arbitrary data sources or 3rd party tooling the same as other more common data sources such as Kubernetes or AWS. All of your data sources and resources feel just as integrated and native to Observe as any other. If you send over data they've never seen, you aren't handicapped until they support it, and you don't need to submit a feature request to have them integrate your data source in a way that feels native.
Within Observe, you can easily model your resources across the various platforms you use. Those platforms and resources can span across EC2 instances, Kubernetes Pods, Terraform runs, CI/CD Builds, JIRA tickets, GitHub commits, and anything else relevant to you. You can then create links/connections between all of these resources and their event streams/logs.
Imagine a scenario where you see an access denied exception when accessing AWS resources in your application logs. From your app logs, you can jump to the Kubernetes Pod for that service and see the IAM Role attached to the pod. From the IAM Role, you review the attached IAM Policy and the CloudTrail events associated with that role to see more details on the failed request and what permissions you need to add to the policy. You can further investigate the change history of the policy, jumping to the Terraform run that last updated the policy, the GitHub commit that triggered the Terraform run, and the JIRA story associated with the code change.
You can genuinely connect everything in Observe, not just logs and not just your typical platforms, and do so in a way that represents your architecture and workflows.
What do you dislike about the product?
My only potential dislike is that they aren't a full-blown APM (yet?). However, as mentioned above, they provide a lot of value beyond what an APM can provide. The foundation of the product seems so solid and flexible that I would not be surprised if they make good progress closing that gap, enough to allow us to dump our APM and solely use Observe.
What problems is the product solving and how is that benefiting you?
AWS likes to spread your logs and event streams all over the place: S3 buckets, Cloudwatch log groups, Kinesis Firehose, etc. All with different, and not very good, ways of accessing the data when needed. It is even worse if you have multiple accounts.
Observe centralizes all of our data from AWS and elsewhere, giving us a single tool that our team needs to learn and a single source of truth for visibility into our environments. This centralization has facilitated easier onboarding of new users and better visibility for operations, security, and compliance. Observe has made all this data easy to find, analyze, and act upon.
Observe centralizes all of our data from AWS and elsewhere, giving us a single tool that our team needs to learn and a single source of truth for visibility into our environments. This centralization has facilitated easier onboarding of new users and better visibility for operations, security, and compliance. Observe has made all this data easy to find, analyze, and act upon.
Evan H.
Logging the Easy Way
Reviewed on Jun 15, 2021
Review provided by G2
What do you like best about the product?
After setting up simple collectors, you now have access to all of your data. You don't need to truncate or parse your logs until they get to the server. You can easily create worksheets and parse your data out. Their team is super knowledgeable and always able to help.
What do you dislike about the product?
The custom language takes a little getting used to, but you can also use right-click utils to do most.
What problems is the product solving and how is that benefiting you?
We are keeping an eye on our data. Errors that used to not get to us until a user let us know are now getting to our inbox when they happen.
Recommendations to others considering the product:
It's simple and growing; we have been more interactive with our logging data than we have in a while.