AWS Public Sector Blog
Create a multicloud FinOps dashboard with Amazon QuickSight using AWS services
The cloud’s agility, flexibility, and scale make it a powerful tool for many customers—and thousands of migrations happen every day. The pay-as-you-go model reduces costs and shortens the time for procurement while also enabling customers to scale down as needed. Some customers find monitoring and automatically controlling costs with the pay-as-you-go model challenging; fortunately, cloud technology makes monitoring costs achievable—even across other environments.
In this post, we use AWS Glue, Amazon Athena, and Amazon QuickSight to build a dashboard that tracks costs associated with Amazon Web Services (AWS) and third-party providers. This single pane of glass allows for quick monitoring at the senior leadership level, with the ability to dig further into specific spending categories for tools and environments. Additionally, this data system makes further analytics possible.
Peraton is a mission capability integrator and delivers enterprise IT around the world. The company is also an AWS Premier Tier Services Partner with competencies in Amazon Connect, Government, DevOps, and Cloud migration consulting. Peraton’s IT infrastructure and technology strategy are designed to support the delivery of mission-critical services and solutions to its customers on a global scale.
Multicloud dashboard challenges
Peraton began evaluating alternative FinOps solutions as part of a broader initiative to enhance efficiency and reduce operational expenditures. Although the current tool served its purpose, many of its features were redundant with those of existing tools already in use, and its high verbosity had the potential to distract from key insights. The team sought to find a FinOps alternative that was not only significantly more cost-efficient but also flexible enough to continue adapting to the changing needs of the business.
Peraton conducted a thorough needs assessment and documented the requirements and desired capabilities for an alternative FinOps solution. After being unable to find any alternatives that met both functional and budgetary goals, they opted to create an in-house solution using AWS native tools.
Key features of the solution include:
- Flexible and customizable insights: Enables granular visibility into specific areas of interest, allowing an organization to focus on what matters most (such as cost and usage, invoice and discount analysis, cost optimization, or geographical operations).
- Minimal operational overhead: Designed to be low maintenance by reducing moving parts and eliminating unnecessary dependencies.
- Scalable architecture: Built to scale seamlessly according to business needs by relying on serverless AWS resources.
- Cost-efficiency: Delivers significant cost savings when compared to previous third-party FinOps solutions (cost reduction of 96.4 percent). Introduces the ability to achieve the same functionality as competing FinOps tools at a fraction of the price.
- Unified multicloud visibility: Single-pane-of-glass views across major cloud service providers (CSPs) including AWS, Azure, and Google Cloud Platform (GCP), with plans to expand support to other CSPs.
CLOUDSPARCC overview
Taking inspiration from the AWS Cost and Usage Dashboard (CUDOS), a cloud intelligence dashboard (CID) available through AWS Well-Architected Labs, and using it as a springboard, the team developed CloudSPARCC (Cloud Service Performance Analytics and Resource Cost Control). CloudSPARCC is a multicloud FinOps solution powered by Amazon QuickSight that delivers a unified, single-pane-of-glass visualization into cloud billing data. Its internal development enables a high level of flexibility to produce actionable insights based on these meaningful visualizations.
The following diagram shows the solution architecture.

Figure 1. Architecture of CLOUDSPARCC’s data ingestions to visualization
The CloudSPARCC data ingestion process workflow:
- Daily data synchronization:
- Third-party cloud platforms: Currently, a GitHub action runs daily to sync cost and usage data from third-party cloud platforms. In the future, an AWS Lambda function triggered by a cron job in Amazon EventBridge runs daily to sync cost and usage data.
- AWS solution: Cost and usage data is replicated from individual organization accounts into the centralized data collection account.
- Data storage and organization:
- All collected data is aggregated and stored in Amazon Simple Storage Service (Amazon S3), organized first by the CSP then by top-level payer account.
- Data transformation and consolidation:
- AWS Glue crawlers in combination with custom classifiers run daily, performing extract, transform, and load (ETL) operations to coax the data into a standardized schema.
- Amazon Athena is used to query this data and further manipulate it to create views tailored to show only relevant information.
- Data acceleration:
- Highly refined data is ingested into SPICE (Super-fast, Parallel, In-memory Calculation Engine), allowing for faster analytical processing and visualization.
- Optimization starts upon the data’s creation and is performed iteratively to enhance performance and minimize cost at each stage.
- Data visualization:
- The final data is loaded into and presented by the QuickSight dashboard, providing an interactive way to analyze relevant data.
CloudSPARCC components
CloudSPARCC offers several key screens that provide users with clear analytics into their multicloud environments: the executive cloud summary, the executive billing summary, and custom reports. The following sections explain these screens.
Executive cloud summary
The executive cloud summary provides a month-to-date view of cloud spend across all available CSPs, in addition to month-over-month trends and forecasted costs for the current month. The following screenshot shows the Executive Cloud Billing Summary screen, displaying figures for GCP, AWS, and Microsoft Azure.
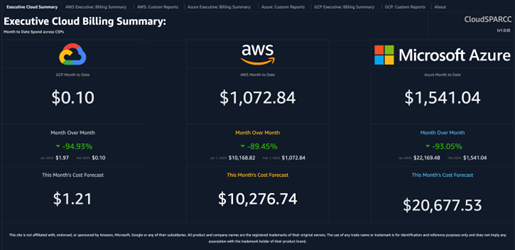
Figure 2. An example of the Executive Cloud Billing Summary screen
Executive billing summary
The executive billing summary provides high-level insights into both month-to-date and previous three-month cloud spend, usage distribution, discounts, and invoicing data. The billing summary is used for straightforward analyses, and data can be filtered based on payer hierarchy, from top-level payer downward. Each CSP’s respective billing summary maintains a consistent layout and reporting structure to provide a uniform user experience regardless of the cloud platform being analyzed. The following three screenshots show the billing summary screens for AWS, GCP, and Azure.
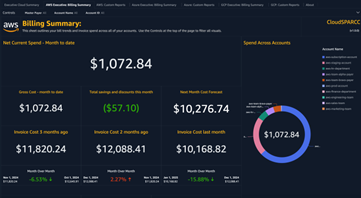
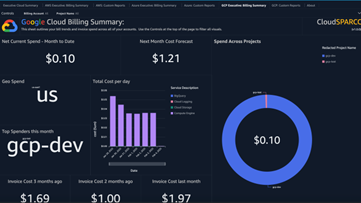
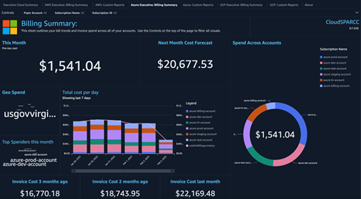
Figure 3. An example of the Billing Summary screens for AWS, GCP, and Azure
Custom reports
Custom reports enable advanced filtering and analysis of the data presented by the executive billing summary. The capabilities offered by the Custom Reports screen mirror those offered by AWS Cost Explorer but add the ability to provide these functionalities across the organization as well across multiple CSPs. The following three screenshots show the Custom Reports screen for AWS, Azure, and GCP.
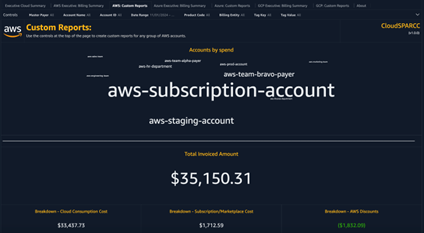
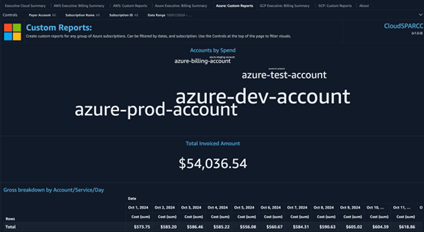
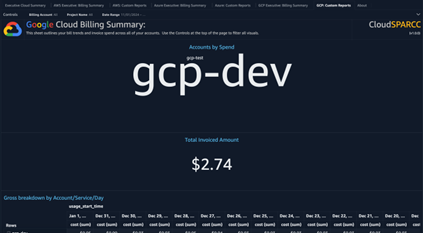
Figure 4. An example of the Cloud Billing Summary screens for AWS, Azure, and GCP
CloudSPARCC now serves Peraton’s corporate IT team in addition to external customers, delivering insights highly tailored to their needs at significantly lower costs—all without sacrificing any functionality provided by the previous solution. Recently, the flexibility of CloudSPARCC allowed it to be adapted to meet the needs of a Peraton program with unique reporting requirements. It accurately calculates, monitors, and visualizes cost savings realized from Amazon Elastic Compute Cloud (Amazon EC2) Spot Instances, Amazon EC2 Reserved Instances, and various AWS discounts when compared to on-demand pricing. It shows a fine-grained level of detail not currently available through the AWS Billing Console and accessing these metrics through third-party tools typically require additional subscriptions.
By developing and deploying its own multicloud FinOps solution, Peraton achieved a significant cost reduction of 96.4 percent compared to its previous third-party solution.
Conclusion
Peraton created an efficient, multicloud FinOps solution that supports both internal teams and external users across multiple cloud platforms. Built with serverless AWS built-in tools, it offers strong scalability and major cost savings, all without sacrificing any of the functionality offered by the previous FinOps tool. Through its flexibility, low maintenance, and user-focused design, CloudSPARCC continues to serve Peraton as a reliable solution, offering valuable insights at a fraction of the cost.
Cloud Intelligence Dashboards are an important aspect of the Well-Architected Framework. These dashboards help customers drive financial accountability, optimize cost, track usage goals, implement best practices for governance, and achieve operational excellence across all Well-Architected pillars. The AWS Well-Architected Labs has various dashboards that can help with the creation of a Cloud Intelligence Dashboard.