Networking & Content Delivery
Using CloudWatch Alarms and Lambda to catch exceptional traffic
Have you ever wondered, “Why did I have this sudden increase in network traffic?” AWS Transit Gateway Flow Logs are a great resource for answering this, but running them continuously can incur processing and storage costs that you don’t need. However, if Flow Logs are run on demand, the traffic anomaly may have already passed by the time someone receives the alarm and enables Flow Logs.
Fortunately, AWS provides tools to automatically detect unusual traffic flows and enable Flow Logs during traffic increases. This post walks through one route to do this, using Amazon CloudWatch Alarms and AWS Lambda, with options to automate the deployment throughout your entire AWS network. The AWS CloudFormation templates and Python Lambda code used in this post are now available on GitHub.
To accomplish this, we configure the following steps, shown in Figure 1:
- AWS Transit Gateway automatically sends metrics to CloudWatch by default. We can pick the metrics to use, but BytesIn and BytesOut are common.
- We create a CloudWatch alarm for these metrics, using Anomaly Detection to determine the normal levels, referred to as a band in CloudWatch Anomaly Detection.
- When the traffic levels exceed or return to the normal band, the Alarm state changes. The alarm is configured to call our Alarm Handler Lambda function every time this happens.
- The Alarm Handler makes an API call to turn on Flow Logs only while the metric is in alarm.
- Transit Gateway sends Flow Logs to an Amazon S3 bucket only when requested by the Alarm Handler.
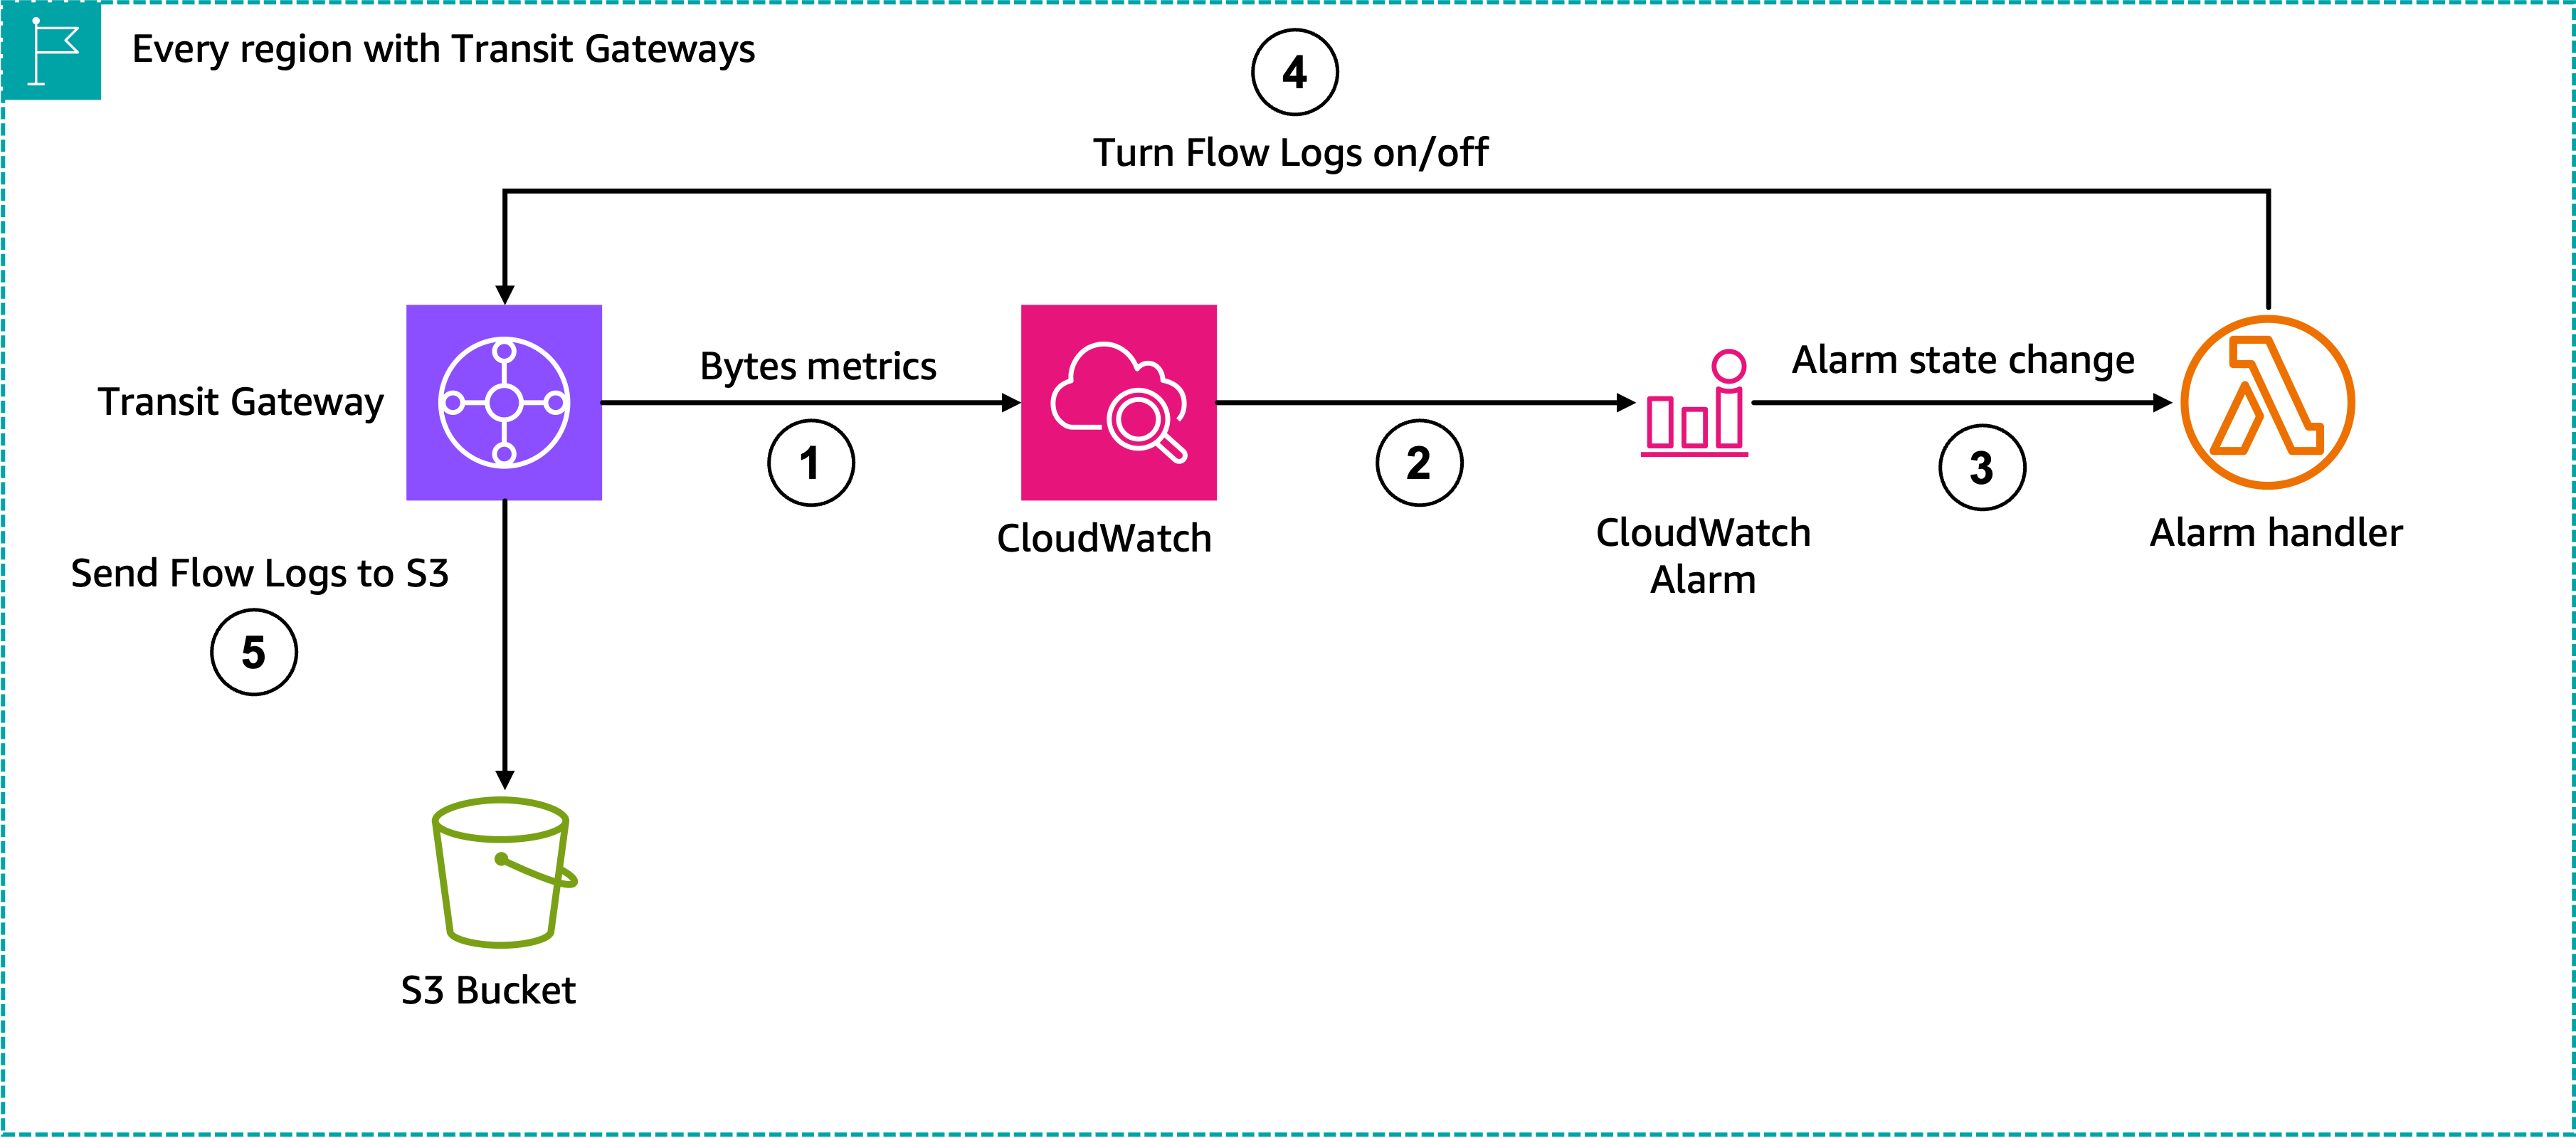
Figure 1: Functional layout of the alarming configuration
You can observe an example of this, as shown in the following figure, by going into CloudWatch, choosing the metric, then choosing Add Math, Anomaly detection, and Calculate band.
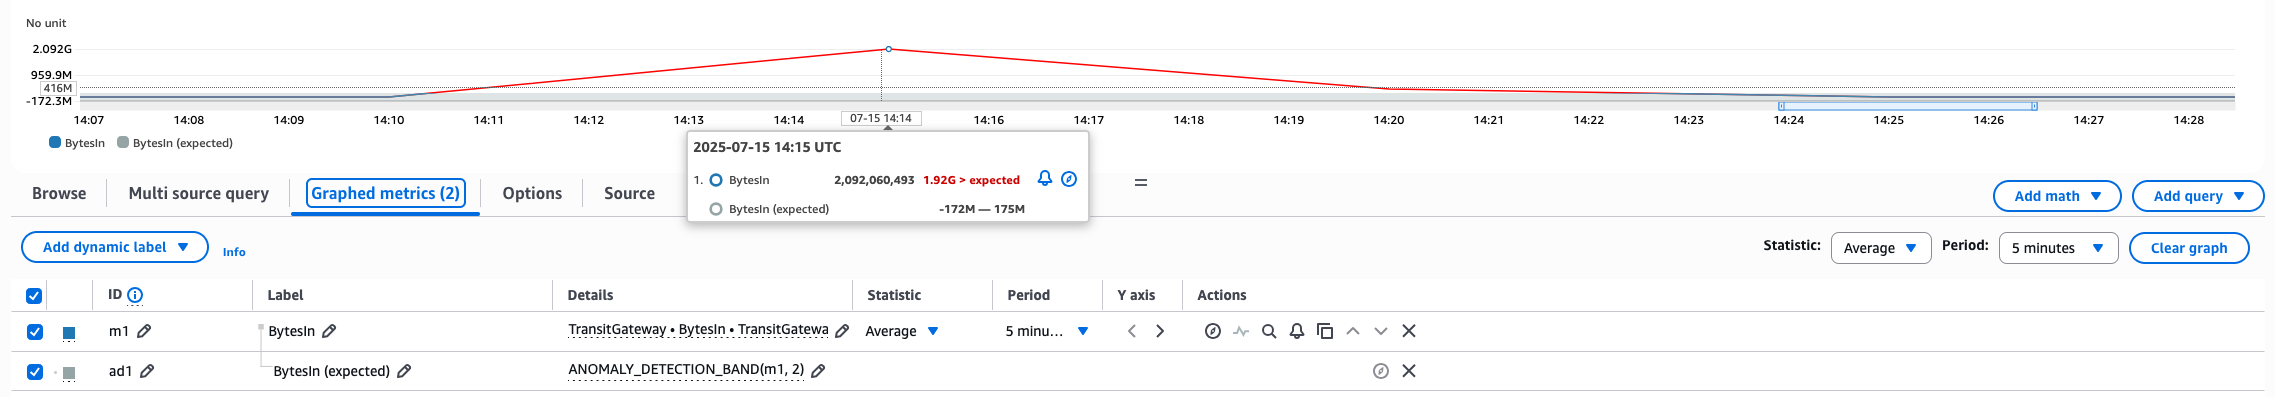
Figure 2: Example of the anomaly detection band.
This anomaly band can raise an alarm when the traffic exceeds the band, as shown in the following figure:
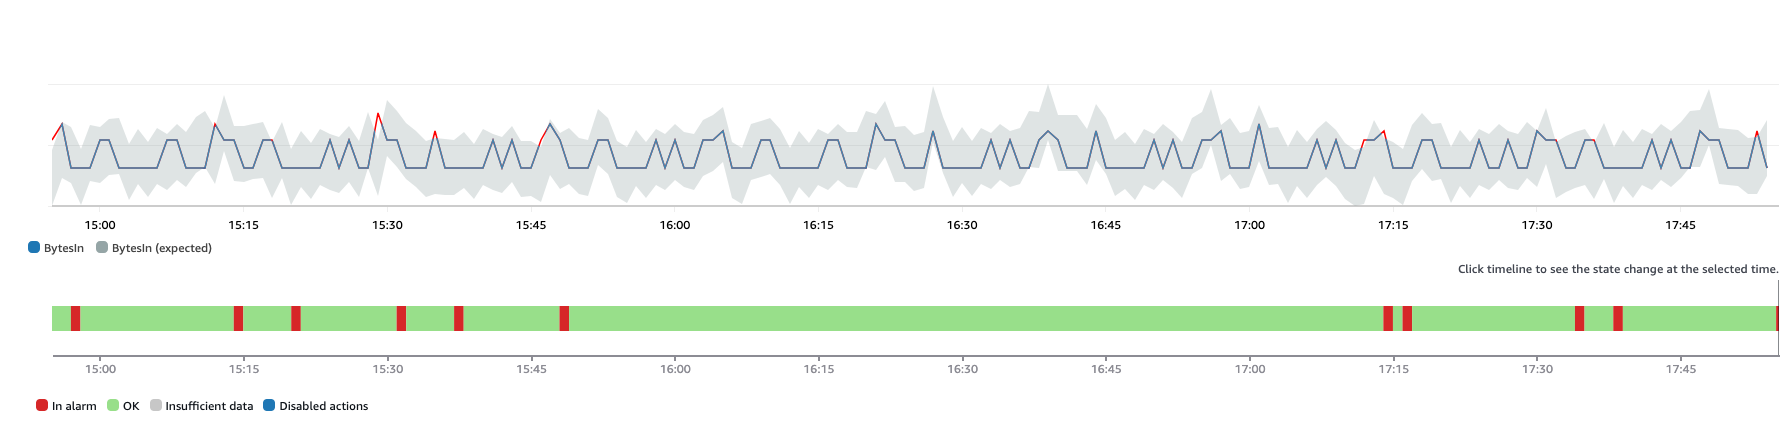
Figure 3: Example of the anomaly detection band being exceeded.
The individual points where the band are exceeded show as red on the metric line, and you can observe the anomaly band shifts over time as conditions change inside the network.
With low usage levels, even small changes can trigger Anomaly Detection alarms because these changes appear proportionally large. This could be a previously idle attachment getting the first few resources deployed, or any other similar activity. This can create a lot of noise with false alarms being raised by the anomaly detector, because we generally aren’t worried about an attachment going from zero to a couple megabytes a minute of usage. We want to catch the attachments that suddenly go from megabytes to gigabytes.
There are two ways to solve this. The first is to create another alarm on the metric, to set an alarm when below a certain sensitivity threshold. Then, this is used as a suppression alarm in a composite alarm. An example of this is shown in the following figure, where a LowBW suppression alarm is holding down the Anomaly alarm:
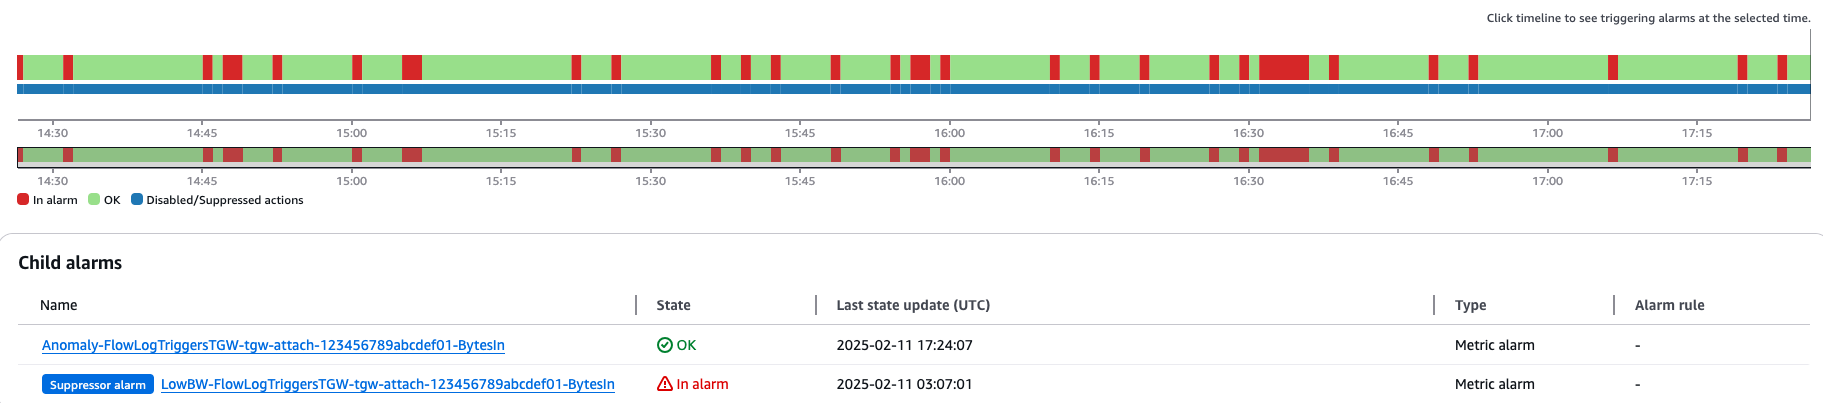
Figure 4: Example of a suppression alarm in action.
Suppression alarms are a nice feature for some applications, but in this case, it has a drawback. Those suppression alarms are in alarm, causing the aggregate alarm counts to indicate problems when there aren’t any, as shown in the following figure.
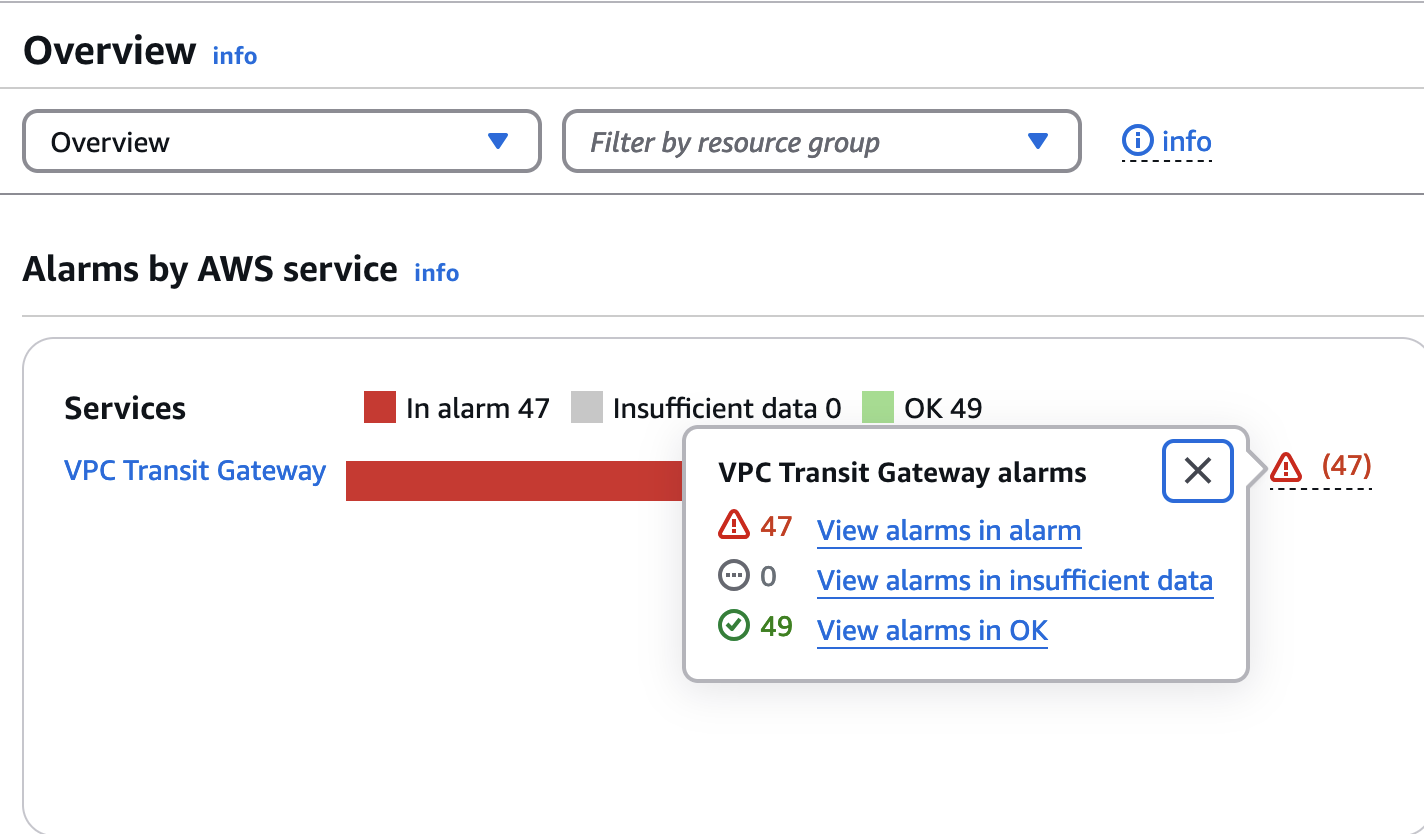
Figure 5: CloudWatch alarms summary showing half of the alarms in alarm state.
This behavior can lead to alarm fatigue, where operators, accustomed to seeing numerous alarms, might miss critical alerts.
Another way to solve this is to combine both criteria into a single alarm using a logical operator, as shown in the following figure.
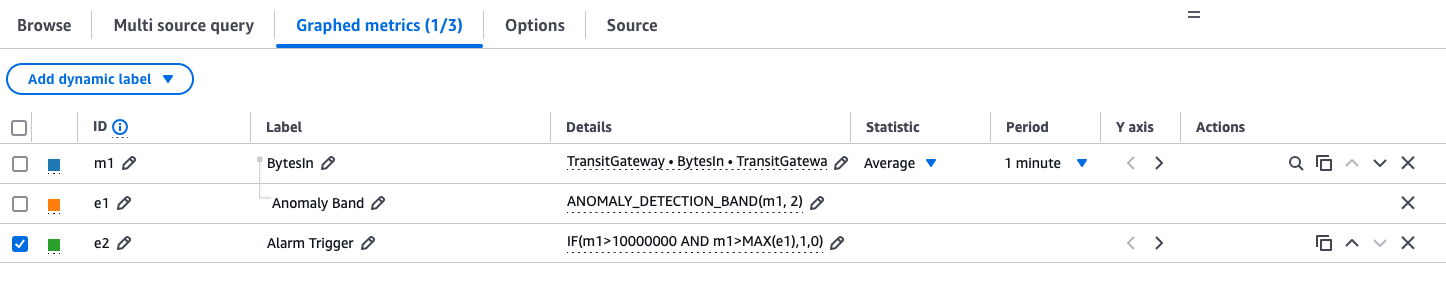
Figure 6: Single alarm configuration with a logical operator as alarm trigger.
The metric we’re interested in is BytesIn, and it has an ID of m1. The anomaly detection band mentioned previously has an ID of e1. The final logical evaluation has an ID of e2. The e2 rule does a logical AND of m1 being greater than our minimum threshold (10,000,000 in this case), and the anomaly detection band being exceeded (thus not alerting on traffic going below the band). e2 returns a 1 if both conditions are met, and a 0 otherwise. Therefore, we set an alarm on e2 greater than 0, and get our desired effect, as shown in the following figure.
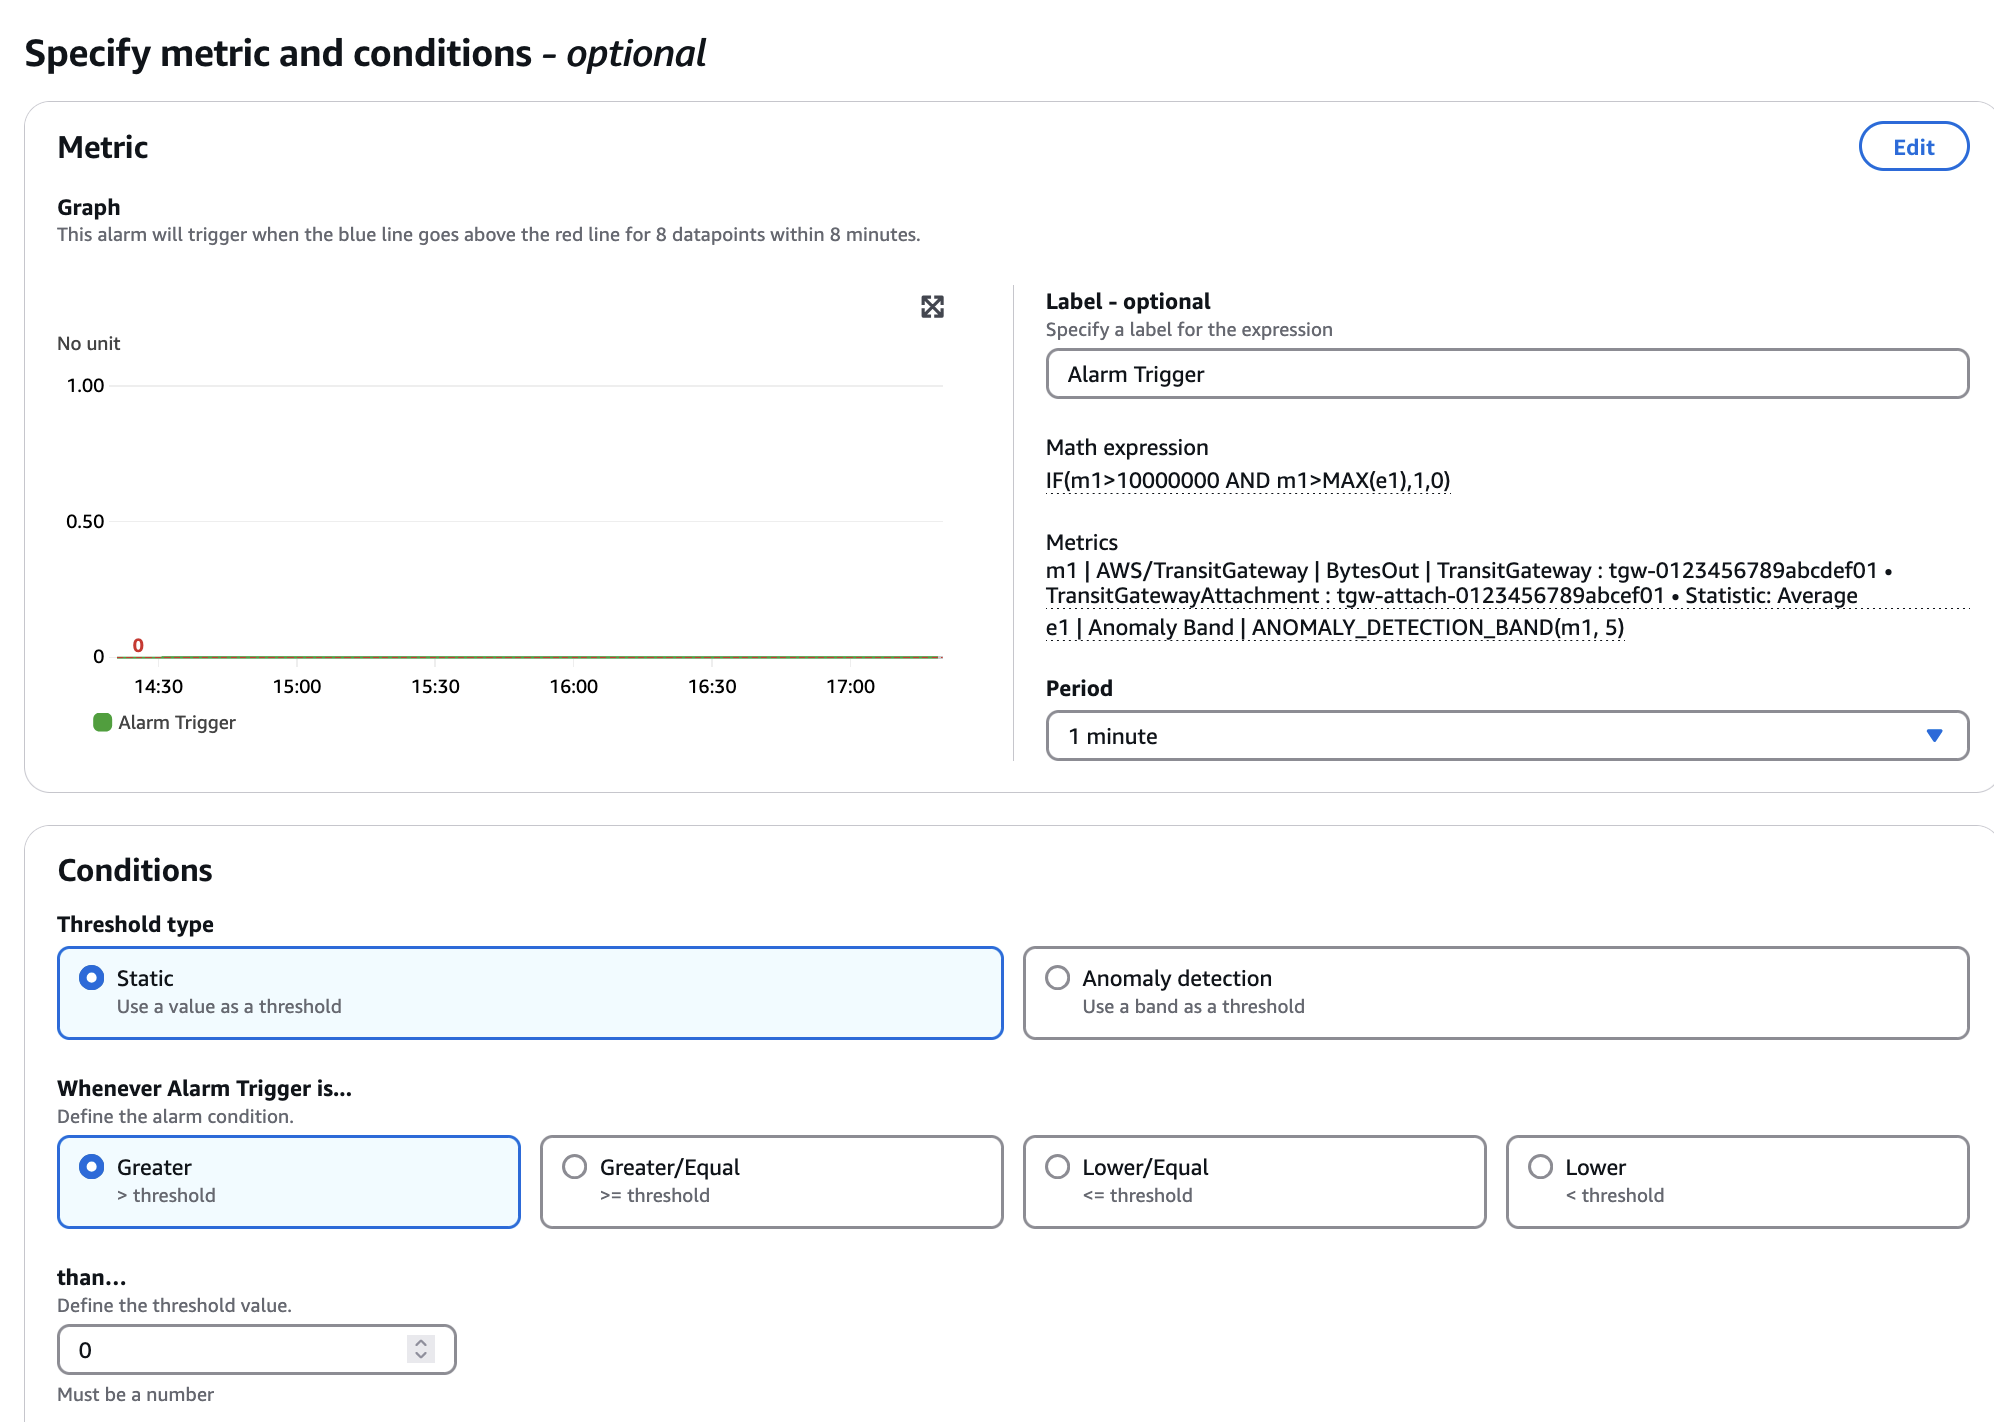
Figure 7: Alarming conditions against the logical operator.
At this point, we have a CloudWatch alarm for when unusual traffic changes happen. CloudWatch alarms can trigger a Lambda function when they change state (from OK to ALARM or vice-versa). When Lambda is called, we can perform any action in the AWS API on the event, based on the event data passed in from CloudWatch. This data includes the exact metric that caused the alarm and its dimensions. For this use case, those include TransitGateway and TransitGatewayAttachment, giving the IDs of the Transit Gateway and attachment for which we need to either enable or disable monitoring. The alarm_handler.py script provided includes example code that enables and disables Flow Logs with the alarm state changes. When you write your own scripts, there are a few best practices to consider:
- Remember that your Lambda could potentially be called multiple times very quickly (for example, if traffic is from one attachment to another). AWS recommends Lambda functions be idempotent, able to handle multiple concurrent executions, and handle repeated triggers of the same event. This is important to consider here. For this use case, this means tracking state in the AWS APIs, and avoiding the use of storing state in /tmp files or other databases.
- Set up an Amazon Simple Notification Service (Amazon SNS) topic to email network operators when the script is triggered, or if the script has issues for some reason. Make sure that you have appropriate checks that these alarms are valid to prevent alarm fatigue due to invalid alarms.
- Always wrap your Lambda code in try/except blocks, with the outermost code sending an SNS message that it had a problem. Otherwise, while Lambda logs the events to CloudWatch Logs, the problem may go unnoticed.
Automating setting up the metrics
Some users have hundreds or thousands of Transit Gateway attachments that they would like to monitor. Trying to create the alarms manually as described previously for every attachment would quickly become tedious and error-prone. There are two ways to automate the creation of these metrics, both using Lambda code (an example provided as update_attachments.py).
The first is to set up an Amazon EventBridge timer rule that has Lambda launch update-attachments every so often. This script uses APIs to get the list of all Transit Gateway attachments and all currently configured alarms. It reconciles the two by creating new alarms if needed, and deletes alarms for attachments that are no longer present. This eliminates the need for anyone to try to manage these alarms manually.
A CloudFormation script, titled alarms-and-lambda.yaml, is provided in the repository that sets everything up for a Transit Gateway that you specify.
If you have multiple Transit Gateways, you have two options: you can either deploy the single CloudFormation multiple times, or use automation based on AWS Network Manager. Network Manager supports both AWS Cloud WAN and Transit Gateway, and it has a feature that is ideal for this use case: topology change notification events. Setting up EventBridge to take these events and call the Lambda allows the code to react to attachment state changes as they happen. Network Manager can manage all your Transit Gateways globally, thus it also sends those events to one place for every resource worldwide that is part of the global network.
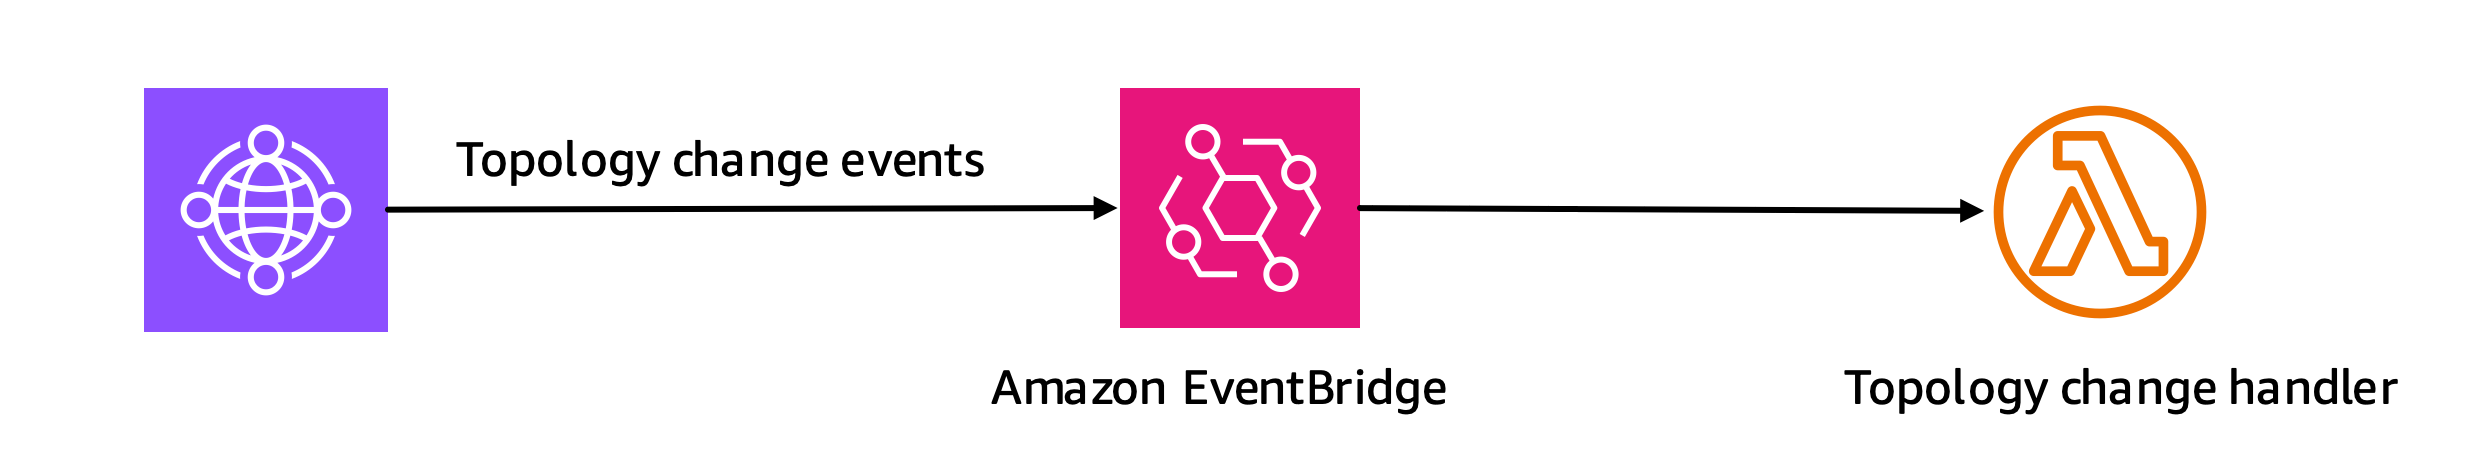
Figure 8: Functional diagram of Network Manager events.
To implement this functionality, we provide the final piece of code in the repository, nm_event_handler.py, already integrated into the CloudFormation template, alarms-and-lambda.yaml, and used if you specify a CloudWAN global network ARN instead of a Transit Gateway ID. The event handler gives an example of how to handle this arrangement, such as managing new and deleted attachments, and deploying the alarm handler and associated S3 buckets into new AWS Regions when detected. This script also handles CloudFormation create, update, and delete events. Handling these is important: attachments that were created before deployment need to have their alarms created, updates can change some of the alarming configurations, and on delete, as a best practice, it cleans up after itself.
The scripts provided automatically enable and disable Flow Logs, and send email notifications to the specified address or SNS topic when state changes occur. An example notification:
Flow logging has been enabled on TransitGatewayAttachment ID tgw-attach-0123456789abcdef0 to arn:aws:s3::: amzn-s3-demo-bucket/transit_gateway_logs/tgw-attach-0123456789abcdef0.
You can view the logs collected by running: aws s3 ls s3:// amzn-s3-demo-bucket/transit_gateway_logs/tgw-attach-0123456789abcdef0/AWSLogs/111122223333/vpcflowlogs/us-west-2/2025/07/15/
Alarm Information:
Alarm: BytesIn-tgw-tgw-attach-0123456789abcdef0-alarms-Alarm
Current value: 2.2 GB per minute
Anomaly detection high band: 166.9 MB per minute.This message is from lambda function alarms_Alarm_Handler in region us-west-2.
Summary
We have discussed how to automatically detect and respond to unusual network traffic patterns in AWS Transit Gateway using CloudWatch Alarms and Lambda functions. Instead of running expensive Flow Logs continuously, this solution enables Flow Logs only when traffic anomalies occur, reducing costs while ensuring you capture important network events.
By using CloudWatch Anomaly Detection to establish normal traffic baselines, we can then set up alarm triggers to call Lambda, executing custom responses. To avoid false alarms from low-traffic scenarios, the solution combines anomaly detection with minimum threshold requirements using logical operators within a single alarm. While this post uses these techniques to enable Flow Logs, you can easily use the same pattern for other alarms and other actions.
Integrating with AWS Network Manager enables global, multi-region automation to cover your entire network with one tool. While individual Transit Gateways can be monitored, the events from Network Manager allow event-based actions to be taken, reducing time before a new networking component is monitored and saving costs from having to run a Lambda every few minutes to detect changes.
The post provides complete CloudFormation templates and Python code examples in the GitHub repository for this use case and is written in a way to allow easy changes and adaptions to your environment or other services entirely.
Getting started
Check out the AWS Lambda scripts and AWS CloudFormation templates published in the public GitHub repository for examples of how to deploy this inside your own network. Consider what other uses you may have for the combination of Anomaly Bands, EventBridge, and Network Manager that is giving you the signals we have discussed here. This includes using this to monitor individual Amazon Elastic Compute Cloud (Amazon EC2) instances and enabling VPC Flow Logs, making your AWS networking infrastructure both more transparent and cost-effective.
About the author

Andrew Gray
Andrew Gray is a Principal Solutions Architect at AWS, specializing in networking architecture and engineering. With experience as a lead networking engineer in telecommunications and higher education, Andrew enjoys applying his technical expertise to develop innovative cloud solutions. He is passionate about solving complex challenges at the intersection of networking, infrastructure, and code.