AWS Cloud Operations Blog
Resolve application issues autonomously with AWS DevOps Agent (Preview) and Dynatrace
Application issues require fast resolution to maintain business continuity and customer satisfaction, but manual investigation creates delays that can cost organizations significantly in lost revenue and productivity. Last week, we launched AWS DevOps Agent (Preview), a frontier agent that resolves and proactively prevents incidents, continuously improving reliability and performance of applications in AWS, multicloud, and hybrid environments. Frontier agents represent a new class of AI agents that are autonomous, massively scalable, and work for hours or days without constant intervention.
AWS DevOps Agent investigates incidents and identifies operational improvements as an experienced DevOps engineer would: by learning your resources and their relationships, working with your observability tools, runbooks, code repositories, and CI/CD pipelines, and correlating telemetry, code, and deployment data across all of them to understand the relationships between your application resources. AWS DevOps Agent integrates with Dynatrace, combining the power of the frontier agent, a new class of AI agents, with causal and predictive AI for complete event resolution.
Together, these services deliver autonomous event management: from detecting performance degradations and quantifying business impact, to investigating root causes across your infrastructure, and providing actionable mitigation steps. No custom alarms to configure, no manual log correlation, no context switching between tools. AWS DevOps Agent acts as an autonomous agent that independently investigates issues across your AWS, multicloud, and hybrid environments, while Dynatrace provides the observability foundation that detects problems and measures their impact.
In this post, we’ll walk through a real-world example: a Customer Relationship Management (CRM) application that suddenly slows down from 1ms to 1-second response times. You’ll see how Dynatrace detects the issue and quantifies user impact, then how AWS DevOps Agent autonomously investigates to find that a dropped database index is the culprit, complete with the exact SQL statement to fix it. While we use a database example here, this approach works across AWS services, including: AWS Lambda function errors, Amazon Elastic Kubernetes Service (Amazon EKS) container failures, Amazon Virtual Private Cloud (Amazon VPC) connectivity issues, and other events.
Walkthrough: from slowdown to resolution
Let’s explore how autonomous investigation works in practice.
Prerequisites
To use AWS DevOps Agent (Preview) with Dynatrace in your own environment, you’ll need:
- An application running on AWS
- Dynatrace instrumentation for your application
- AWS DevOps Agent (Preview) configured – Follow the getting started guide
- Dynatrace integration enabled – Follow the integration guide
Example Scenario
Our example CRM application has a React frontend served from Amazon Simple Storage Service (Amazon S3) through Amazon CloudFront, and a backend API built with an Application Load Balancer (ALB), Amazon Elastic Compute Cloud (Amazon EC2) instances running Python applications, and an Amazon Relational Database Service (Amazon RDS) for PostgreSQL database. The following figure illustrates this architecture.
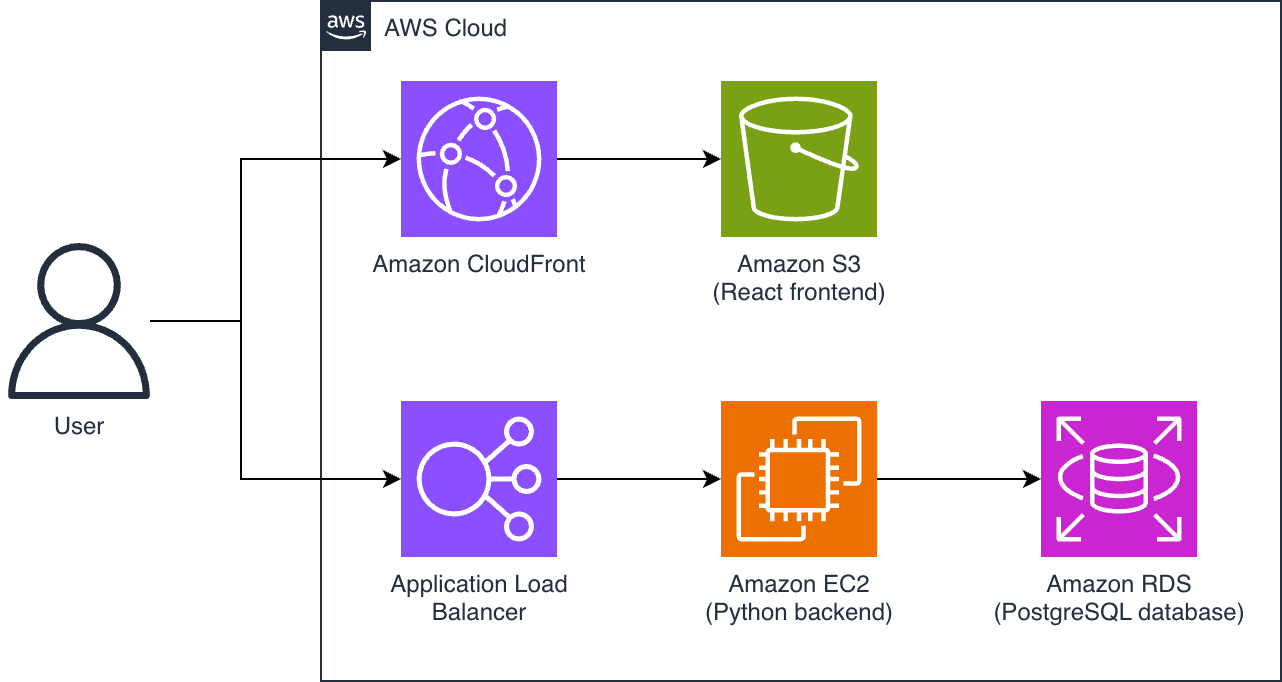
Figure 1 – architecture of our example CRM application
The application normally responds in 1 millisecond, but response times suddenly jump to 1 second or more.
Step 1: Dynatrace detects the problem with business impact
Dynatrace Davis AI, the causal AI engine, continuously baselines application performance without manual configuration. It understands normal behavior for every component and automatically detects when something deviates from that baseline.
Within moments of the slowdown, Davis AI identifies the anomaly. But unlike traditional monitoring that just shows a metric spike, Dynatrace provides complete context:
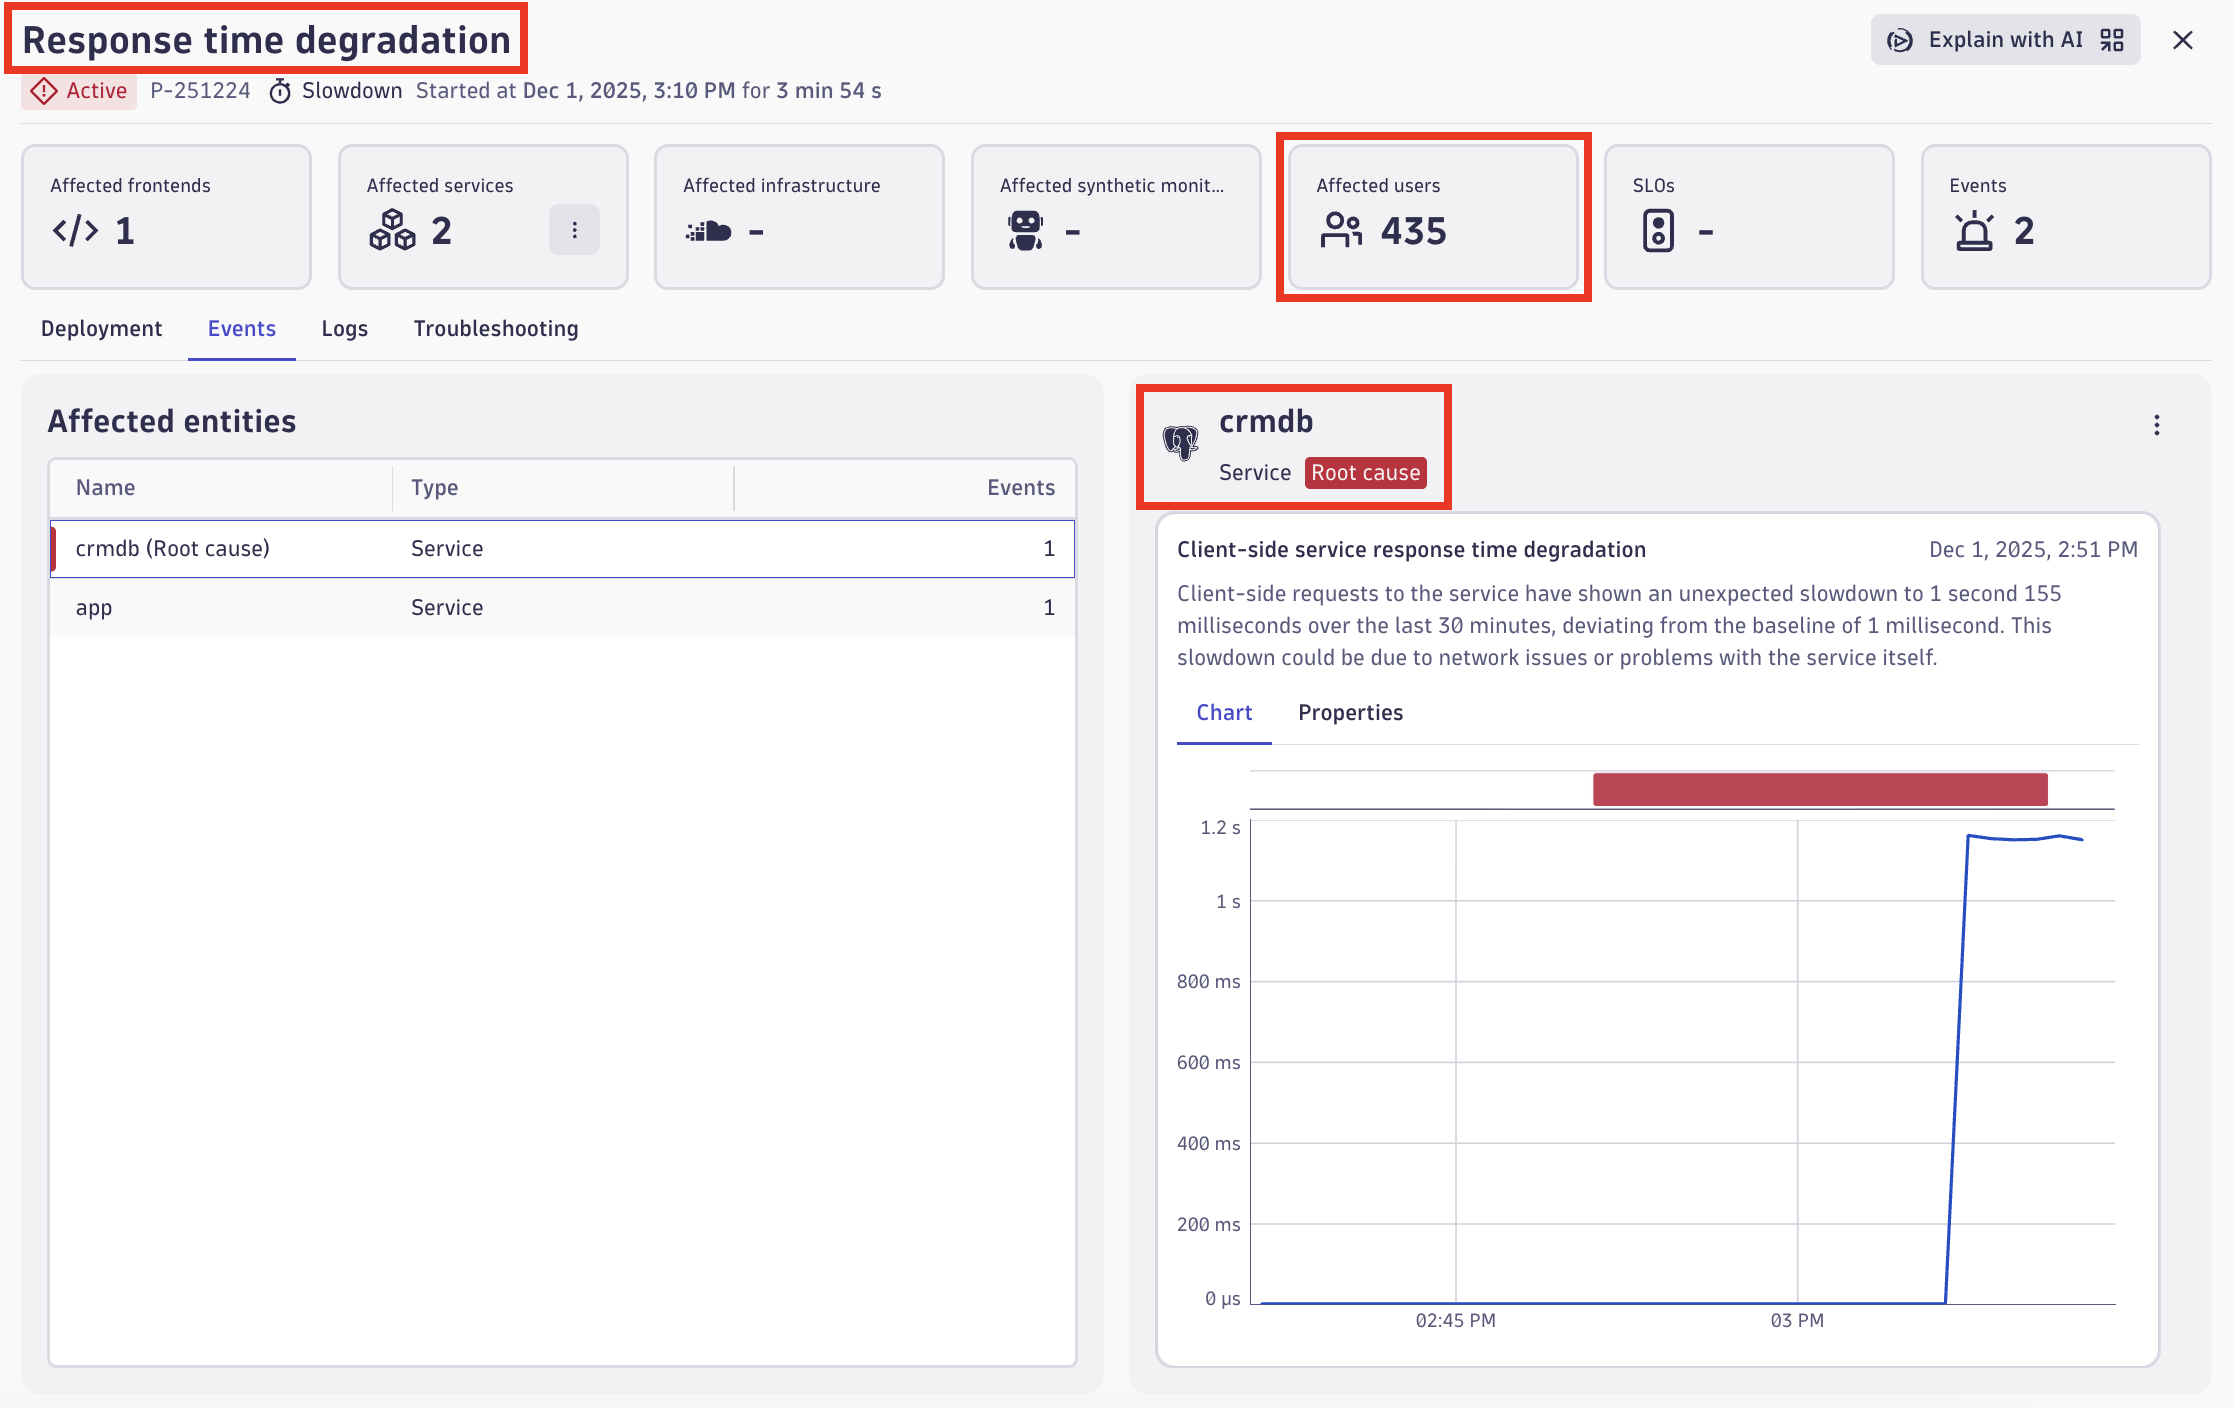
Figure 2 – Dynatrace problem screen showing response time degradation and business impact
Dynatrace Real User Monitoring measures user experience and quantifies the number of customers affected. In this case, 435 users are experiencing degraded performance. The backend instrumentation through Dynatrace OneAgent traces each request through the architecture: from the Application Load Balancer through Amazon EC2 instances and into the PostgreSQL database. The Dynatrace Smartscape automatic topology mapping feature pinpoints the database queries as the source of the slowdown. Davis AI establishes the baseline, detects the deviation, traces the cause through your architecture, and quantifies the business impact automatically. You don’t need to configure custom alarms for response time thresholds, manual correlation rules, or dashboards.
Then, Dynatrace automatically triggers an AWS DevOps Agent investigation, handing off the problem details for deeper root cause analysis.
Step 2: AWS DevOps Agent investigation results in Dynatrace
AWS DevOps Agent receives the problem details from Dynatrace and begins its autonomous investigation. Once the investigation completes, the findings appear directly in your Dynatrace environment, so there is no need to switch tools for initial triage.
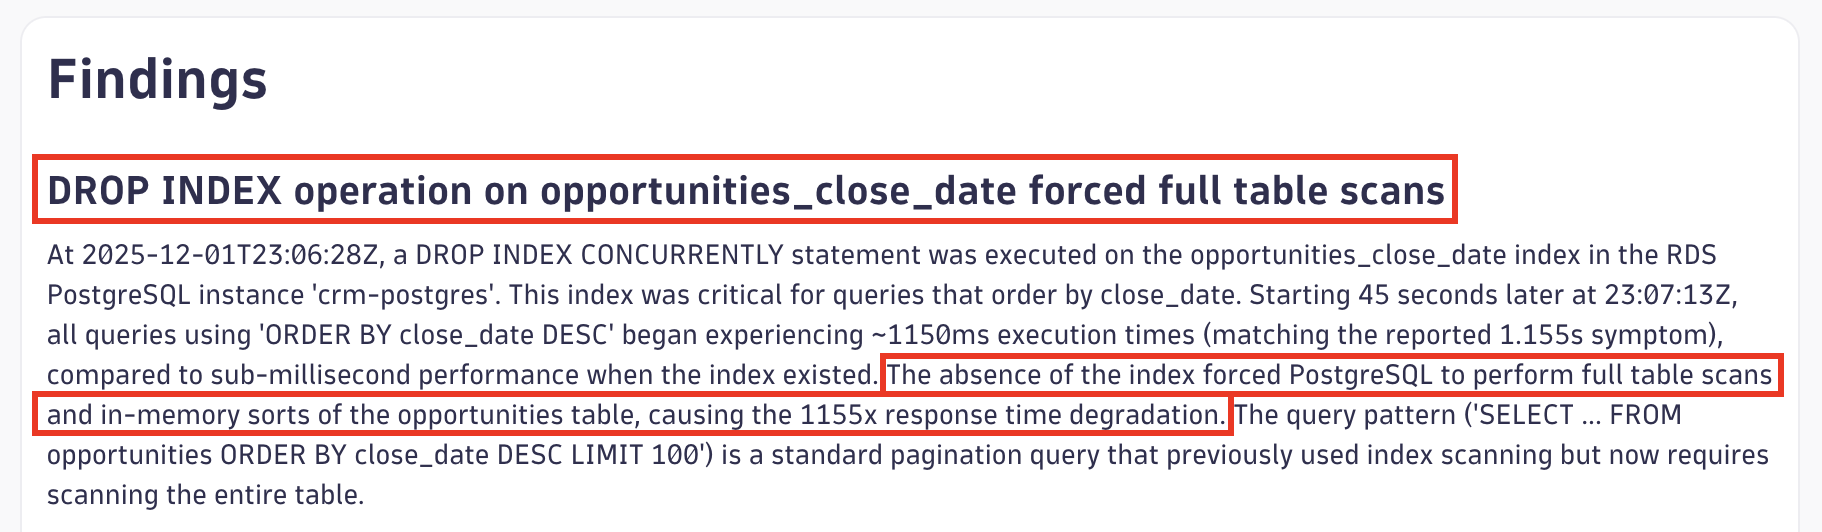
Figure 3 – Dynatrace problem enriched with AWS DevOps Agent findings
This summary provides immediate visibility into both the symptom (database slowness) and the root cause (dropped index) without leaving Dynatrace. Notice how AWS DevOps Agent confirms the Dynatrace finding of database slowness, then enriches it by discovering why the database is slow. Dynatrace uses its instrumentation and tracing to pinpoint that the database is the bottleneck, and AWS DevOps Agent investigates configuration changes and database-level logs to uncover that a dropped index is the underlying cause.
Dynatrace also provides a dashboard showing historical problems investigated by AWS DevOps Agent:
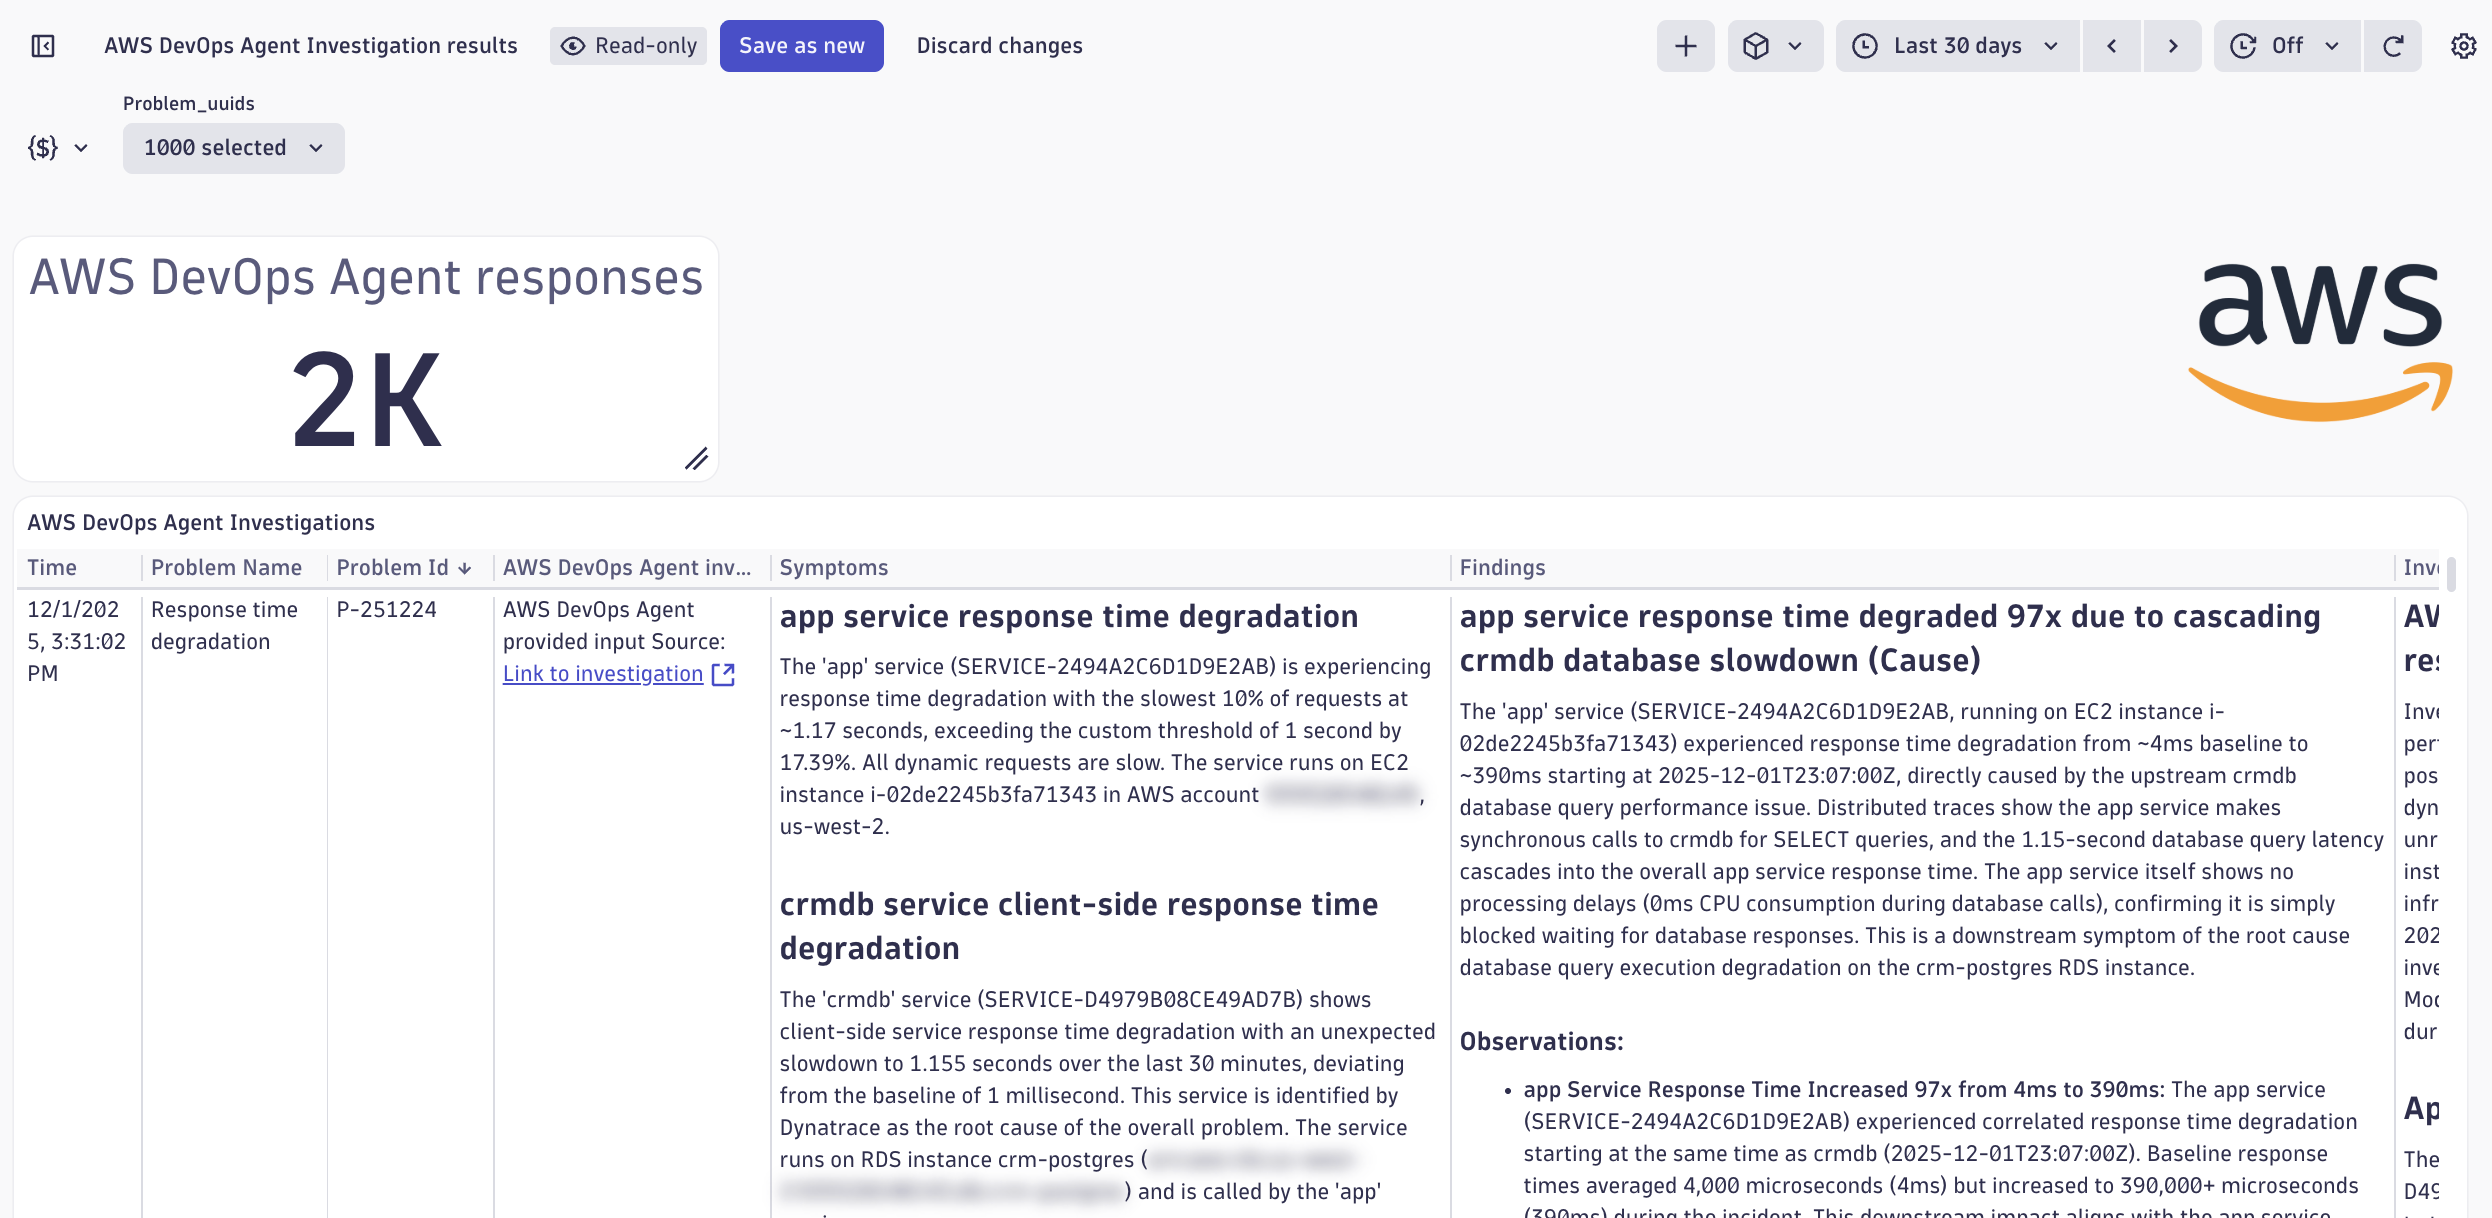
Figure 4 – Dynatrace dashboard with historical AWS DevOps Agent investigations
This historical view helps you identify patterns across issues and learn from past investigations.
Step 3: Detailed investigation in the AWS DevOps Agent console
For the complete investigation details, choose Link to investigation from Dynatrace to open the AWS DevOps Agent investigation page. This single page contains additional information to understand what happened and why.
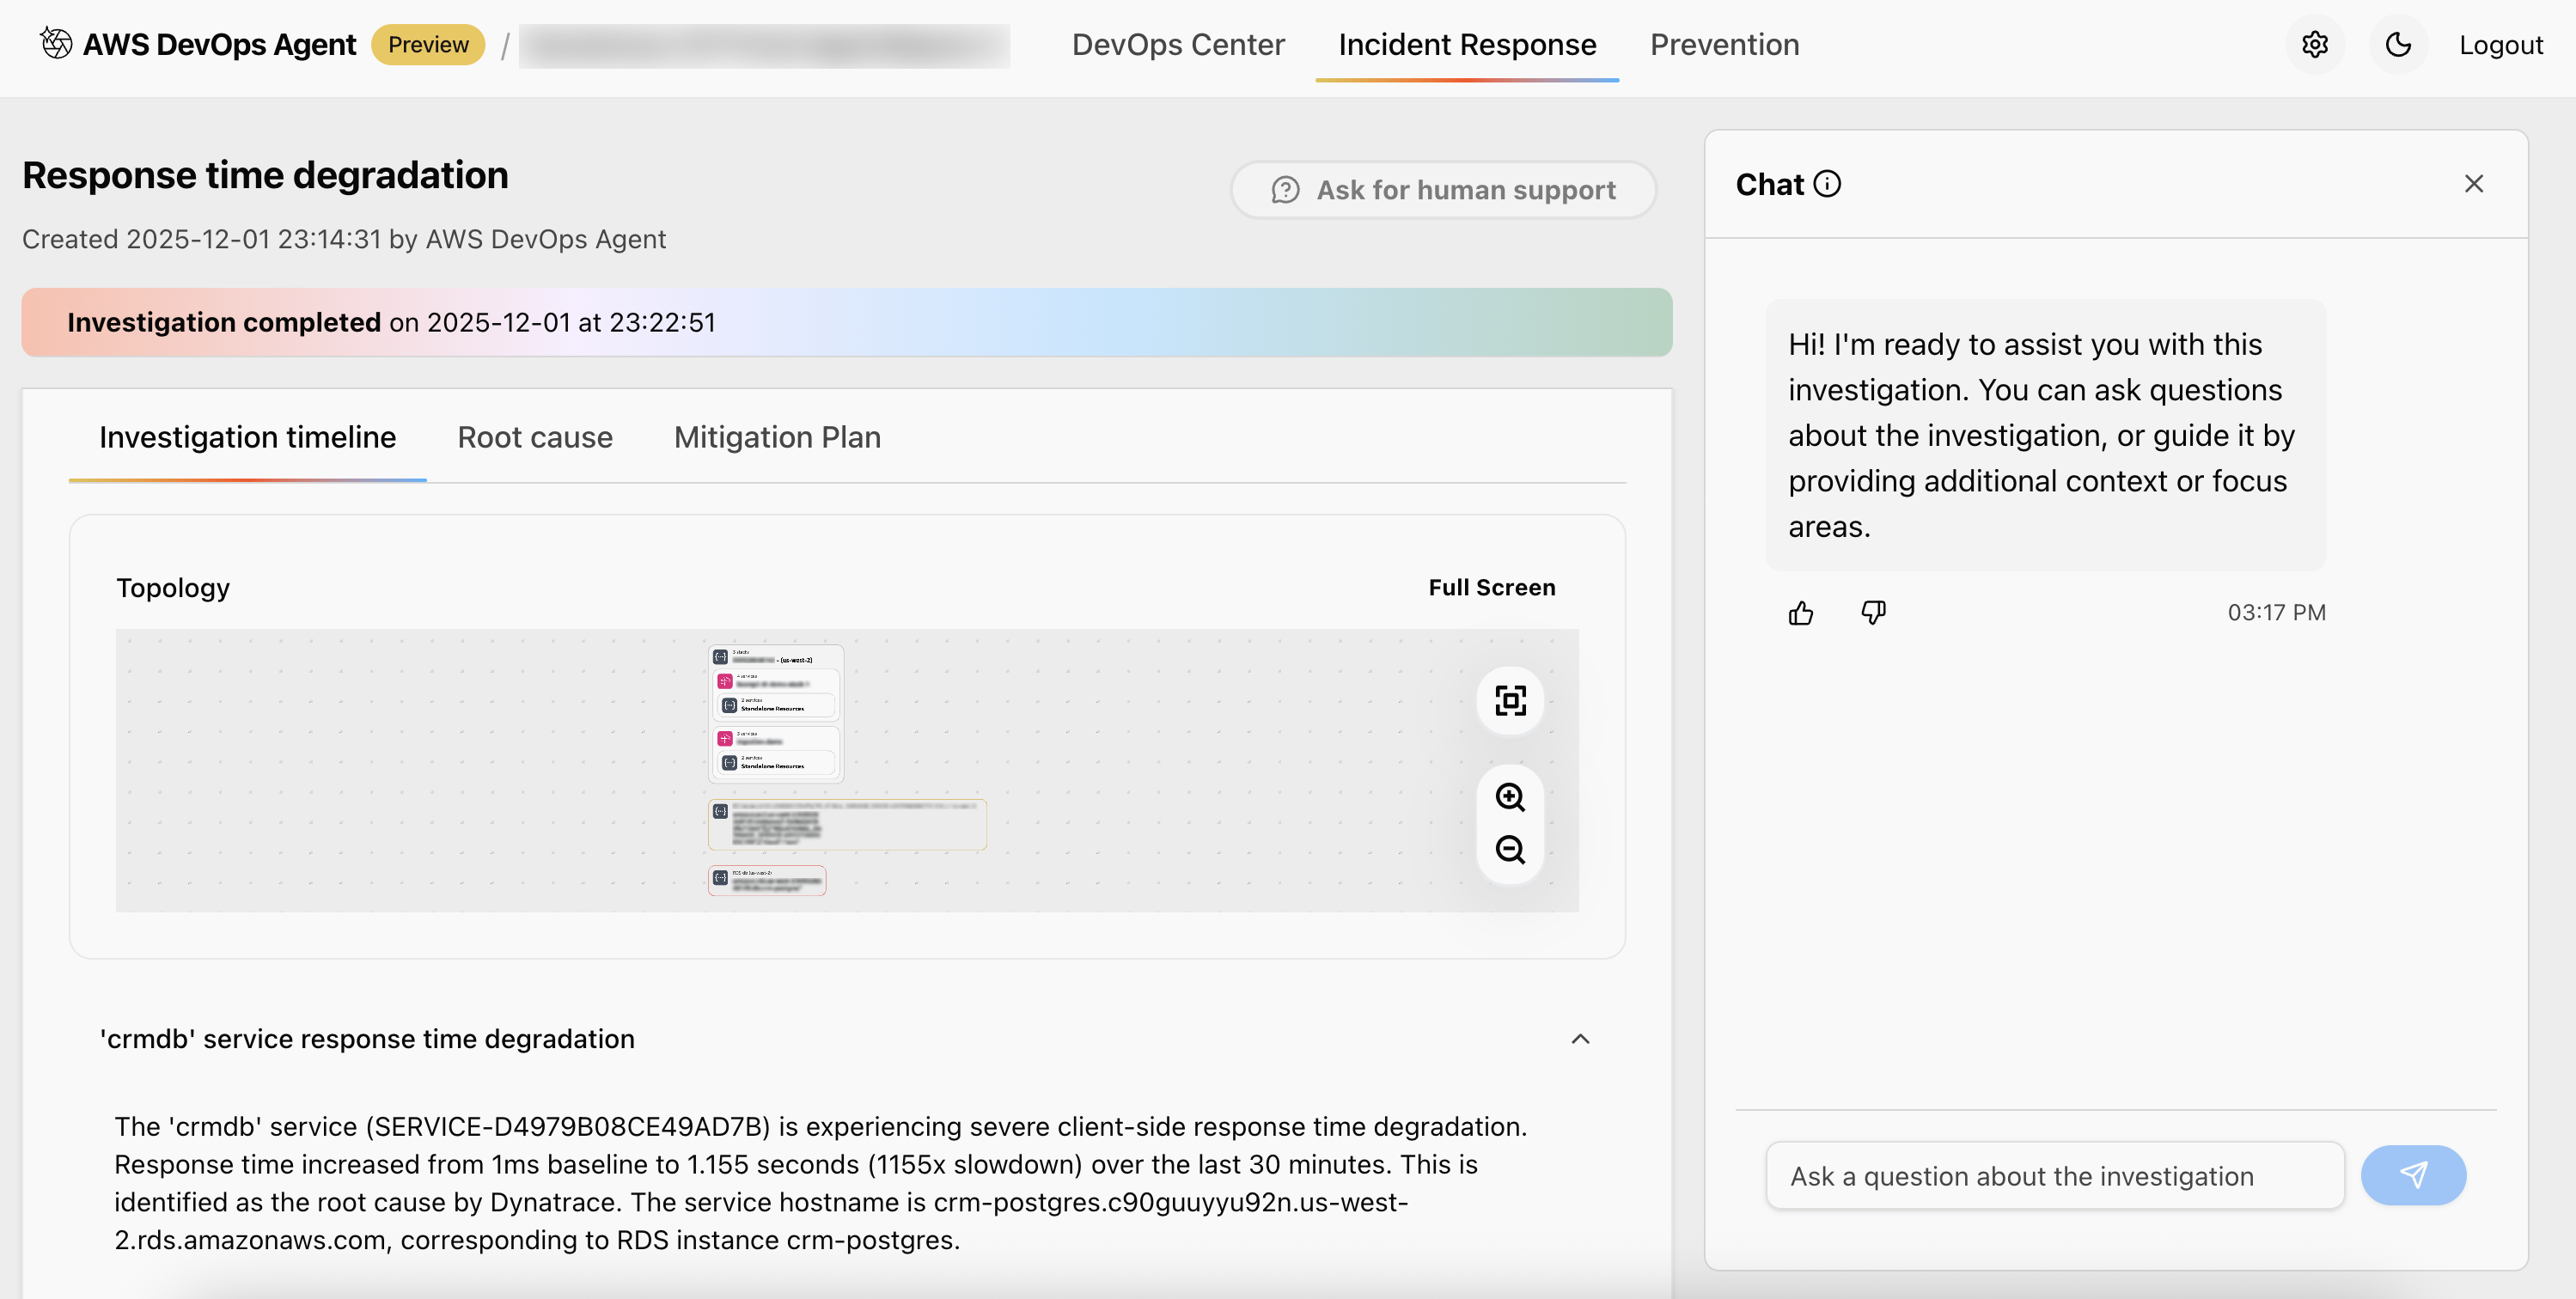
Figure 5 – AWS DevOps Agent investigation page with timeline, findings, and interactive chat
The investigation timeline shows the autonomous work performed by AWS DevOps Agent:
Figure 6 – AWS DevOps Agent investigation timeline
The root cause section explains what caused the issue:
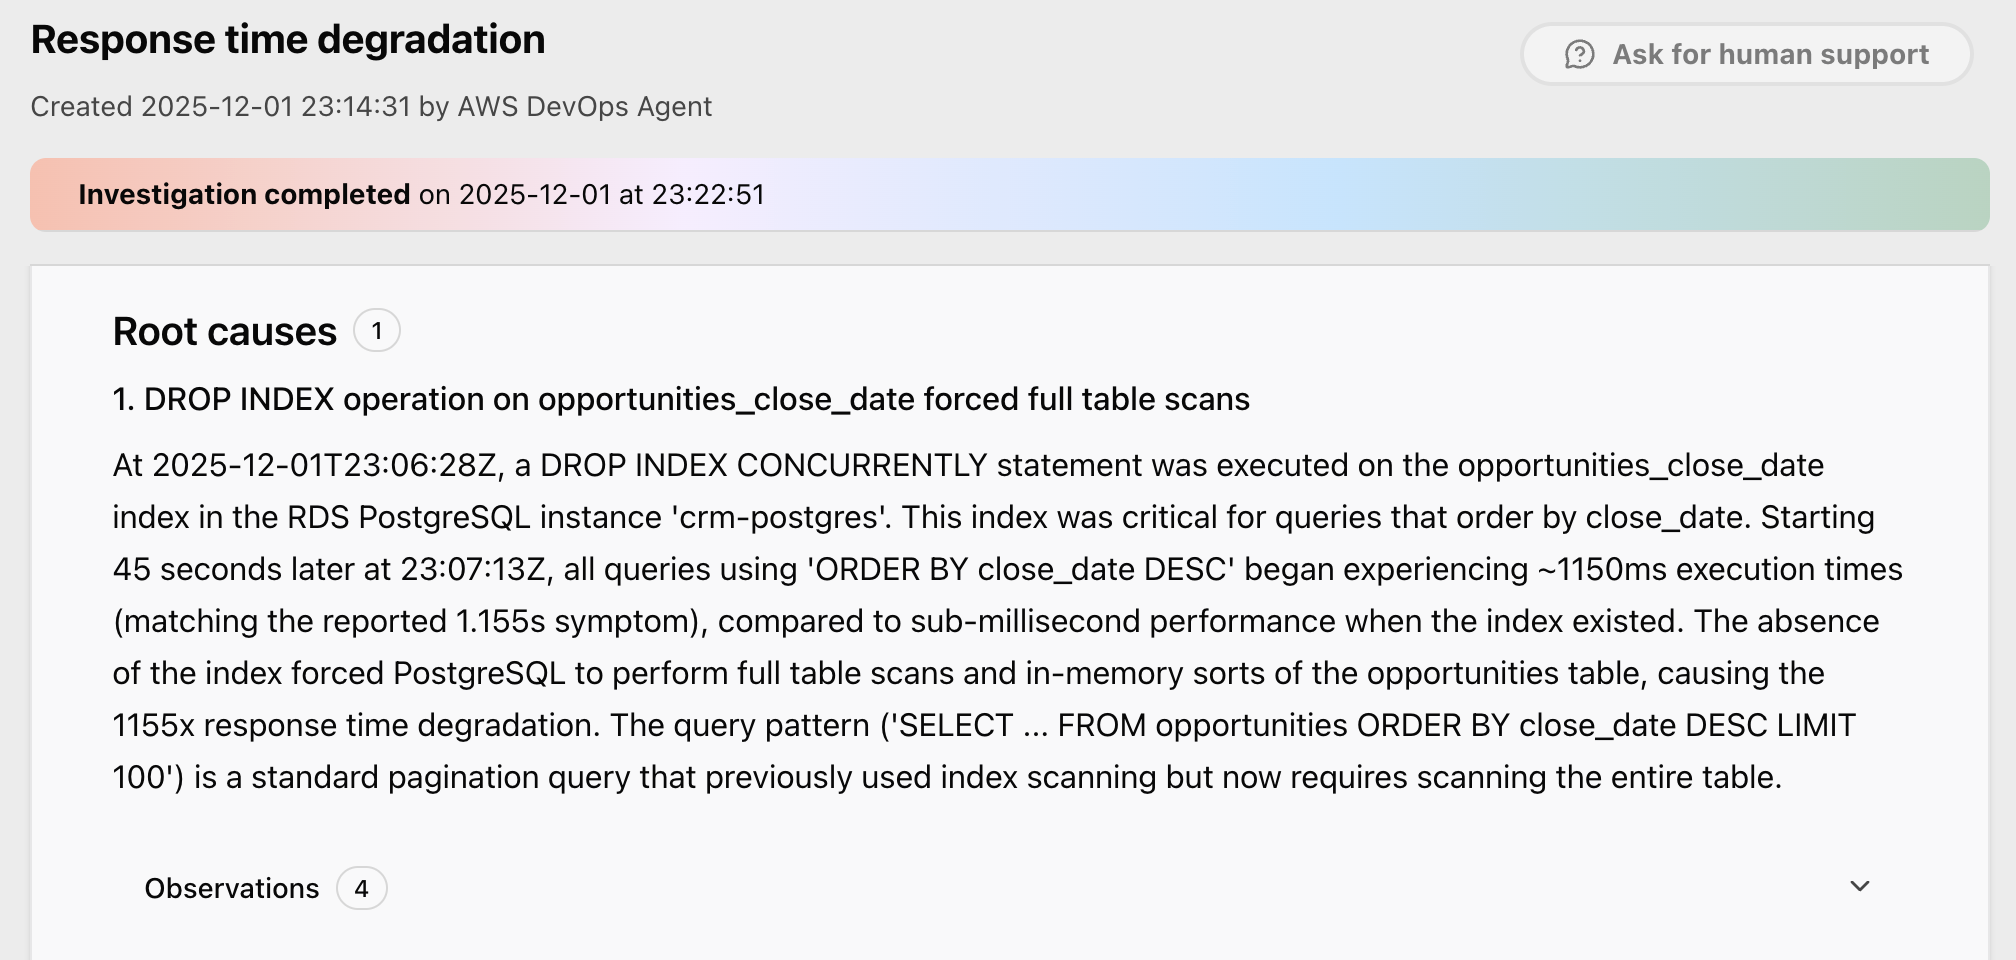
Figure 7 – root cause identified by AWS DevOps Agent
Notice how AWS DevOps Agent starts from the problem description shared by Dynatrace, then autonomously gathers evidence from multiple sources, including: Dynatrace Query Language (DQL) queries to extract topology and performance data, Dynatrace traces for request analysis, Amazon CloudWatch metrics, AWS CloudTrail logs for infrastructure changes, and Amazon RDS PostgreSQL logs for slow queries and database operations. The agent correlates the timing between the index drop and performance degradation, validates the impact through database logs and distributed traces, and identifies the root cause.
Step 4: Understanding and implementing the mitigation plan
The AWS DevOps Agent investigation page isn’t just a static report; it’s interactive. On the same page, you’ll find a chat interface where you can ask questions to deepen your understanding or explore related concerns.
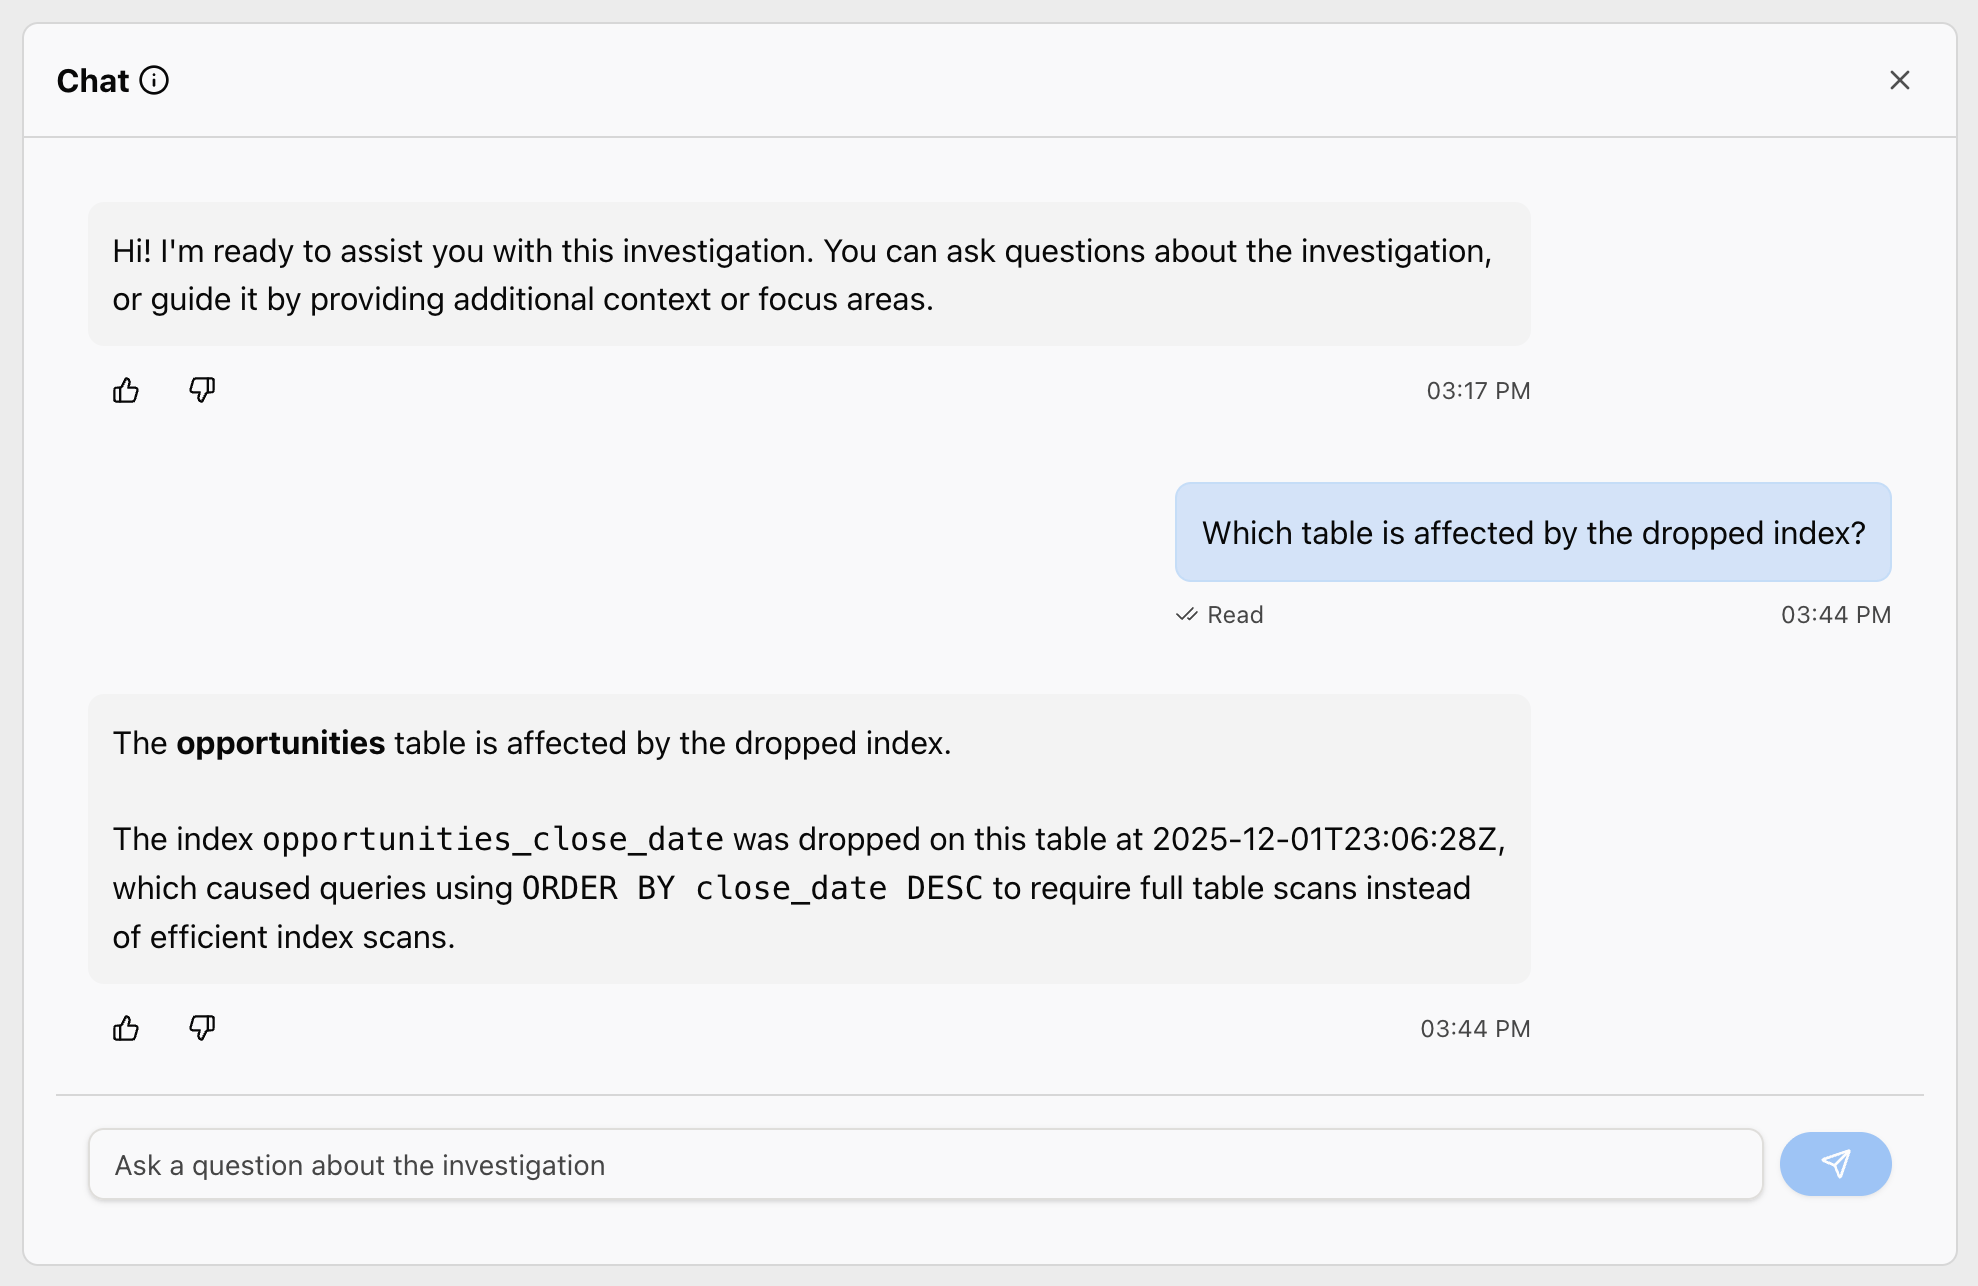
Figure 8 – AWS DevOps Agent chat interface
And to fix the issue, you can generate a mitigation plan directly from the same page. Choose Generate Mitigation Plan, which opens a new tab and within minutes provides structured mitigation steps. The plan follows a systematic approach with four phases:
- Prepare – Identify current system status before any changes
- Pre-validate – Test preconditions to ensure the system is ready for the change
- Apply – Execute the changes to address the issue
- Post-validate – Monitor system health to confirm the issue is resolved
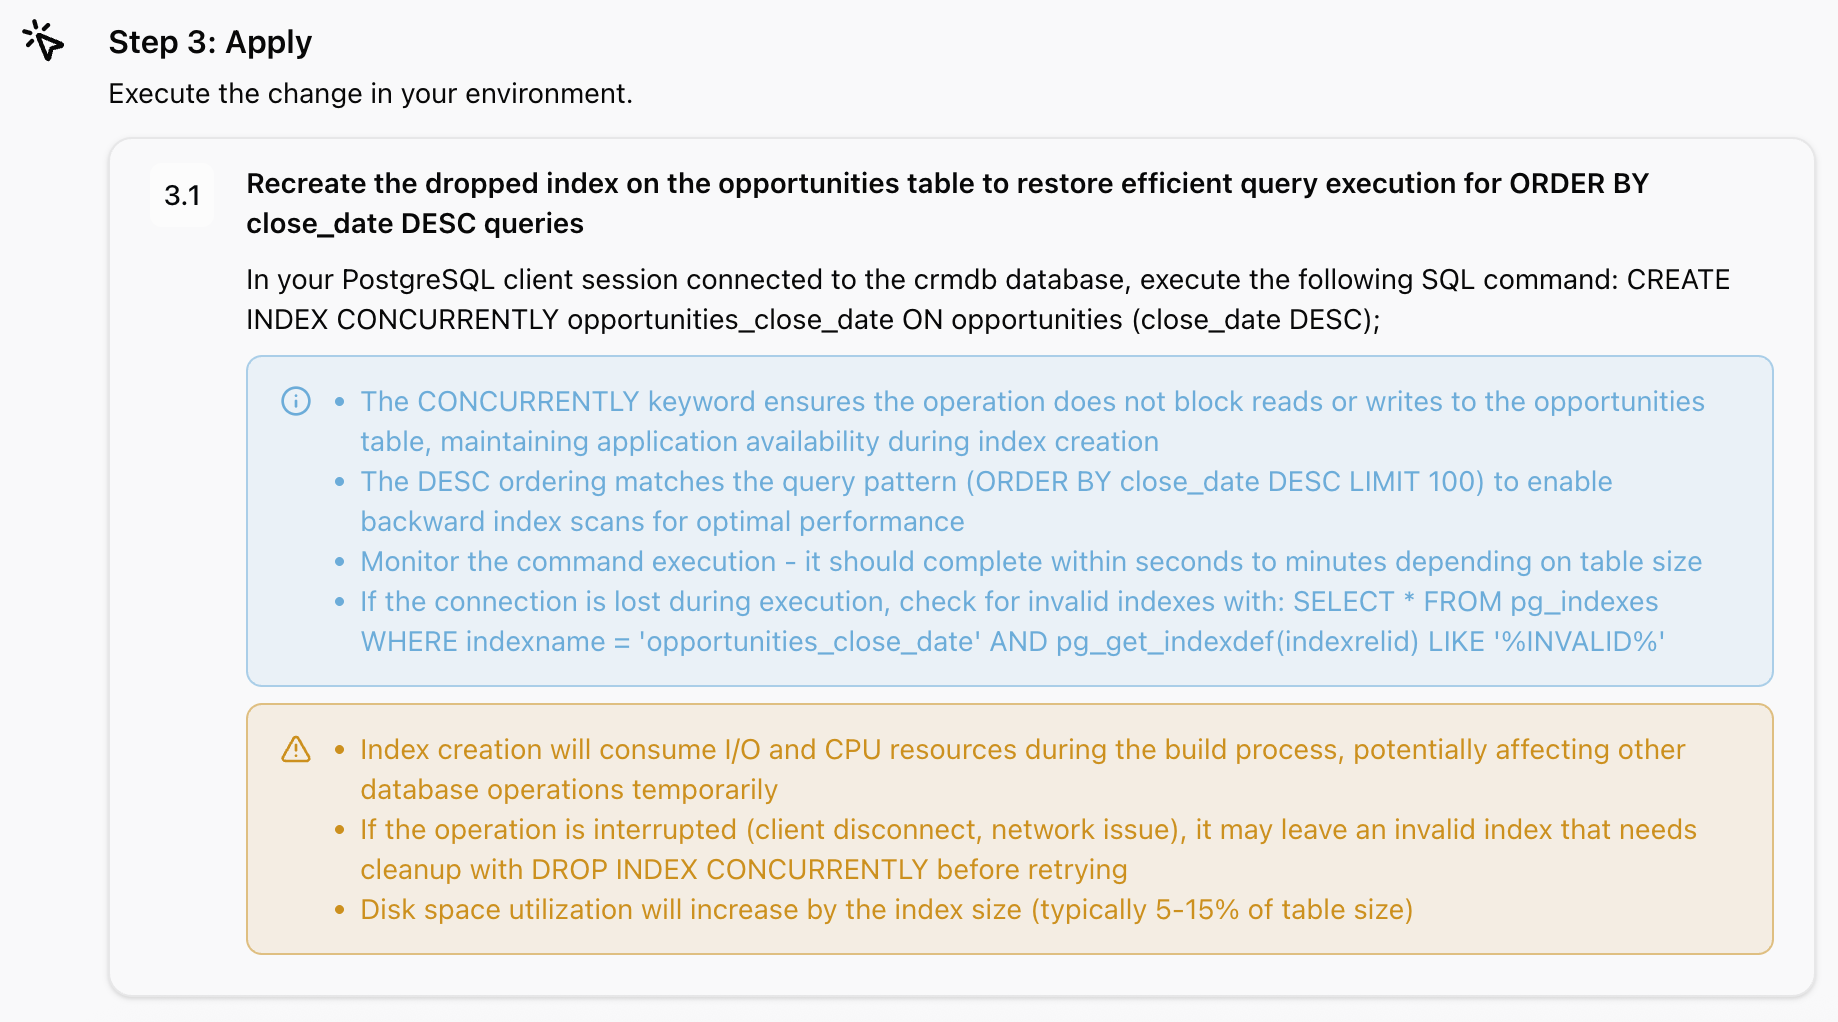
Figure 9 – AWS DevOps Agent mitigation
For our database index issue, the mitigation plan provides the exact SQL statement to recreate the index, along with validation steps to ensure the fix is successful. Within moments of executing the plan, response times return to baseline. Your CRM application is healthy again, and you have a complete audit trail of what happened, why it happened, and how you fixed it.
Why this matters: Autonomous troubleshooting
This isn’t just faster troubleshooting; it’s a fundamentally different approach. Traditional observability tells you what is slow. Dynatrace tells you what is slow, where in your architecture the problem originates, and how many users are affected. AWS DevOps Agent enriches that finding by investigating why through configuration changes, deployment history, and infrastructure modifications. Dynatrace observability pinpoints the single SQL statements to your database as the bottleneck, while the investigation from AWS DevOps Agent discovers that a dropped index is the reason for the database slowdown.
Beyond the native capabilities shown in this post, AWS DevOps Agent can be extended with custom integrations through Model Context Protocol (MCP) servers, enabling you to add specialized analysis tools like a PostgreSQL MCP server for deeper database insights.
The database example we walked through is just one scenario. Here are other example situations where this autonomous investigation works:
- Lambda function errors – Dynatrace detects increased error rates; AWS DevOps Agent investigates AWS Identity and Access Management (IAM) permissions, environment variables, Amazon VPC configurations, and recent code deployments.
- Container startup failures – Dynatrace identifies pods failing to start; AWS DevOps Agent examines container image availability, pod specifications, security group rules, and resource quotas.
- API throttling – Dynatrace shows increased latency and throttling errors; AWS DevOps Agent investigates Amazon API Gateway throttling targets, Amazon Lambda concurrency settings, and Amazon DynamoDB capacity.
- Network connectivity issues – Dynatrace traces show timeouts; AWS DevOps Agent examines Amazon VPC route tables, security groups, network access control lists, and recent network changes
In each case, you get the same autonomous workflow: automatic detection, business impact quantification, deeper root cause investigation, and an actionable mitigation plan.
Conclusion: Get started with autonomous investigation
We’ve walked through a complete issue lifecycle: from Dynatrace detecting a CRM application slowdown and quantifying its business impact, through the autonomous investigation from AWS DevOps Agent discovering a dropped database index, to receiving the exact SQL statement needed to fix it. This happened automatically, without custom configuration, manual log correlation, or context switching between tools.
This is the power of combining the frontier agent for operational excellence with causal and predictive AI. AWS DevOps Agent accesses the insights from Dynatrace Davis AI, correlating your telemetry to autonomously triage operational issues and provide a mitigation plan.
Ready to experience autonomous issue investigation?
Get started:
- Configure AWS DevOps Agent (Preview) – Follow the getting started guide
- Enable Dynatrace integration – Follow the integration guide
- Learn more about AWS DevOps Agent (Preview) – Read the launch announcement