AWS for Industries
GenAI in Factor Modeling Data Pipelines: A Hedge Fund Workflow on AWS
Introduction
Factor modeling in hedge funds is a quantitative approach that identifies and analyzes key drivers of asset returns. It lets fund managers to optimize portfolios, manage risk, and generate alpha by leveraging vast amounts of market data. This technique facilitates the development of sophisticated trading strategies, enhancing investment performance and providing a competitive edge in the financial markets.
This post explores how integrating AWS serverless patterns and GenAI services create a robust factor modeling pipeline to address these challenges. We delve into the technical aspects of workflow implementation, providing GitHub code samples you can quickly deploy or modify to find the right factors. Our target audience includes quant developers seeking to enhance their firm’s computational capabilities and portfolio managers looking to leverage alternative data for alpha generation.
The classic book Quantitative Equity Portfolio Management: An Active Approach to Portfolio Construction and Management highlights the challenges in factor modeling. Manual factor identification and calculation across thousands of securities is not only time-consuming but also prone to errors and constrained by computational limitations. As datasets expand to include alternative sources, like market news and unstructured financial documents, scalability becomes a critical issue.
By leveraging cloud services to build a factor modeling platform, investment firms streamline back-testing processes, extract nuanced signals from textual data, and adapt swiftly to changing market conditions. This approach enables quant teams to focus on model development rather than infrastructure management, facilitating faster iteration and deployment of investment strategies. Ultimately, this modern, cloud-native factor modeling platform empowers financial professionals to make informed, data-driven investment decisions and enhance portfolio performance.
Solution overview
Our solution presents an end-to-end data processing application for quantitative finance factor modeling. This architecture helps hedge funds and quantitative analysts to identify and quantify underlying drivers of asset returns through a combination of financial data and social media sentiment analysis. When the automated processing steps complete, they produce the output factors for portfolio construction, risk management, and trading strategy development.
The following diagram illustrates the architecture and workflow of the proposed solution:
 Figure 1 Factor modeling data pipeline and factor mining reference architecture
The following highlights the key components.
1 Serverless Data Collection
1.1 Yahoo finance market data collection
Hedge funds rely heavily on market data for their trading strategies and risk management. The AWS Lambda function daily tick data uses Yahoo finance to download the daily Open, High, Low, Close, and Volume (OHLCV) data. Adjust this function to select your own data vendor for market data.
There are cases where market data vendors and brokers require clients to provide static IP addresses for their allow-lists. NAT Gateways provide a consistent static source IP address for outbound traffic to meet vendors’ static IP requirements.
1.2 Web search by Tavily
Hedge funds are embracing alternative data and GenAI to gain a competitive edge. GenAI’s advanced text processing capabilities make it ideal for analyzing diverse, unstructured data sources. This powerful combination empowers funds to uncover hidden patterns, anticipate market trends, and make informed investment decisions, potentially leading to superior returns.
Tavily offers AI-powered web search, allowing for targeted retrieval of news, analyst reports, and other web content relevant to factor modeling. The function web search uses Tavily’s API to search the news related to stocks. After you get the news, the framework uses the following prompt to generate sentiments for the stock market news:
You can engineer the prompt based on your factor requirements.
1.3 SEC filing retrieval
SEC filings are crucial documents that public companies must submit to the U.S. Securities and Exchange Commission (SEC). Two key filings are, 10-K Annual report, which providing a comprehensive overview of the company’s financial condition, including audited financial statements. The second is the 10-Q Quarterly report, with unaudited financial statements and operational updates. These filings contain valuable data for factor modeling, such as financial ratios, revenue breakdowns, etc.
The Lambda function fetch SEC uses SEC’s EDGAR API to download SEC filings in JSON format. You can schedule these serverless functions to run periodically, fetching the latest filings for companies of interest. AWS Lambda’s ability to scale automatically makes it ideal for handling varying loads, especially during peak filing seasons.
1.4 Financial report processing
There are unstructured data points not included in the EDGAR API response. We can upload financial report PDF files to Amazon Simple Storage Service (Amazon S3) with that information, such as CEO statements, ESG initiatives, and strategic priorities. When you upload a file to Amazon S3, S3’s event notifications trigger Lambda functions. The Lambda function financial report processor uses a prompt to extract unstructured data from financial reports. For example:
2 Data storage with OLAP database
Our reference implementation uses ClickHouse columnar database for storing factor modeling values and results. This type of database is optimized for analytical workloads and handles large volumes of structured data. However, the data layer can use different technologies based on specific requirements and existing infrastructure, such as Amazon Redshift or Amazon SageMaker Lakehouse.
This framework contains four main tables: factor_details, factor_summary, factor_timeseries, and factor_values. Here’s a description of their design for factor modeling:
- factor_values table stores individual factor values for specific tickers and dates with columns: Factor identification (name, type), Ticker, Datetime, Value.
- factor_timeseries table stores factor values and associated portfolio returns over time with columns: Factor identification (name, type), Datetime, Factor value, High and low portfolio returns.
- factor_details table stores detailed information about individual factors for specific tickers with columns: Factor identification (name, type), Ticker, Statistical measures (beta, t-statistic, p-value, r-squared), Confidence intervals.
- factor_summary table summarizes factor performance over a period. Its columns are: Factor identification (name, type), Date range (start_date, end_date), Statistical measures (avg_beta, avg_tstat, avg_rsquared), Stock counts (significant_stocks, total_stocks), and Performance metrics (annualized_return, annualized_volatility, sharpe_ratio, max_drawdown).
3 Factor mining with parallel computing
Identifying and calculating factors across thousands of securities is time-consuming and constrained by on-premises computational limitations. AWS Batch and AWS Step Functions create a powerful parallel computing solution for factor modeling, orchestrating complex workflows efficiently.
3.1 AWS Batch
Factor mining involves three steps:
1) Calculating daily factor values for stocks and forming portfolios based on factor rankings.
2) Regression to calculate stock-specific factor betas.
3) Assessing factor predictive power and robustness by t-statistics and R-squared.
AWS Batch excels at managing compute environments, job queues, and job definitions. It automatically provisions compute resources for the factor mining. Run thousands of AWS Batch parallel tasks based on the number of tickers and back-testing date ranges requirements.
3.2 AWS Step functions
Step Functions complements AWS Batch by providing a visual workflow to orchestrate parallel batch processes. It allows you to define the sequence of operations, manage state transitions, and handle errors gracefully.
Step Functions start parallel AWS Batch jobs for each layer in factor mining:
- Factor: Different factors will be calculated in parallel.
- Ticker: Analyze multiple stock tickers concurrently.
- Date: Process historical data for various time ranges simultaneously.
4 Visualization of mining results with Streamlit
This framework features a visualization dashboard that displays factor effectiveness using Streamlit. The dashboard provides a clear view of the mining process and its results for factor selection for future trading strategy development.
Using the deployed solution
This section explains how to trigger and interact with the key components of our deployed system. You’ll find instructions for running Lambda functions (both scheduled and manual), retrieving market data, processing financial reports through S3 uploads, and running factor mining workflows via AWS Step Functions. These guidelines will help you effectively use the system’s capabilities for financial data extraction, sentiment analysis, and factor mining, whether you need immediate results or scheduled automated processes.
1 Automatic events
1.1 For the Lambda functions sec-data-lambda and stock_news_fetcher
An Amazon EventBridge event scheduler triggers these two Lambda functions. They operate on a predefined schedule to extract data periodically. If you want to change the data extraction frequency, please edit daily-sec-filing-trigger and daily-stock-news-trigger rules in the Amazon EventBridge console.
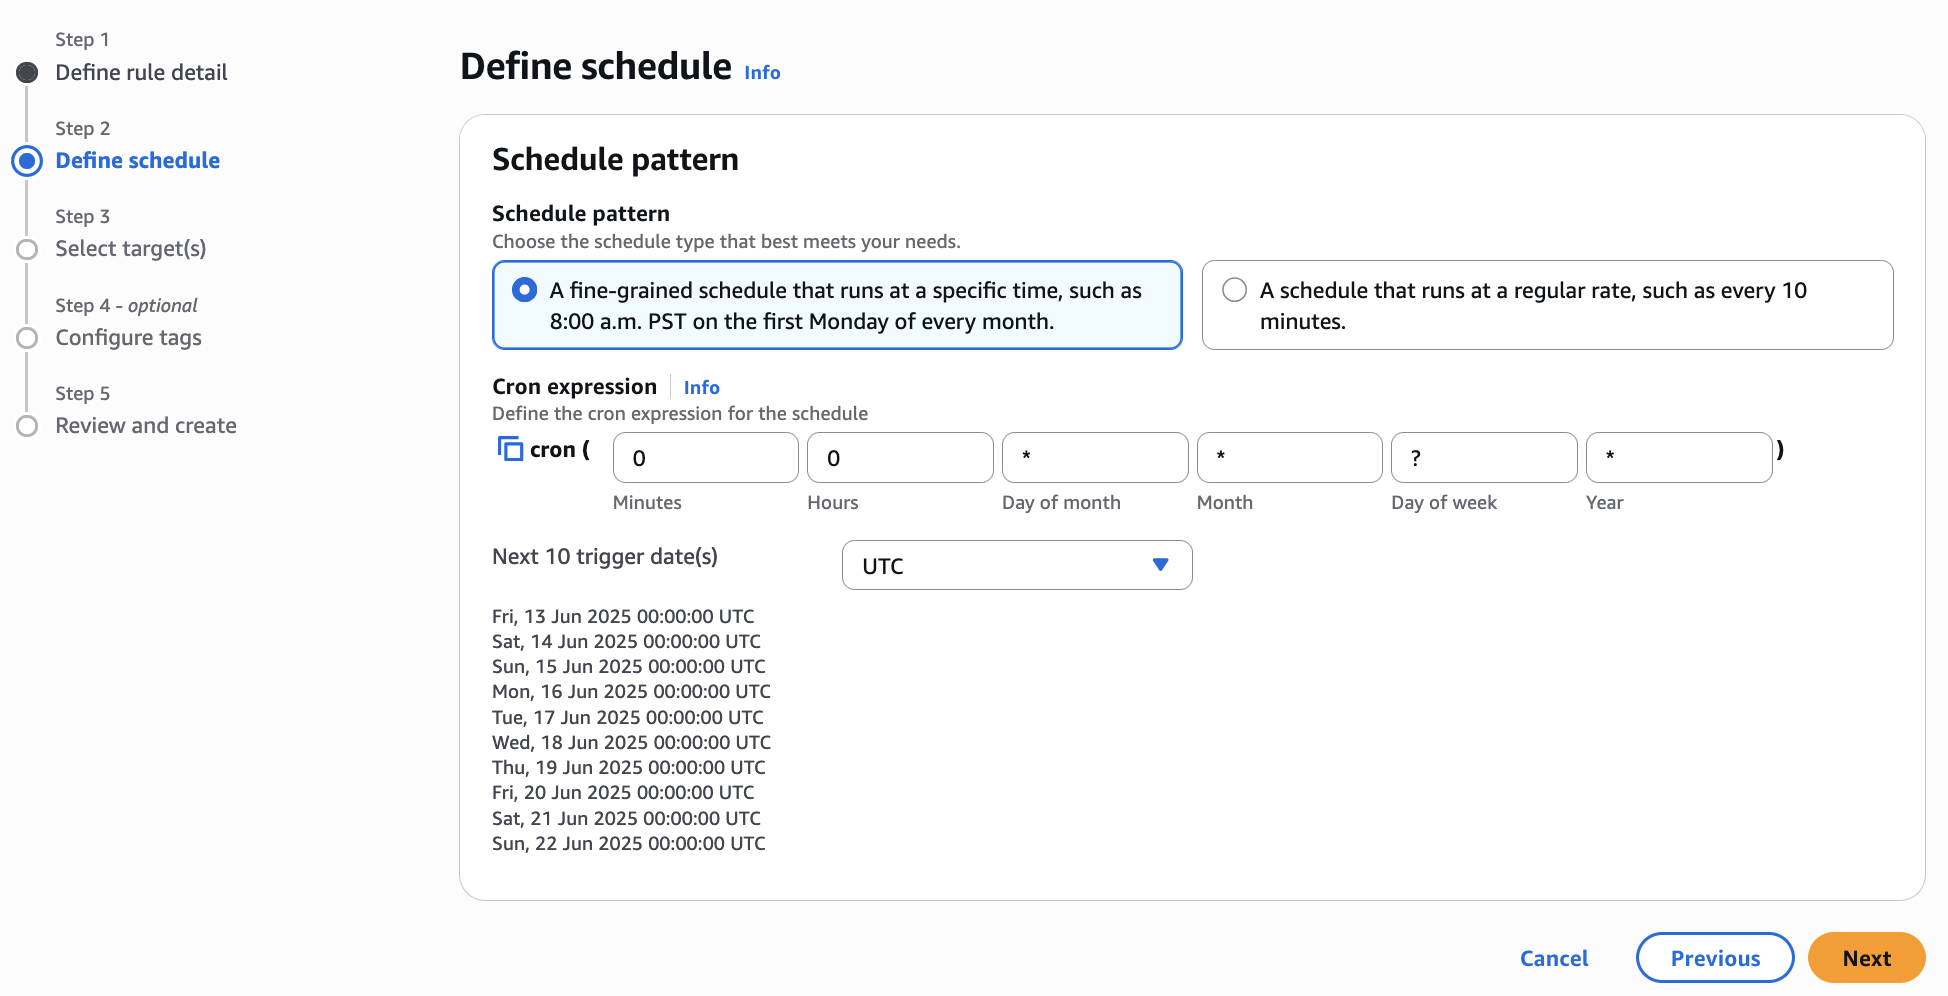 Figure 2 Using AWS EventBridge to trigger your lambda functions automatically
To manually run the Lambda functions to see the data extraction results, open the AWS Lambda console, select the function, navigate to the “Test” tab, and select the “Test” button. This will immediately run the Lambda function.
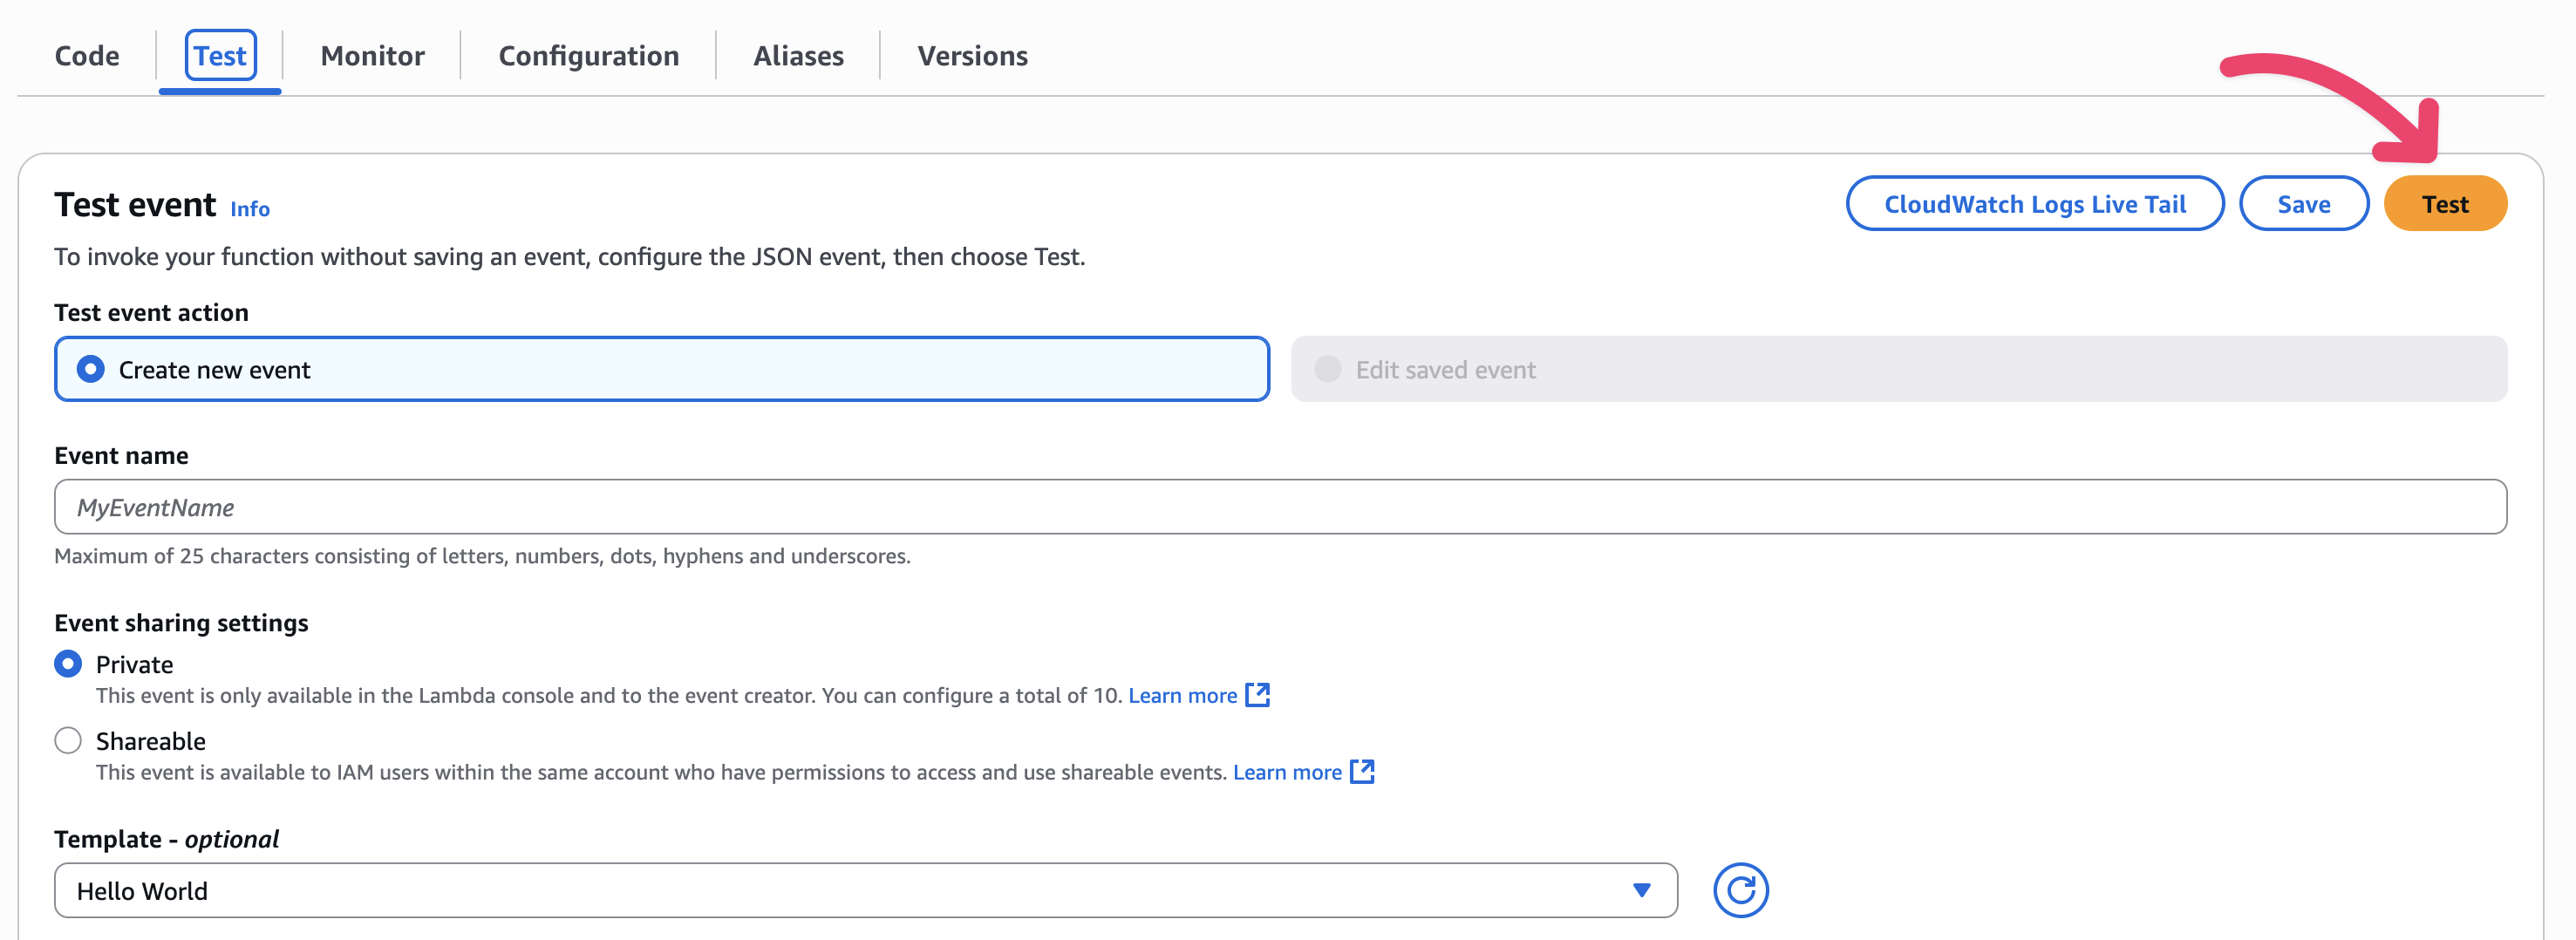 Figure 3 Run AWS Lambda by Test function
1.2 For the Lambda function market-data-collector
This function will retrieve the historical market data using the yfinance API (Yahoo Finance). Run function manually by selecting the Test button in the AWS Lambda console. Likewise, to retrieve the daily market data update automatically, use an AWS EventBridge daily schedule to trigger this function during off-market hours.
Please note that yfinance is a free API with rate limitations that might cause occasional failures. During testing, expect intermittent timeouts or incomplete data retrieval due to these constraints.
For production environments, we strongly recommend using commercial, stable third-party APIs for market data acquisition to ensure reliability and consistent performance.
2 Upload financial reports to S3
To trigger the financial_report_processor Lambda function, use the following steps:
- Use a financial report in PDF file format. For example, Amazon’s 2024 annual report.
- Rename and upload the PDF to the S3 bucket, for example
financial-reports-bucket,following this path structure and PDF naming to show the date of the report.
financial-reports-bucket/ticker/year/YYYYMMDD.pdf
For example,
financial-reports-bucket/AMZN/2025/20250501.pdf
After uploading the file, the Lambda function financial_report_processor will automatically run to perform GenAI sentiment analysis as explained in section 1.4, “Financial Report Processing”.
3 Trigger the step function
An AWS Step Function performs the core factor mining computation. Open the AWS Step Functions console, and you’ll find a state machine named fm-factor-mining. Select the Edit button to view the detailed workflow.
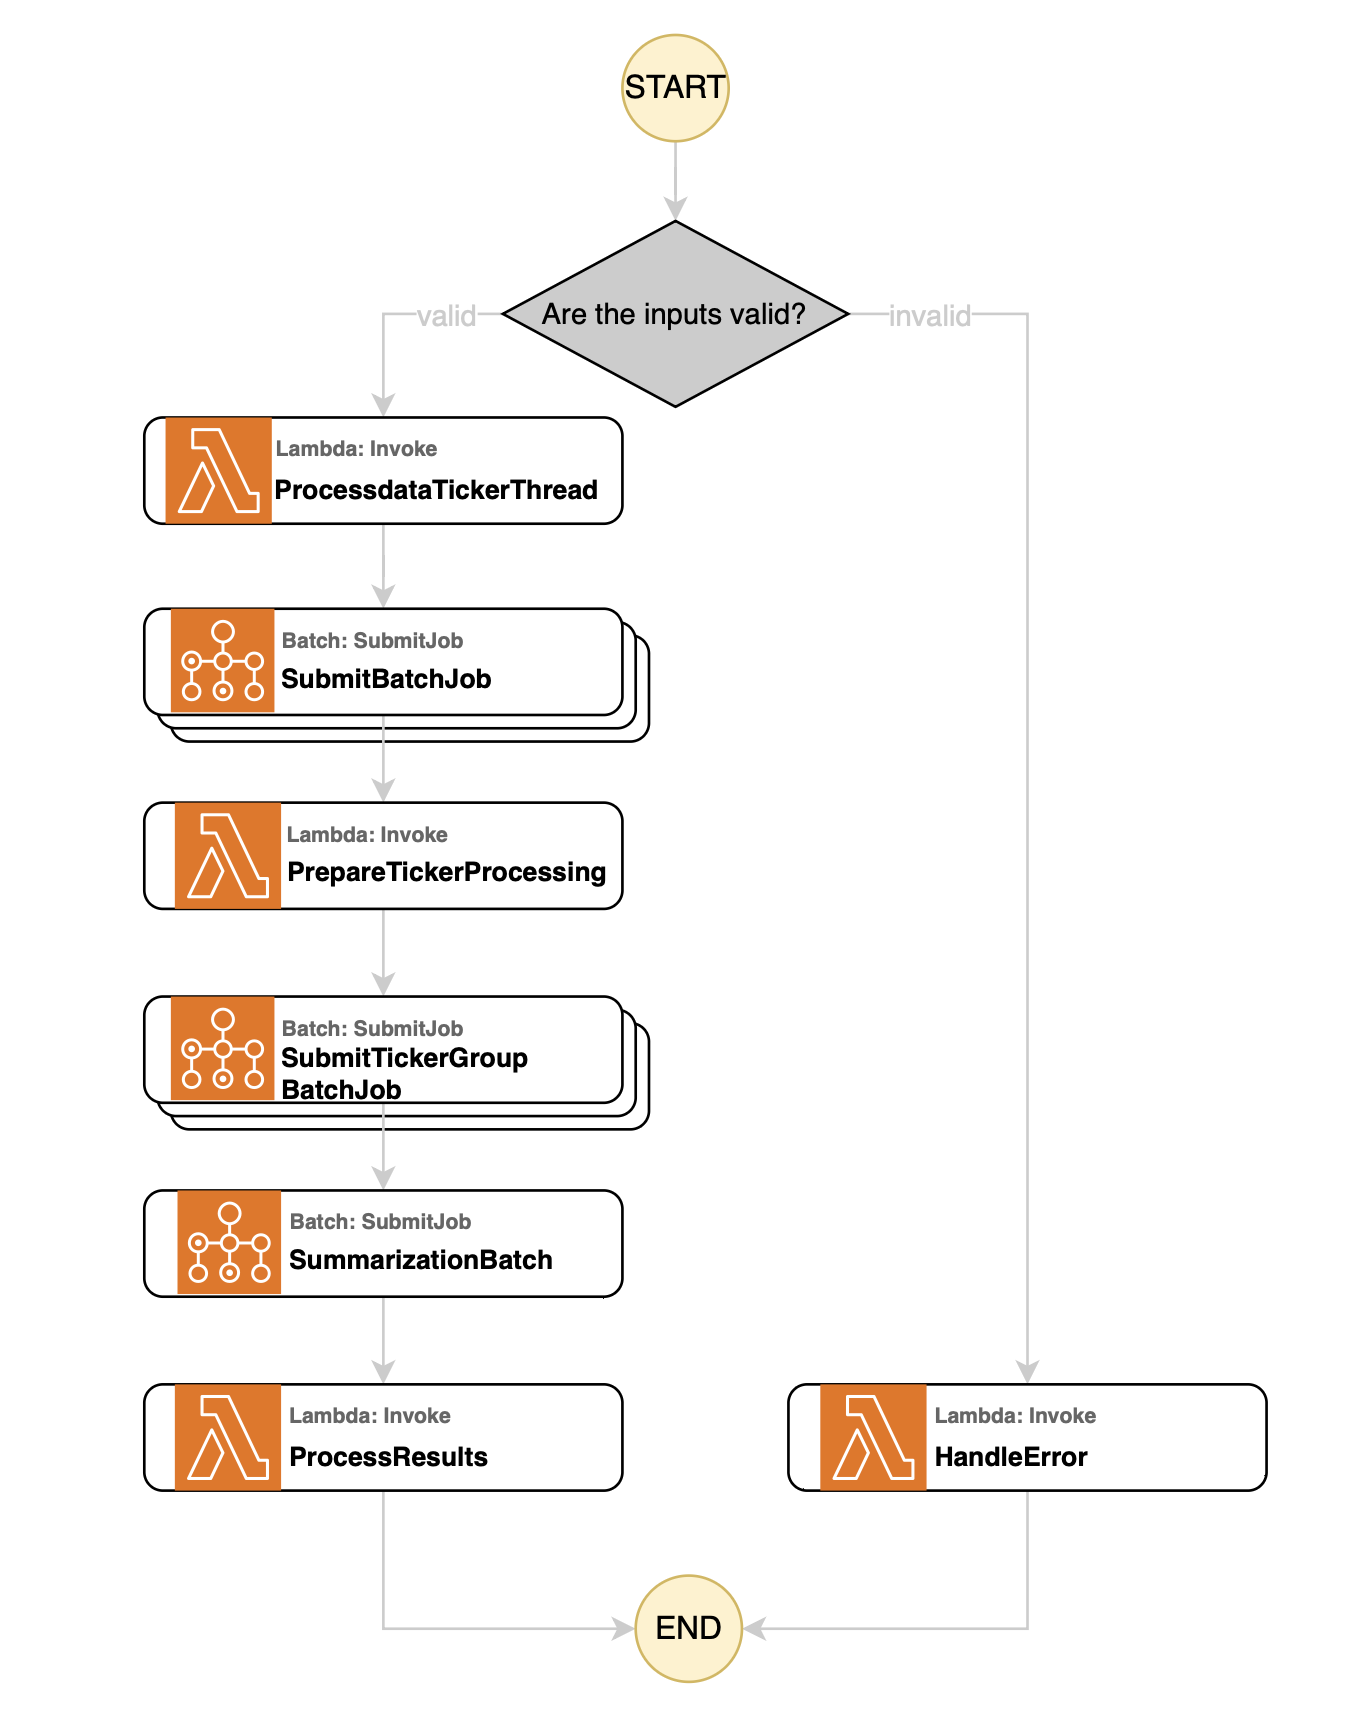 Figure 4 Illustrative diagram of AWS Step Functions workflow for factor mining
This workflow integrates various Lambda functions and Batch Jobs, operating through the following states:
- ProcessDateTickerThread: This state invokes the Lambda function
process_date_ticker_threadto divide the calculation window based on the inputthread_no. For example, if the calculation window is 5 years andthread_no=5, the window will be split into five 1-year segments for parallel processing. - ParallelBatchProcessing: This Map state executes AWS Batch jobs in parallel. These Batch jobs (with
batch_no=1) calculate and construct factors, including retrieving stock data, computing factor values, and storing stock returns and portfolio returns in the ClickHouse database. - PrepareTickerProcessing: This state calls the Lambda function
process_date_ticker_threadagain, but instead of dividing by time periods, it groups all tickers into different batches based on theparallel_mparameter. - TickerBatchProcessing: After grouping the tickers, this Map state invokes AWS Batch jobs in parallel. These Batch jobs (with
batch_no=2) test the factors by retrieving stock returns and portfolio returns from the database, performing factor test analysis, and storing the test results back to the database. - SummarizationBatch: This state triggers Batch jobs (with batch_no=3) to evaluate factor performance. It retrieves portfolio returns and factor test results from the database, conducts portfolio evaluation, and stores the summarized results in the
factor_summarytable. - ProcessResults: The final state invokes the Lambda function
process_batch_resultsto display the final processing results of the Batch jobs.
To run the fm-factor-mining step function, copy the following input data in JSON format, paste it into the input box, and select the Start execution button.
4 Visualization
We generated the following factor mining result after running the same factors for different data range on DJIA 30.
T-stat measures the statistical significance of factors. It’s crucial in factor modeling to determine which factors reliably predict returns. The following chart displays T-statistic distributions for various factor types.
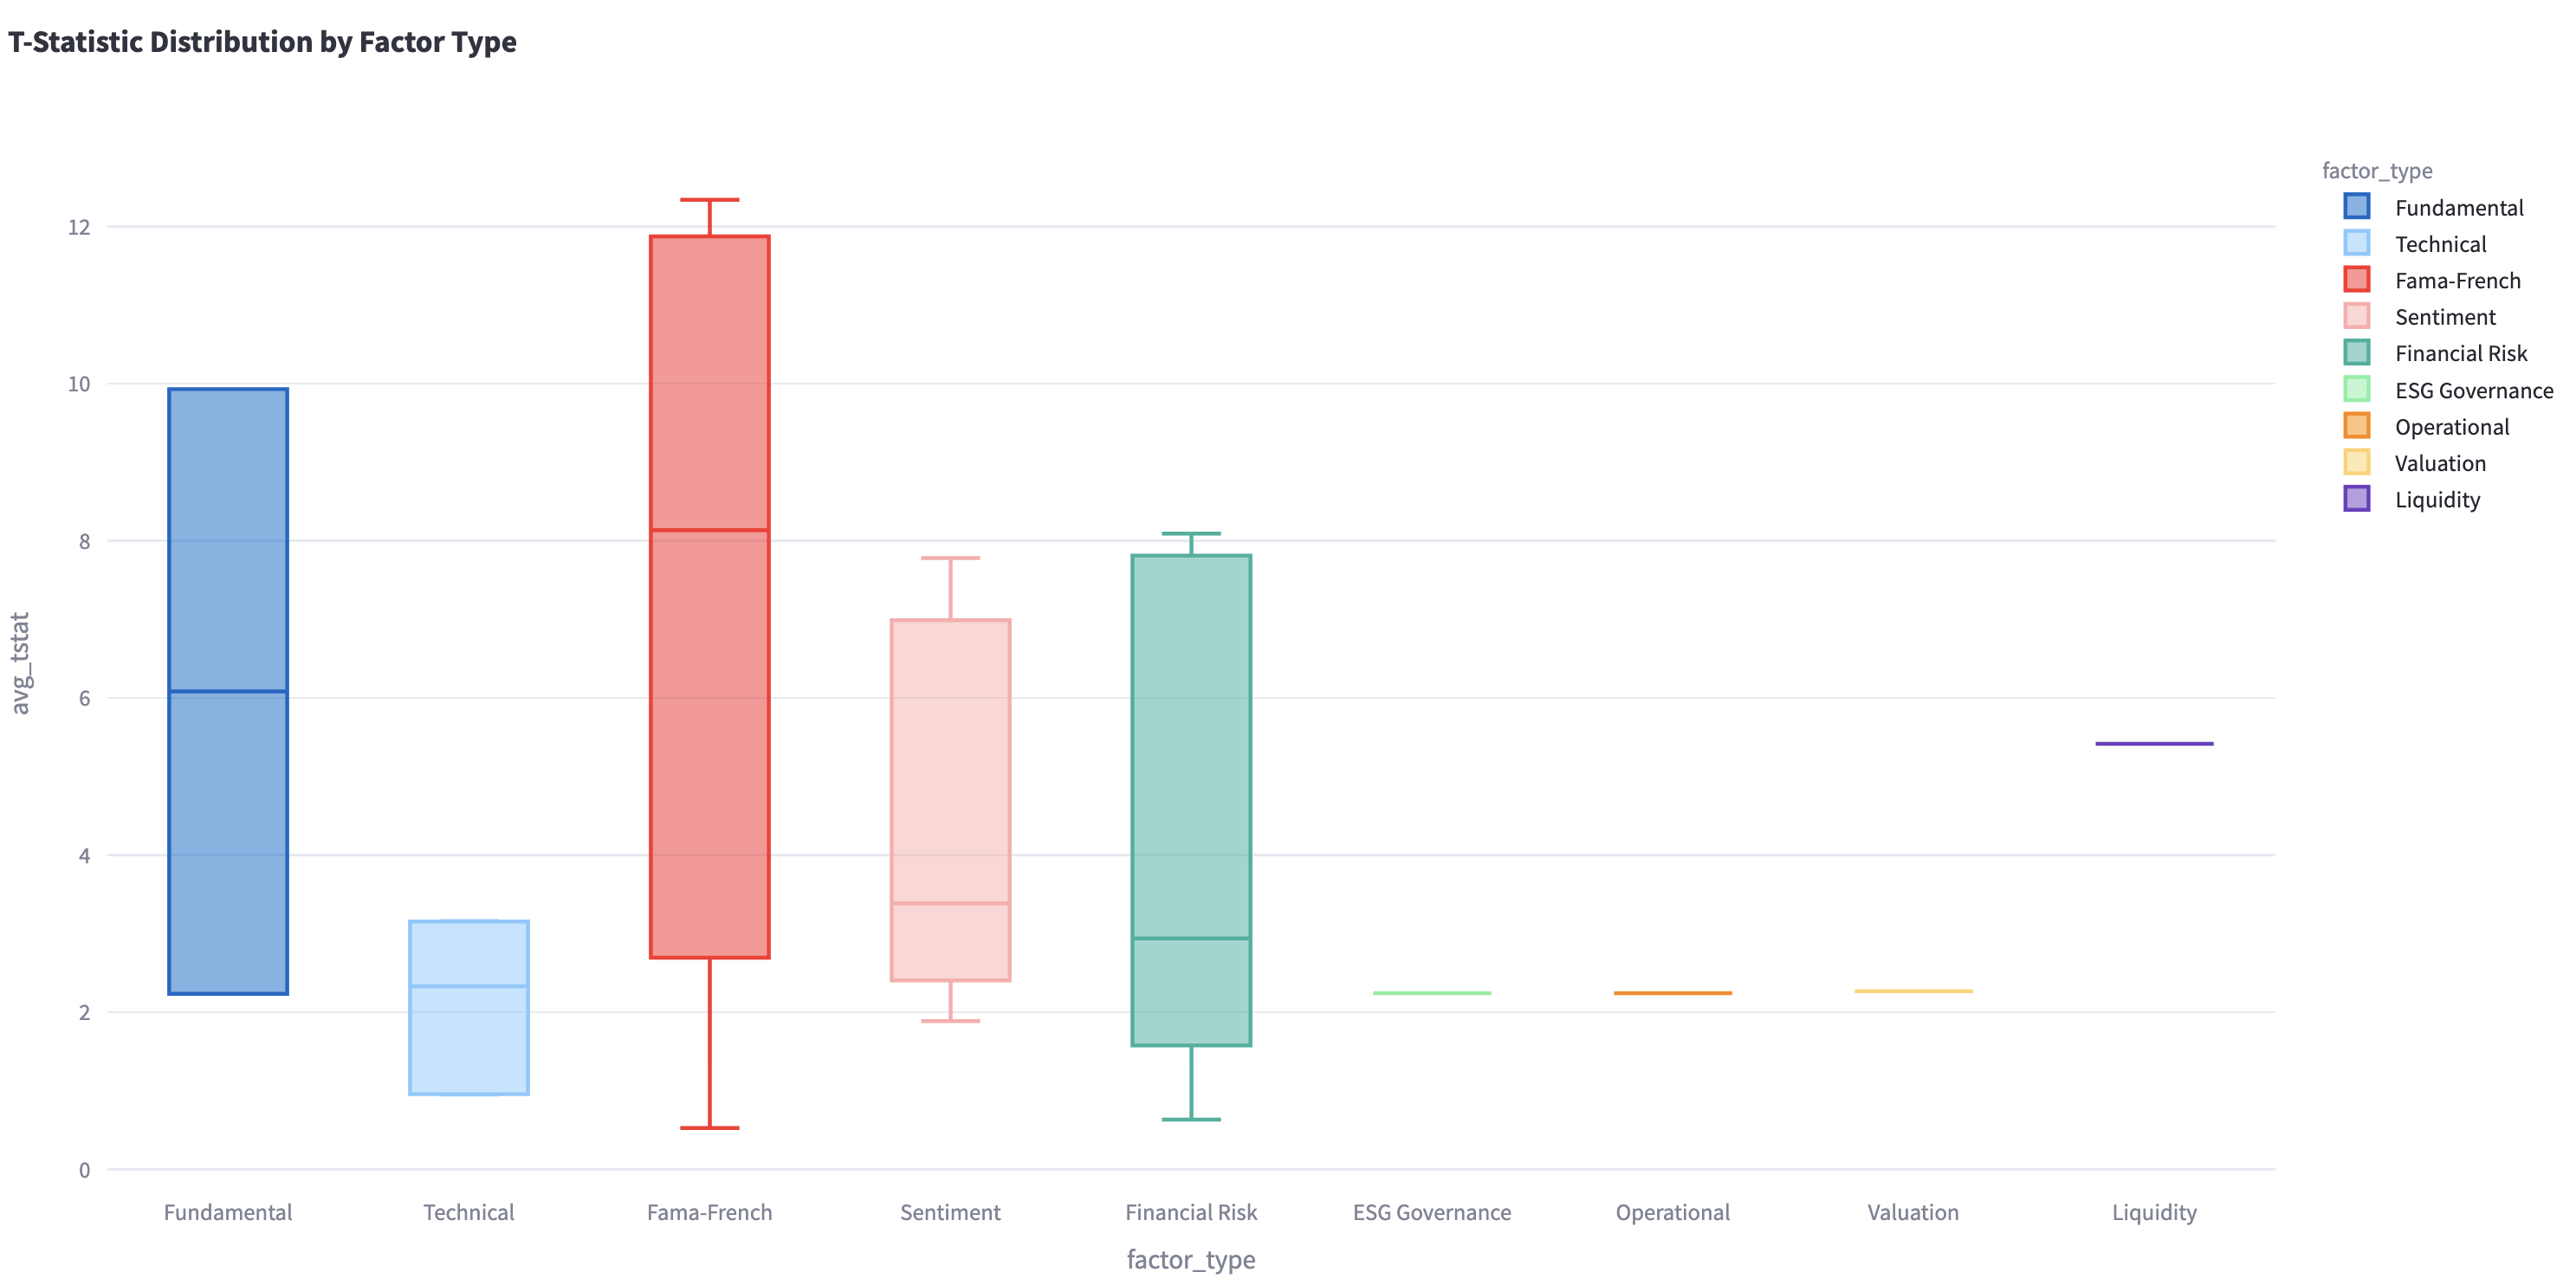
Figure 5 T-statistic distributions for factor types
R-squared measures the proportion of variance in the stock return explained by the factors. The chart shows R-squared distributions for different factor types. You can find the variance in the stock return compared to other factor types.
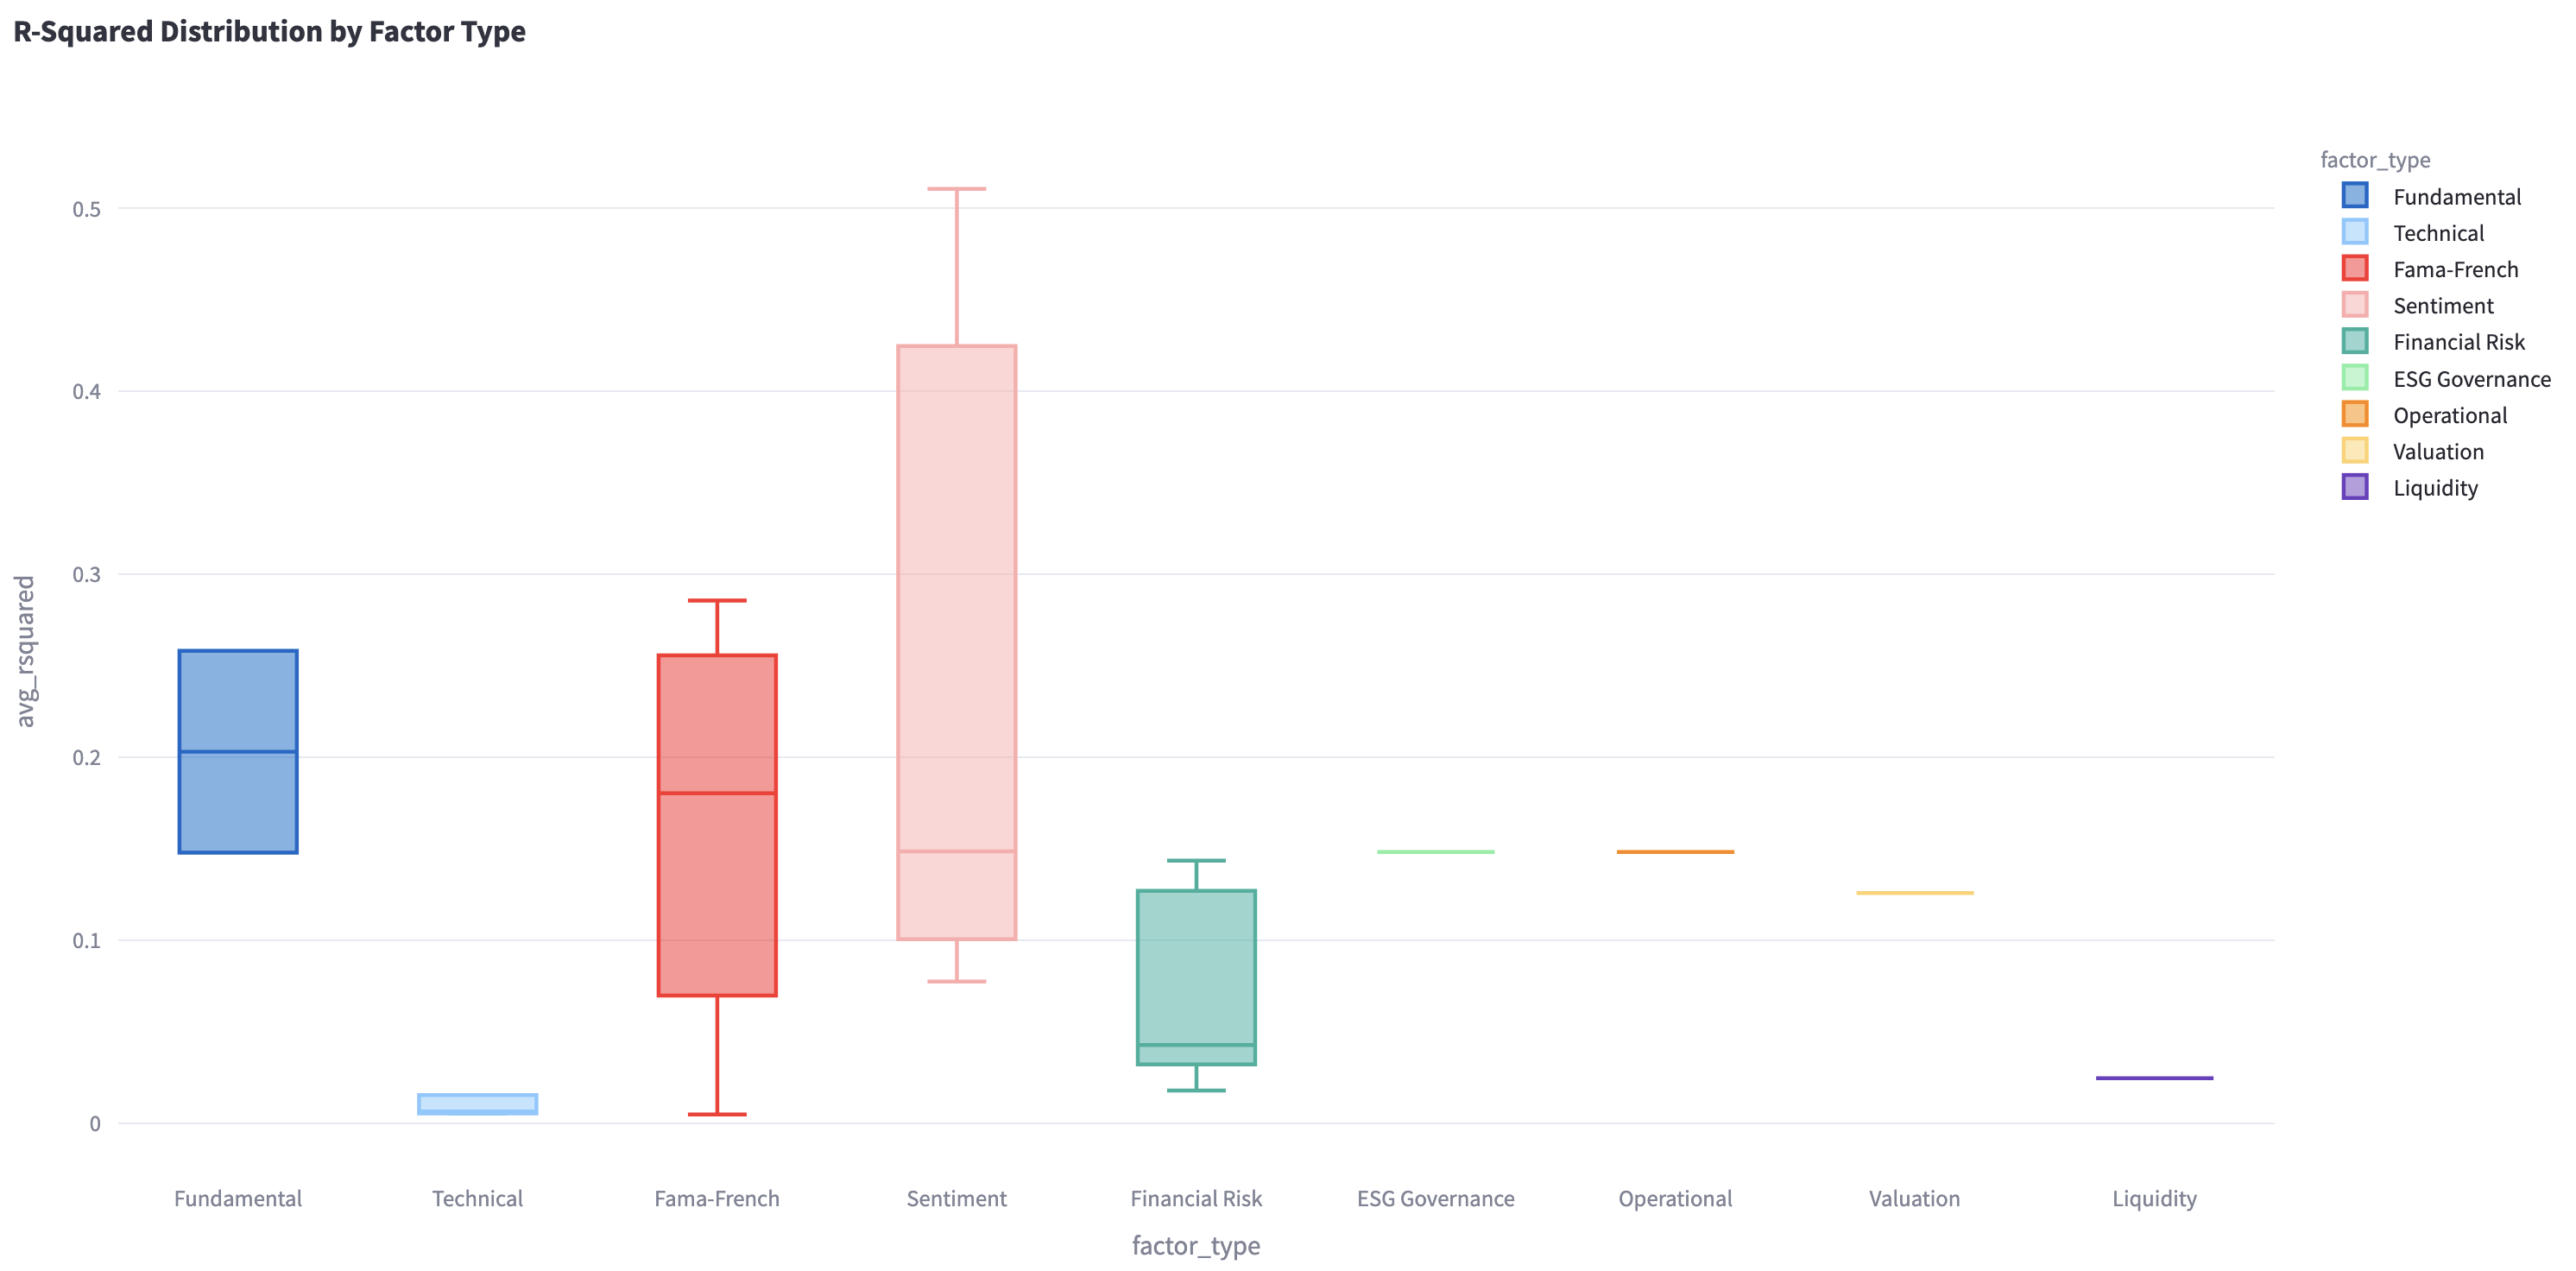
Figure 6 R-squared distributions for factor types
The chart takes Beta into consideration, which measures a stock’s sensitivity to the factor movement. The following chart displays R-squared as bubble size, representing a factor’s explanatory power.
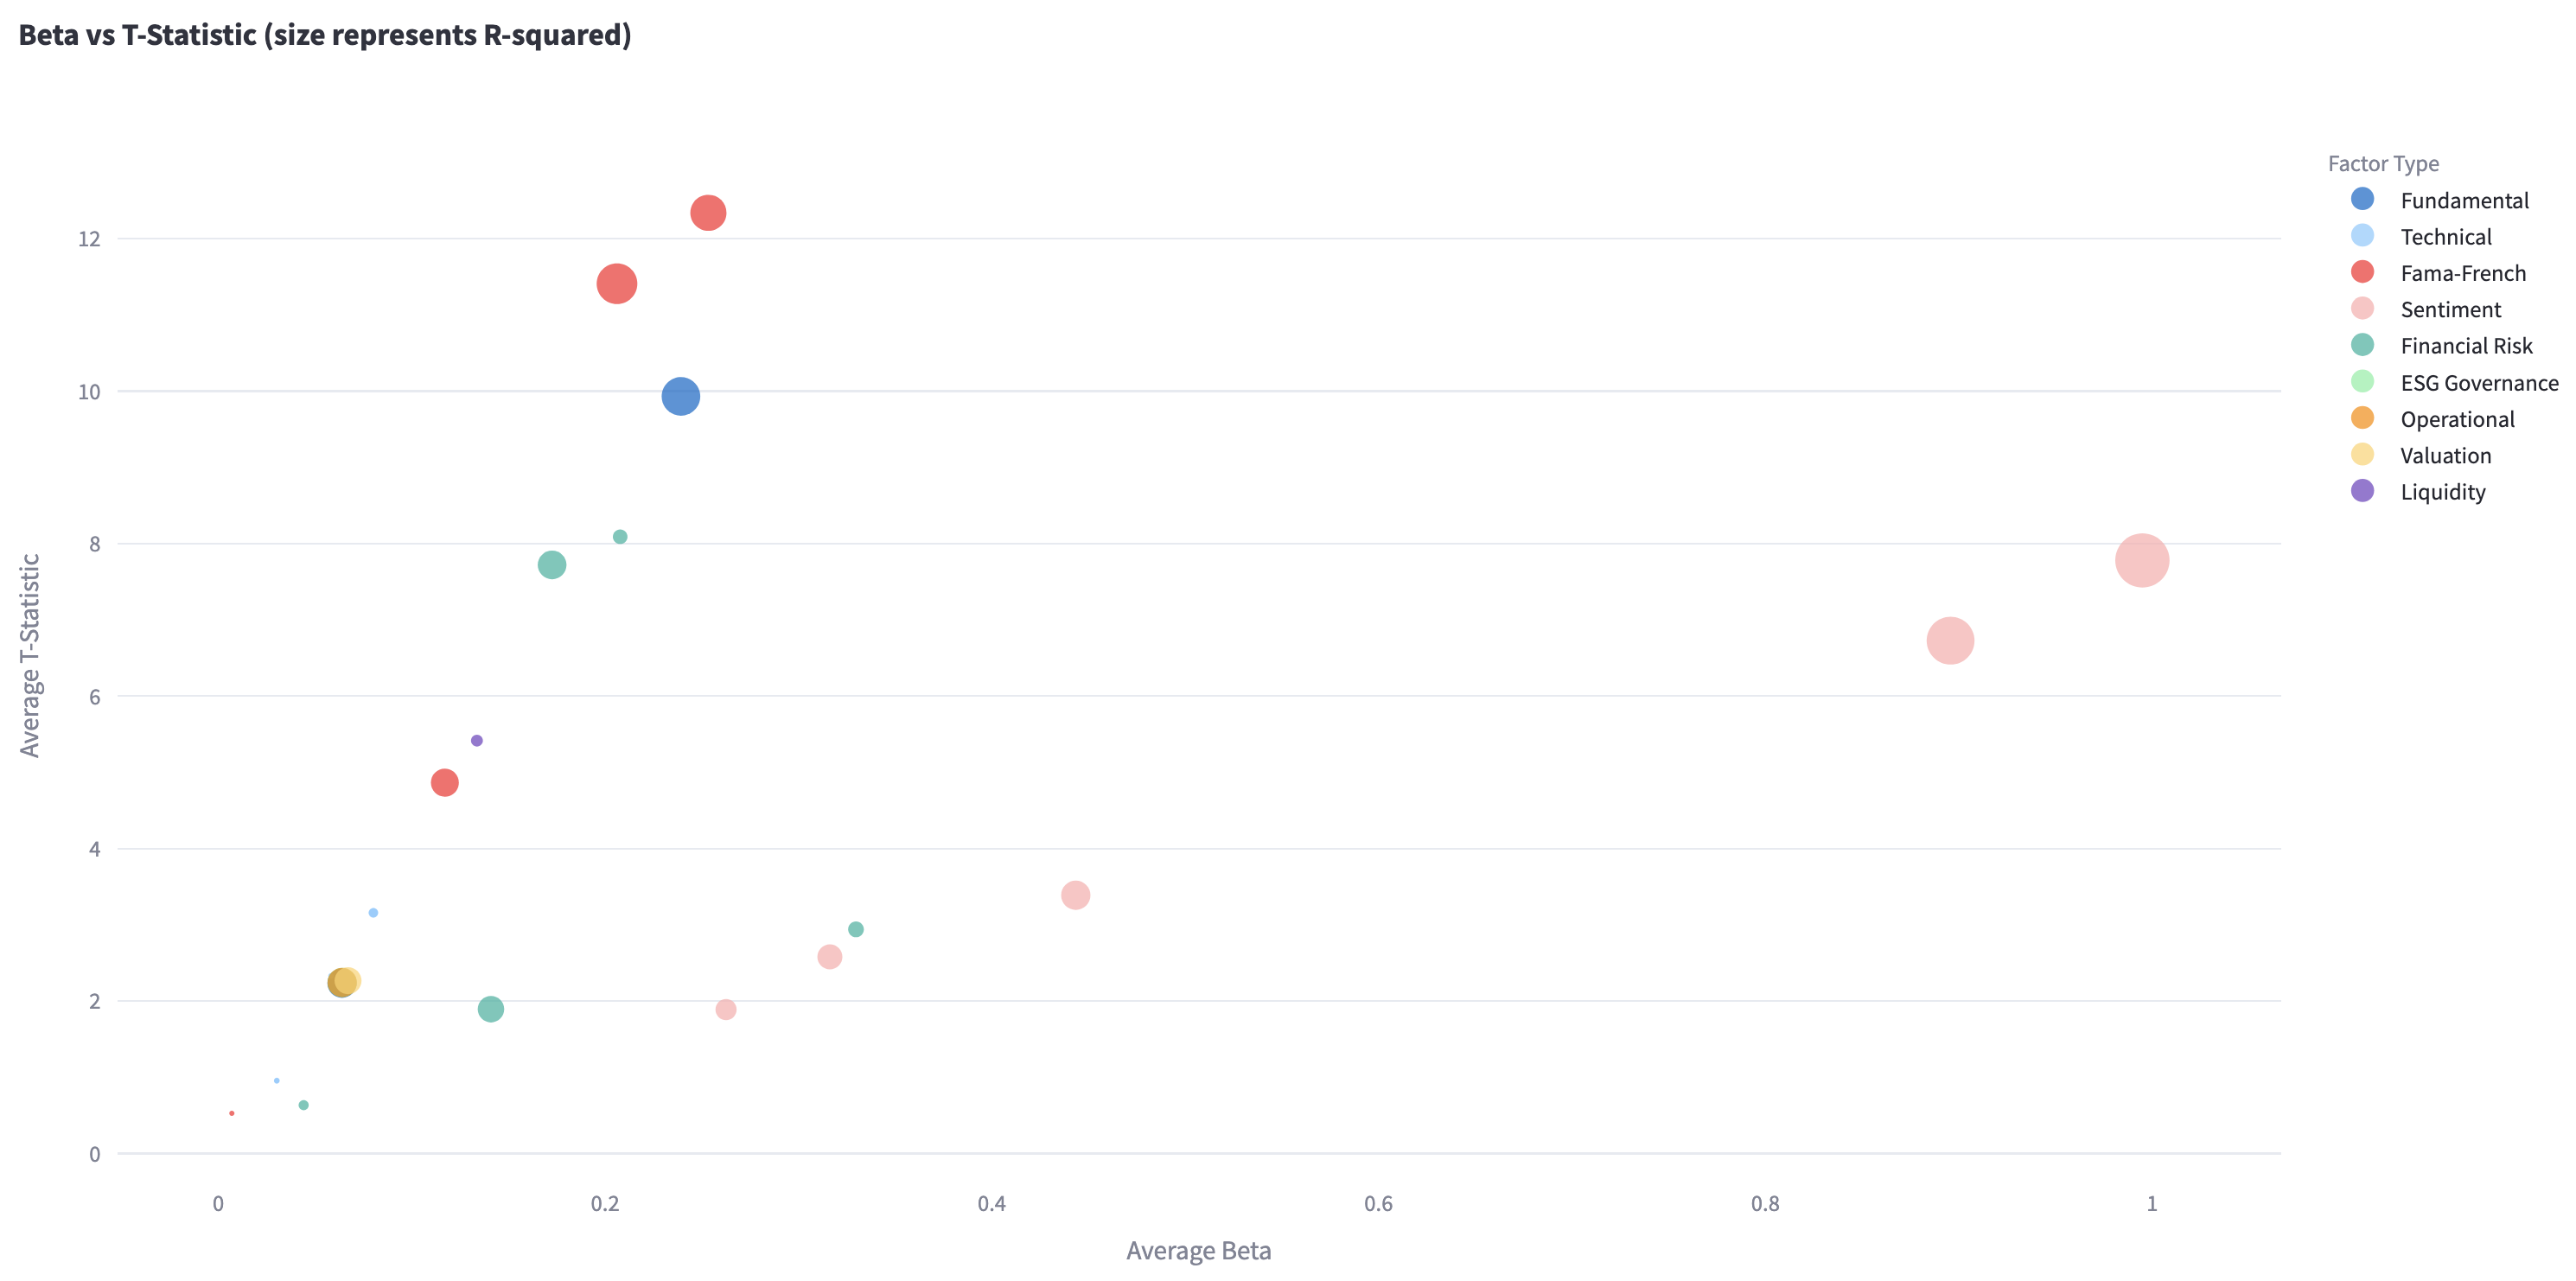 Figure 7 Visualize Beta, T-Statistic, R-squared result
The graph shows that increasing the number of threads for AWS Batch significantly reduces processing time. One example is the market news sentiment factor with LLM, with one thread, the duration is 86 minutes. Using three threads reduces it to 64 minutes, while six threads further reduces it to 48 minutes, showcasing improved efficiency with higher concurrency.
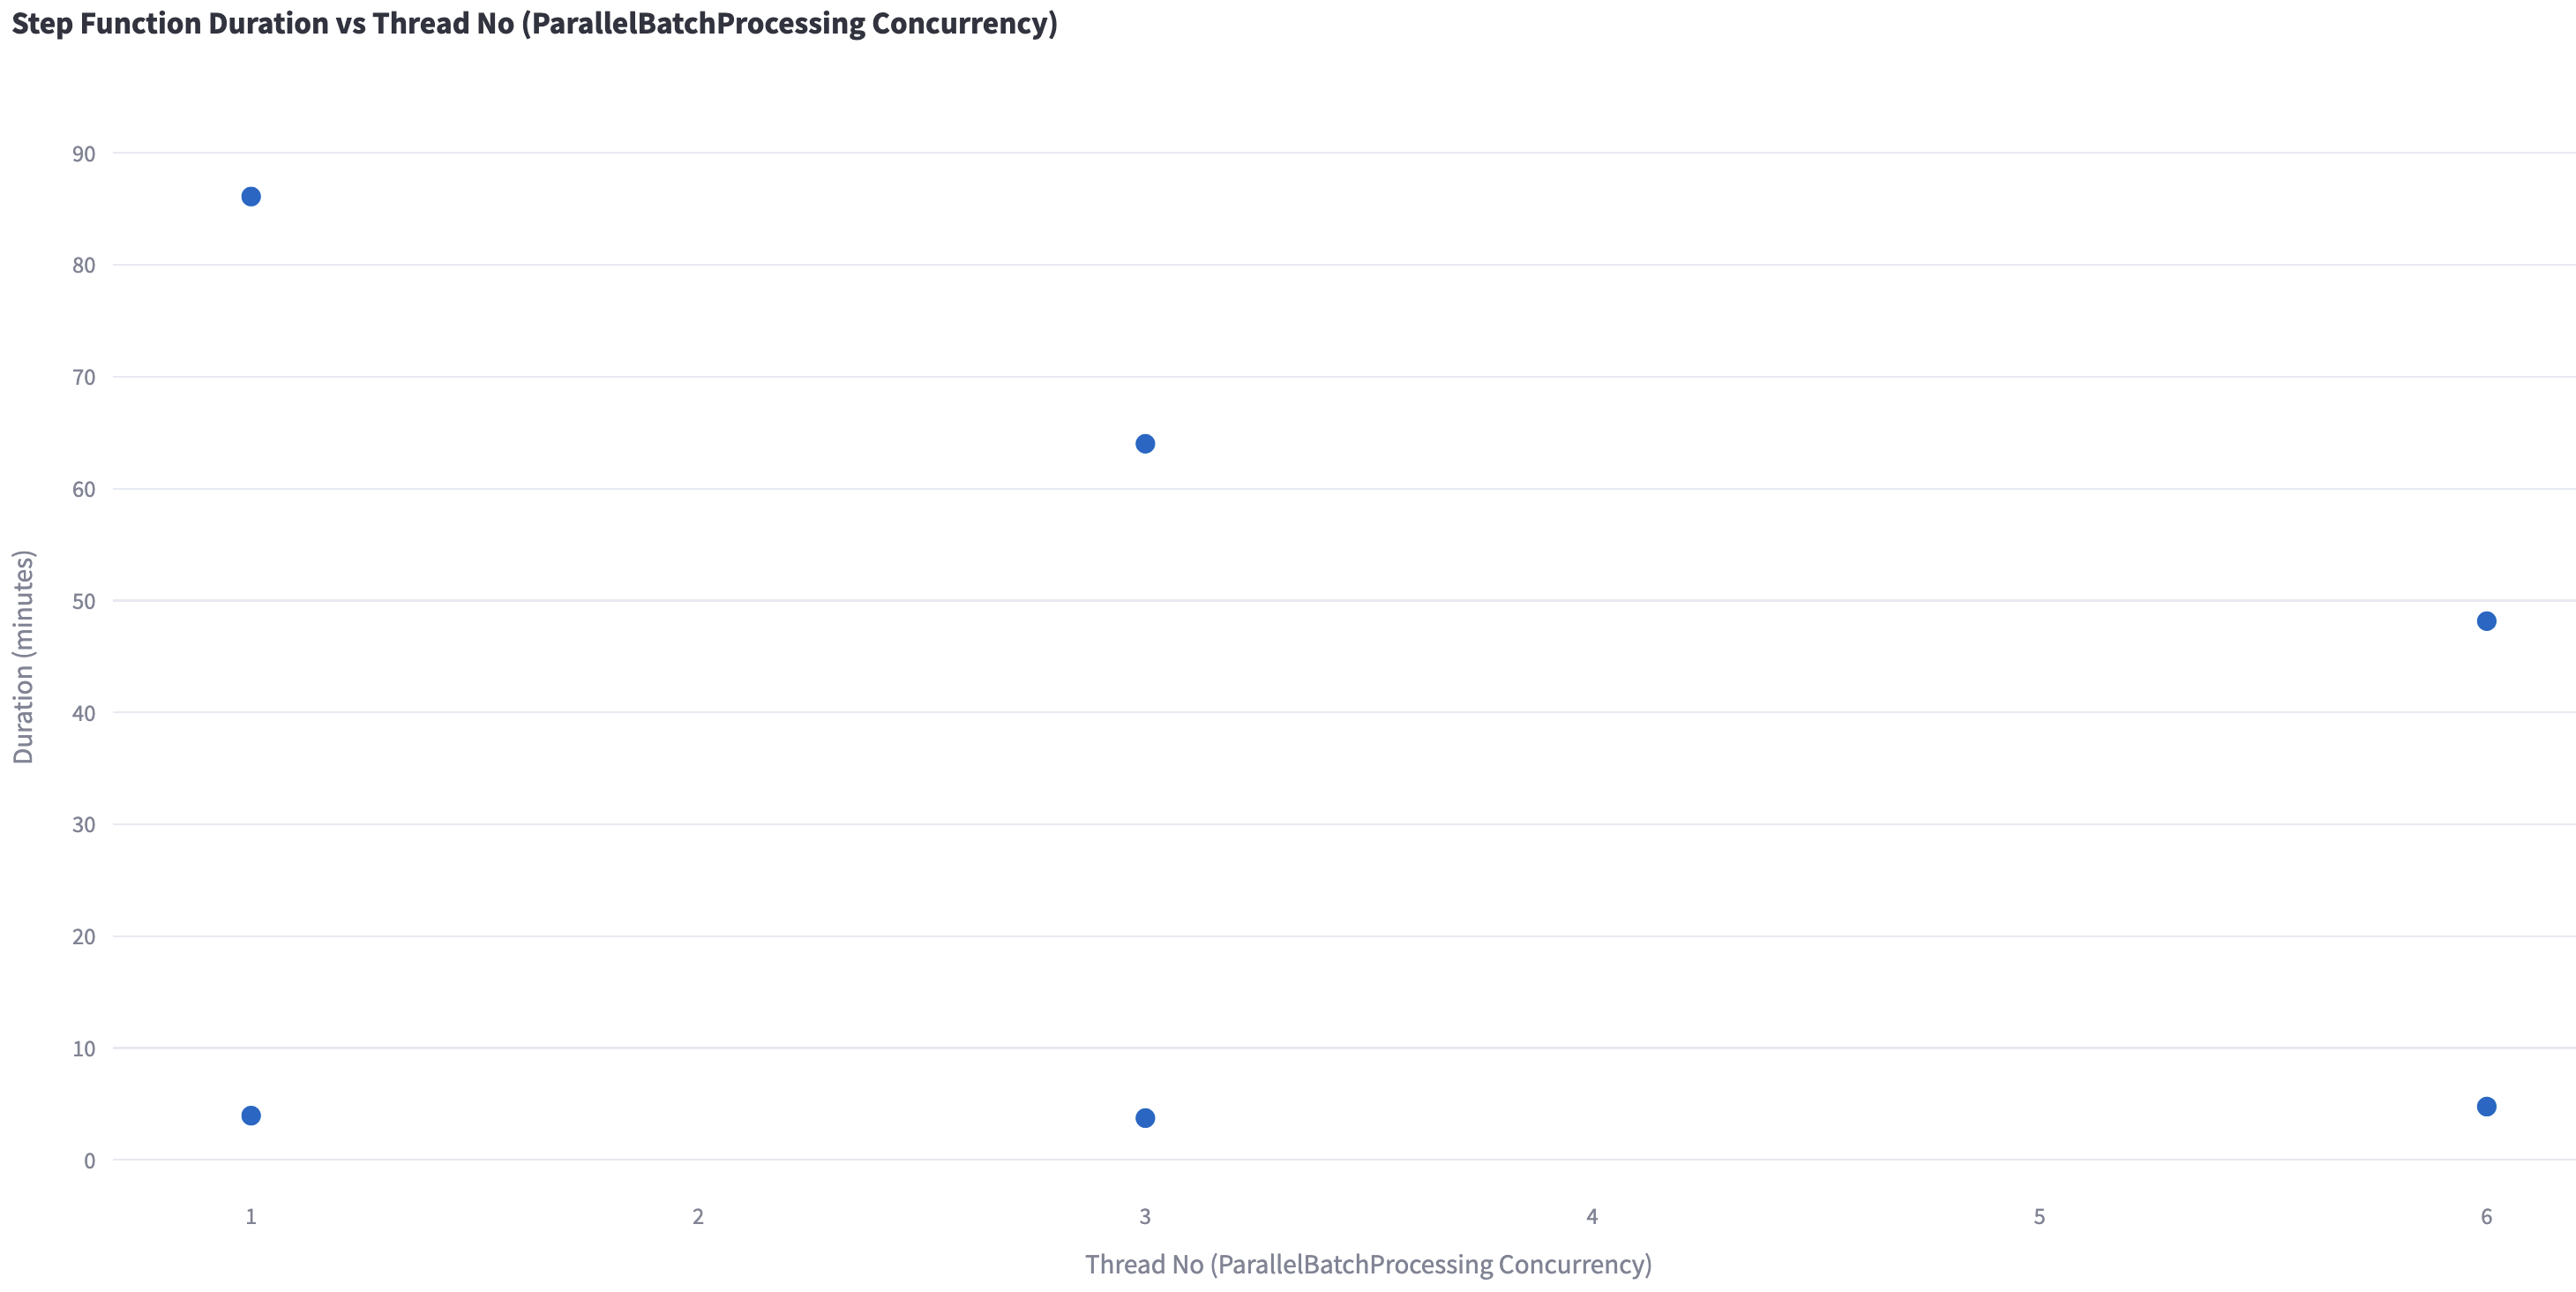 Figure 8 Step Function processing time vs AWS Batch parallelization
Deploying the framework
The project is available on GitHub with Terraform code for automated deployment, simplifying the setup process on individual AWS accounts. By following the provided README and deployment guidance, users quickly implement this factor mining framework for their selected stock pool, such as the DJIA 30 stocks or S&P 500 stocks. This framework leverages AWS scalable infrastructure and advanced GenAI capabilities.
Prerequisites
Before running this code, please ensure you have the following dependencies installed on your system:
- AWS CLI – The Amazon Web Services Command Line Interface v2.27.3+
- Terraform – Infrastructure as Code (IaC) provisioning tool v1.7.5+
- Python – Programming language runtime v3.12+
- Docker – Container platform for building and running applications v28.0.4+
These tools are required for successful deployment and execution of the application.
Deployment guidance
The framework on GitHub mainly consists of docs, src, and terraform folder, where docs stores the README.md images, src folder stores all the Python code, and terraform has following folders:
0-prepare/: Shared resources including Lambda layers1-networking/: Base networking infrastructure (VPC, subnets, etc.)2-clickhouse/: ClickHouse database deployment3-jump-host/: Jump host for accessing ClickHouse in the private subnet4-market-data/: Market data collection infrastructure5-web-search/: Web search data collection infrastructure6-sec-filing/: SEC filing data collection infrastructure7-financial-report/: Financial report processing infrastructure8-factor-mining/: Factor mining processing infrastructure9-visualization/: Visualization infrastructuremodules/: Reusable Terraform modules
Before deployment, update the default values in terraform.tfvars in the following folders:
1. In the file./terraform/0-prepare/terraform.tfvars, update the following variables with unique identifiers. For example, you can use your AWS account ID combined with a timestamp to ensure uniqueness (e.g., “123456789012-20250615”). This prevents resource naming conflicts across AWS accounts:
2. In the file./terraform/5-web-search/terraform.tfvars, update the tavily_api_key variable with your personal Travily API key:
tavily_api_key = "YOUR_OWN_TRAVILY_API_KEY"
3. In the file ./terraform/6-sec-filling/terraform.tfvars, update the email variable with your personal email account:
email = "your.email@example.com"
4. In the file ./terraform/7-financial-report/terraform.tfvars, update the financial_reports_bucket_name with a unique name and bedrock_model_id if you want to process the new sentiments by a specific model:
After updating the default values, you can simply deploy all modules by entering the following command:
cd terraform
./deployAll.sh
Or you can deploy the modules one by one by entering the following commands to install the necessary dependencies, bootstrap the environment, and deploy the application using the terraform code, for example:
# Navigate to the module folder you want to deploy
cd ./terraform/1-networking
# Deploy the module using the terraform code
./deploy.sh
Note: When deploying modules independently, please adhere to the numerical sequence indicated in each module’s folder name:
- Begin with 0-prepare before any other modules
- Deploy 1-networking to establish your AWS network environment
- Deploy 2-clickhouse to build the ClickHouse database for storing all factor data in the AWS network environment
- (optional) Deploy 3-jump-host to create a secure jump host for connecting to your ClickHouse database for troubleshooting
- For data source modules 4-market-data, 5-web-search, 6-sec-filing, and 7-financial-report, deploy them only if you need them based on your requirements.
- Deploy 8-factor-mining to perform factor construction and calculations
- Deploy 9-visualization to display factor mining results through interactive dashboards
Cleaning up
After evaluating the framework and to avoid unnecessary charges, navigate to your deployment folder and run:
terraform destroy
Or run the provided clean up script
cd terraform
./destroyAll.sh
There are more details about cleaning up in the cleanup section in the GitHub deployment guide.
Benefits and conclusion
The cloud-based factor modeling solution we presented offers several benefits for traders and quantitative analysts, including:
- Auto-scaling capabilities provide virtually unlimited storage and compute resources, facilitating a comprehensive factor mining across vast datasets without infrastructure constraints. This enables parallelized back-testing, feature extraction, and model training at speeds and scales impractical with traditional on-premises setups.
- Generative AI on AWS efficiently parses unstructured data, incorporating valuable insights from sources like market news and financial report paraphrases into factor models, potentially uncovering new sources of alpha.
- The provided GitHub sample offers an easy-to-deploy solution, empowering quants to quickly implement this architecture on AWS and start benefiting from advanced factor modeling techniques.
Ready to revolutionize your factor modeling approach? Visit our GitHub repository to access the sample code and deployment instructions. For personalized guidance on implementing this solution for your specific needs, contact your AWS account team. Don’t let traditional infrastructure limitations hold back your quantitative edge – harness the power of cloud-based factor modeling now!