AWS Database Blog
Beyond Correlation: Finding Root-Causes using a network digital twin graph and agentic AI
This post features Kazuo Maeshima, head of automation and visualization for mobile network operations at NTT DOCOMO, and Satoru Imai, manager and technical lead at NTT DOCOMO’s DevOps team for mobile network service monitoring and observability, partnering with AWS to provide real-world validation of AWS solution architecture for the network digital twin as a graph
When your network fails, finding the root cause usually takes hours of investigations, going through correlated alarms that often lead to symptoms rather than the actual problem. Root-cause analysis (RCA) systems are often built on hardcoded rules, static thresholds, and pre-defined patterns that work great until they don’t. Whether you’re troubleshooting network-level outages or service-level degradations, those rigid rule sets can’t adapt to cascading failures and complex interdependencies.
In this post, we show you our AWS solution architecture that features a network digital twin using graphs and Agentic AI. We also share four runbook design patterns for Agentic AI-powered graph-based RCA on AWS. Finally, we show how DOCOMO provides real-world validation from their commercial networks of our first runbook design pattern, showing drastic MTTD improvement with 15s for failure isolation in transport and Radio Access Networks.
The Root Cause Analysis Challenge
RCA in telecom is defined by the 3rd Generation Partnership Project (3GPP) as “the systematic process of identifying a specific fault responsible for multiple errors”, and by the GSM Association (GSMA) as “a structured method to identify and address underlying causes rather than merely treating symptoms”. For decades, RCA in telecommunication has relied mainly on correlating alarms, key-performance indicators (KPIs), logs, and other telemetry, then feeding derived features into machine learning (ML) and deep-learning (DL) pipelines.
Today’s practice still primarily leverages fixed thresholds and correlation-based heuristics to locate faults, often supplemented with Machine Learning and Deep Learning techniques. However, these approaches fall short in modern, highly interconnected and distributed networks, where mean time to identify root causes is often measured in hours, requires multiple domain experts who go through time-consuming processes trying to avoid symptom distractions while reaching true RCA. Wrong RCA identification is one of the causes of costly field-engineering interventions, as teams are assigned to address symptoms rather than the actual underlying issues.
From Correlation to Causation
Through our collaboration with DOCOMO for RCA in Radio Access Networks (RAN) and Transport Networks, as well as with other customers and partners across the globe, we revisited how Root Cause Analysis is addressed by first focusing on capturing true causation rather than mere correlation: Our approach is based on the known statistical principle “correlation does not imply causation”: correlation measures how strongly two variables move together, whereas causation shows that a change in one variable directly produces a change in another.
So, what is a network digital twin-as-a-graph? Think of it as your network’s real-time mirror, a representation that doesn’t just show you what’s happening but predicts what’s coming next. It’s powered by anomaly detection, graph-based forecasting, and generative AI through agentic AI flows that understand your network’s behavior. In a nutshell how it works:
- It ingests network dependencies, live alarms, and key performance indicators from multiple data sources across network segments and layers.
- It transforms them into a topology-aware graph data structure, called Network Knowledge layer.
- Combined with graph analytics algorithms and deep learning on graphs, the agentic AI layer analyzes incoming data and launches one or multiple specialized RCA runbooks based on the network data flows.
In the next section, we deep dive into the three pillars: Network Knowledge, Agents/Agentic AI flows and the RCA Runbooks.
Solution architecture overview: Network Knowledge, Agentic AI and Runbooks design patterns
The network digital twin as a graph solution architecture for RCA has been validated through DOCOMO’s commercial network RAN and Transport and is also in production for a European customer for other use cases such as Change Management and Service Impact Assessment. The runbooks featuring agentic AI on top of the network graphs are design patterns currently being implemented with AWS partners for different customers across the globe, targeting RCA across various network segments including RAN, Transmission, 5GCore, Transport, and Service layers.
Network Knowledge layer
A Network Knowledge layer is a data foundation that consolidates all network-related information into structured, queryable formats to enable analytics, machine learning, deep learning, and agentic layer intelligence for decision-making. It is built upon dedicated data operation pipelines: Standard Operating Procedures and network documentation get converted into searchable formats stored in Amazon S3 Vectors, while network topology data and dependencies inferred from network interfaces are stored in Amazon Neptune‘s graph database. Performance metrics stream into Amazon Timestream, and trouble tickets land in Amazon DynamoDB alongside alarm data. Historical/old about Alarms, KPIs and TT/Changes are stored in Amazon S3.
AWS Glue and AWS Lambda functions work behind the scenes to process and connect all this information. The result is a network knowledge that stays updated in real-time and is the foundation for the Agentic Root Cause Analysis. The following diagram illustrates how the Network Knowledge layer integrates these AWS services to create a unified data foundation for RCA operations.

Figure 1. Network Knowledge Layer
HLD architecture overview and RCA Agentic AI Layer
As described in the previous section, network knowledge is the foundation where Amazon Neptune holds the evolving network topology, augmented with pointers to real-time features derived from alarms, KPIs, incident history, and telemetry streams. Next, RCA workflows are activated based on triggering conditions, which may include alarm burst patterns, KPI anomalies/forecast-drift, or graph-based scores that reflect node importance or fault propagation potential; we cover this in detail in each of the runbooks. When these conditions are met, one or more RCA runbooks are executed to drive the diagnostic and isolation process.
At the core of the solution is the agentic AI layer, composed of modular Strands agents whose lifecycle is managed by the Bedrock AgentCore. Each agent performs specialized tasks such as anomaly correlation, forecast-drift detection, dependency graph construction, or ticket management. These agents are triggered in Swarm workflows or DAGs depending on the RCA Operator’s reasoning over the received data. The following table describes the core agents needed.
| Agents | Tasks definition |
| RCA operator | Inspects each incoming trigger (alarm burst, anomaly flags, forecast drifts), chooses the matching runbook logic (1–4), writes a step-by-step plan naming which agents to wake, passes every agent its run-time settings (hop count, time window, thresholds), logs results on a shared blackboard and replans whenever new data or operator feedback arrives. |
| Known-incident matcher | It analyzes the matching incidents in the knowledge base, searches the IKB for an incoming alarm, anomaly, or forecast sequence or pattern, computes vector similarity, compares to a confidence threshold, and returns (matched case ID, confidence) |
| Dependency graph builder | Determines the subgraph of the alarming nodes. Queries Neptune for the dependency graph around node_IDs and expands up to N hops with Gremlin or SPARQL, iterating until the resulting subgraph is enough for the graph traversal algorithms. |
| Root-cause finder | Plans the logic to invoke the Neptune analytics algorithms and scores network nodes. Runs Neptune Analytics decompose, cluster, and rank algorithms on the subgraph ID, chooses the analytics mix based on graph size or density and returns the top K (default 10) ⟨node_ID, score⟩ pairs. |
| Anomaly correlator | Calls the Amazon SageMaker anomaly-detection endpoint with node_IDs and KPI series over a look-back window (for example, 15 minutes), flags samples where anomaly_score is greater than the threshold and defines the statistical strategy to merge them with live alarms. |
| Forecast-drift monitor | Query the ST-GNN forecast endpoint for each KPI over a horizon H and compute the residual r = |actual – forecast|. Then it flags a deviation when r > σ × band_factor, where:– σ is the forecast’s standard deviation for that KPI and timestamp,– band_factor is a user-defined multiplier (such as 1.96 for a 95 % band).Finally, it merges flagged deviations with the concurrent alarm stream. |
| Recent-events collector | For each suspect node, it pulls the last T minutes of alarms or KPIs, adaptively widens or narrows T until a target event density is met or T_max is reached, and outputs a time-ordered event list. |
| MoP analyzer | Detects device type, vendor, or SW version, queries a vector index with the problem context, and extracts the most relevant troubleshooting commands or narratives. |
| Incident-report builder | Combines ranked nodes, timelines, and MoP excerpts; drafts a structured incident record and, using an impact heuristic, decides ticket or RCA-report. If ticketed, calls the ticket API, records the ticket ID, and alerts #noc-urgent |
| Ticket manager | When the record’s status flag is “ticket”, it creates or updates the ticket, posts a notice to channel name, offers chat on current and past tickets, and stores the link on the blackboard. |
| Operator feedback recorder | Records Network Operation Center (NOC) feedback and writes the case ID, decision, and operator note back into the IKB for continuous learning. |
| Guardrails policy advisor | Enforces guardrails such as no personally identifiable information (PII), only approved firmware, commands within the change-window, checks SLA timers (such as escalate in 10 minutes if greater than 50 users, or mean time to repair (MTTR) is less than or equal to 30 minutes), and blocks Procedure-Finder actions that violate those guardrails; on breaches, marks the incident noncompliant, upgrades the ticket to P1-URGENT and alerts the NoC teams. |
| OpsMemory | Shared memory blackboard holds the intermediate outputs from each agent raw-data pointers, subgraph JSON, ranked nodes, anomaly flags, MoP snippets, ticket IDs so agents can read them; versions entries, and clears records when the incident closes. |
| Other agents | Other agents from partners or by customers might be added to enrich the flow per network segment, such as a RAN (Radio Access Network) Expert Agent or an IMS (IP Multimedia Subsystem) session Agent, and more. |
The following diagram shows the HLD architecture for the agentic AI for RCA across the four runbooks.

Figure 2. Solution overview
Runbook 1 Baseline: Graph Analytics to Agentic AI
Alarms are ingested as a live stream, on demand when an incident is occurring or on a schedule. When alarms fire, they trigger a specialized AWS Lambda function built for root cause analysis. The function extracts the affected node IDs from the incoming alarm data. It then pulls the relevant network subgraphs from Amazon Neptune. These subgraphs include all the dependency connections between network nodes. Amazon Neptune Analytics algorithms break down the subgraph structures and group related nodes together: We defined a specific and configurable cascade of these Neptune Analytics algorithms for RCA over a graph structure. For instance, this cascade can involve 1) decomposing the graph with WCC (Weakly-Connected-Components) or SCC (Strongly-Connected-Components), 2) clustering the graph with label propagation, and 3) running centrality computation to rank the network nodes. This approach will be detailed in a follow-up blog with code samples. These algorithms rank each node based on its structural importance within the network subgraphs containing alarming nodes.
Following this ranking, the agents analyse recent alarm sequences for each candidate node, starting with the last few minutes (such as two to five minutes) and expanding the time window when alarms are sparse. They consult the relevant method-of-procedure (MoP) documents and extract further details on the alarms as well as the troubleshooting commands that apply to each failing node.
- Using these elements, the agents create a record consisting of failing nodes, alarm pattern, neighboring nodes, incident description, and recommended actions.
- They create or update a trouble ticket and populate it with the record, the full alarm timeline, and the extracted MoP excerpts. If no ticket is opened, the entry is displayed as an RCA report for NOC teams’ review.
- The NOC teams can validate or reject the output, and their feedback is captured through the Agents memory and recorded in the Incident database.
In this runbook, alarms remain the fundamental trigger, while graph analytics, a deterministic approach, localizes the fault domain, and agentic AI turns the raw scores into an actionable incident record with a continuous feedback loop.The following diagram shows the solution architecture.

Figure 3. Runbook 1 Baseline: Graph Analytics to Agentic AI
Runbook 2: Known Alarm Patterns Matching with Agentic Graph Fallback
Alarms arrive as in Runbook_1 continuously, on-demand, or on a schedule. Individual alarms don’t directly invoke the RCA Lambda function. Instead, a trigger mechanism based on alarm features detects spikes or unusual patterns in the incoming stream. This includes monitoring alarm volume, z-score deviations from baseline, alarm severity clustering, and cascading failure patterns (like when a base station fails and triggers connectivity alarms across all affected mobile devices). When this trigger fires, it invokes the RCA-specific Lambda function, and the agentic AI workflow begins. It then performs the following steps:
- The first hop is the Incident Knowledge Base. If the incoming pattern or sequence matches a stored incident with high confidence, the agents update or open the ticket, apply the prescribed remedy, and end the flow.
- When no match exists, the agents invoke a graph-driven deep dive:
- They extract the alarming node_IDs, expand to their dependency neighbors (up to N hops), and build the failure subgraph like what was done in Runbook_1.
- They invoke Neptune Analytics for the decompose, cluster, and rank algorithms, collect the resulting scores, and pick the ten highest-ranked nodes for detailed analysis.
- For each node, the agents pull the recent alarm timeline (such as two- or five-minute window, which can be extended due to data sparsity), consult the relevant MoPs, and compile a structured record consisting of failing nodes, alarm pattern, neighboring nodes, incident description, and recommended actions.
- They open a new ticket or enrich an existing one with the record, links to similar past cases, and the extracted MoP snippets.
- They agents capture the NOC feedback through their memory as well as record it in the Incident Knowledge Base.
The following diagram is an example of the Runbook_2 solution architecture.
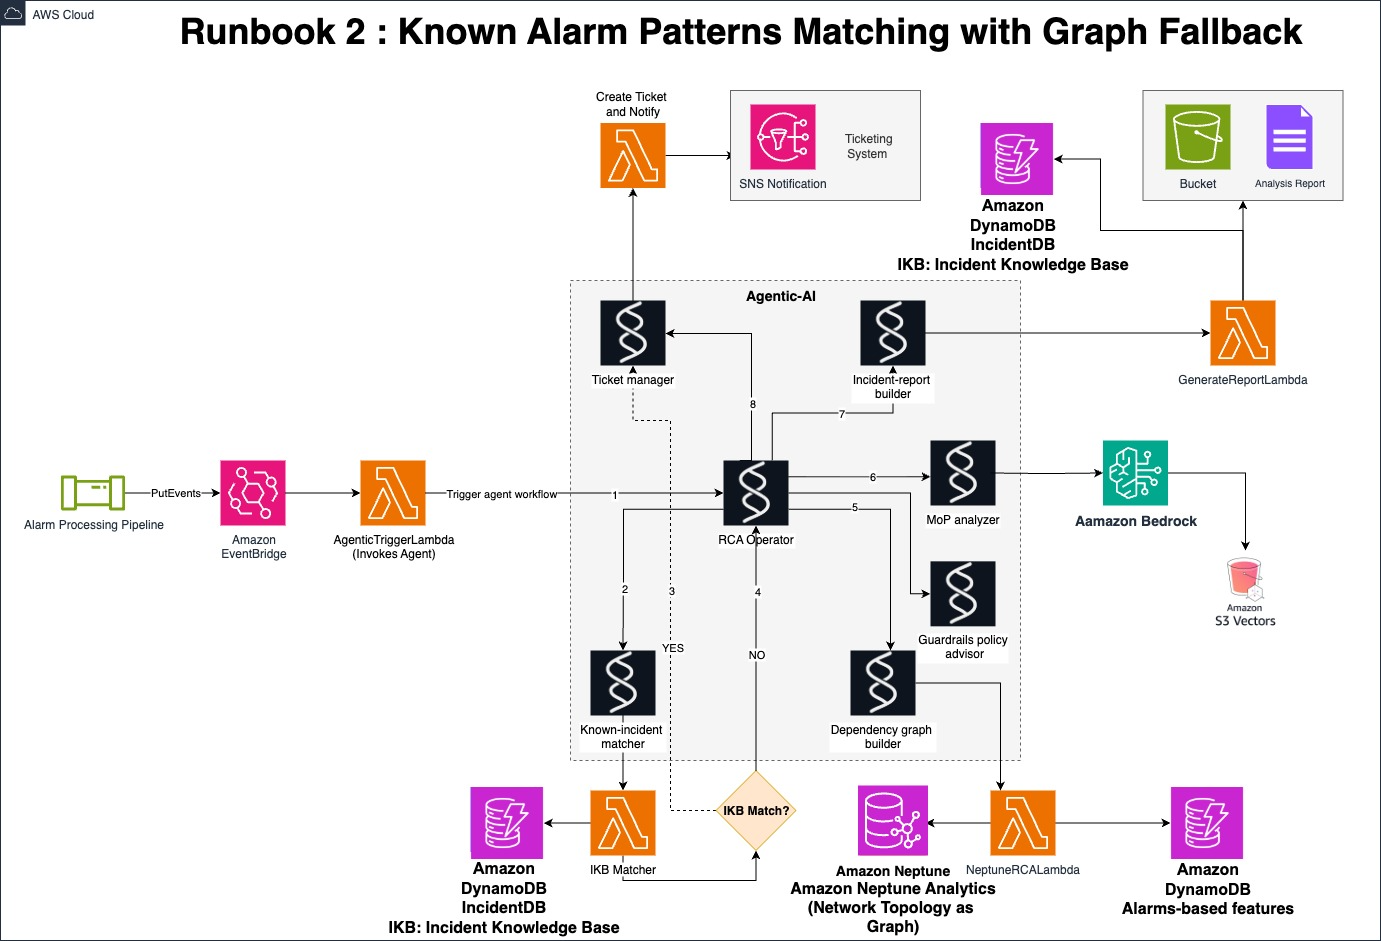
Figure 4. Runbook 2: Known Alarm Patterns matching with Agentic Graph Fallback
Runbook 3 Multi-Signal Anomaly Fusion RCA (Weak-Signal Detection)
Alarms remain the primary signal but get enriched in real-time with KPI-based anomaly scores. The Agentic AI workflow triggers on a combination of alarming nodes and nodes showing anomalies. As in Runbook 2, this includes alarm features like volume spikes, severity clustering, and z-score deviations, with the addition of KPI anomaly scores. This combined approach helps the NOC catch weak faults before they escalate into full alarm patterns.The workflow performs the following steps:
- The agents query the Incident Knowledge Base exactly as in Runbook 2. If the alarm sequences match a known pattern, they update the ticket and end the flow.
- When no match is found, the agents continue:
- They combine alarm features (volume spikes, severity clustering, z-score deviations) with anomalies based on network KPIs
- They expand to dependency neighbours across multiple hops and assemble a propagation subgraph
- They select the appropriate algorithm mix and run Neptune Analytics to decompose, cluster, and rank algorithms
- They score every candidate root cause and move the highest-ranked nodes forward
- For each selected node, the agents pull both alarm and anomaly timelines starting with a short window (such as two or five minutes) and extending as needed. They mine the relevant MoPs and synthesize an entry containing failing nodes, alarm patterns, anomalies, neighbouring nodes, incident description, and recommended actions in the Incident Knowledge Base.
- The agents generate an RCA report for NOC teams’ review.
- The NOC teams can accept or reject the analysis, and the feedback is captured in the Agents memory.
The following diagram is an example of Runbook 3 solution architecture.

Figure 5. Runbook 3 Multi-Signal Anomaly Fusion RCA (Weak-Signal Detection)
Runbook 4 Forecast-Drift Fusion RCA (Proactive Detection)
Alarms remain the foundational signal but get paired with KPI forecast-deviation flags from a rolling Attention-based Spatio-Temporal Graph Neural Network (AST-GNN). This model learns joint topology and temporal patterns for every network node, producing forecasts with confidence bands for each KPI. When live KPIs drift outside their predicted bands, the system raises deviation flags even when absolute values appear normal. It is of course possible to choose other deep learning models for forecasting with adequate feature engineering. The Agentic AI workflow triggers on a combination of alarm features and forecast-deviant nodes. As in previous runbooks, this includes alarm features like volume spikes, severity clustering, and z-score deviations, with the addition of KPI forecast deviations. This predictive approach helps the NOC catch potential issues before they manifest as clear problems.The workflow proceeds as follows:
- The agents query the Incident Knowledge Base exactly as in previous runbooks. If they find a high-confidence match to an existing incident, they update the ticket and end the flow.
- When no match exists, the agents continue with expanded analysis:
- They merge alarm features (volume spikes, severity clustering, z-score deviations) with forecast-deviant nodes
- They expand to dependency neighbors across multiple hops and assemble a propagation subgraph
- They run Neptune Analytics to decompose, cluster, and rank algorithms
- They score every node by fault likelihood and keep the ten highest-ranked nodes
For each selected node, the agents pull recent alarm bursts and KPI residual curves starting with a short window (such as two minutes or five minutes) and extending if data is sparse. They mine relevant MoPs and assemble an incident record containing failing nodes, alarm patterns, forecast deviations, neighboring nodes, incident description, and recommended actions.
The agents create or update the trouble ticket and route an RCA report to the NOC for review.
NOC teams confirm the outcome as root cause, false positive, or new alarm sequence. This feedback gets written back to the IKB so future recurrences can take the fast path as well as recorded in the agent memory. The following diagram shows an example of the solution architecture for Runbook_4.

Figure 6. Runbook 4 Forecast-Drift Fusion RCA (Proactive Detection)
NTT DOCOMO’s Network Digital Twin as a Graph
NTT DOCOMO, Inc., runs a mobile network that reaches more than 89 million subscribers across Japan. The network has become part of the country’s critical infrastructure, carrying payments, logistics data, and other time-sensitive traffic, so disruptions must be resolved quickly. Yet the growing number of devices and protocols has made fault isolation more complicated and slower.
DOCOMO operations teams must detect an incident, identify the faulty element, and restore service within 1 hour. If they miss that window, DOCOMO will lose customer trust.
DOCOMO selected the transport and 4G/5G RANs to start the transformation of the RCA processes. The data ingested to (AWS) includes network performance every 5 minutes, with event-based alarms covering the full path from the transport network to the radio base stations.
At the transport edge router, it logs byte and packet counters for received and transmitted traffic, broken out by total, unicast, multicast, and broadcast packets, with both cumulative and periodic values, plus a count of critical alarms. Mid-path aggregation routers add packet-level statistics totals, averages, discards, and errors along with their own critical-alarm count. At each evolved Node B (eNodeB, 4G/LTE base station) or next-generation Node B (gNB, 5G base station), the feed switches to radio-aware indicators: Ethernet receive and transmit rates and discard rates, counts of Radio Resource Control (RRC) connection requests, completions, and retries, and another critical-alarm counter.
Excerpt of what was modelled in Amazon Neptune to conduct the DOCOMO RCA:
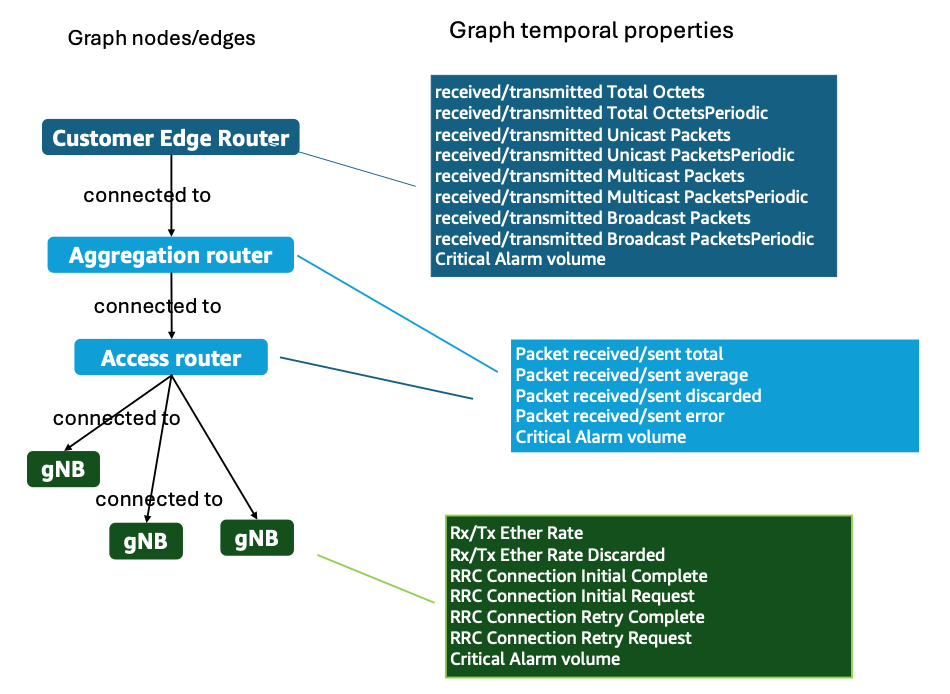
Figure 7. DOCOMO excerpt of Network model as a graph
DOCOMO network digital twin as a graph offers the following benefits to NOC teams:
- The exploration of the network topology transformed into a graph maintained as a data pipeline
- A real-time view of the network showing the temporal evolution of the KPIs and alarms, that is a temporal knowledge graph
- A graph analytics-based calculation of the root cause
The DOCOMO MVP aligns with Runbook 1. It’s now being extended so that the agentic AI moves beyond its static agents and incorporates anomaly-detection capabilities, bringing it closer to Runbook 3.
The following screenshot shows the current UI for the Network Digital Twin as a Graph for DOCOMO:
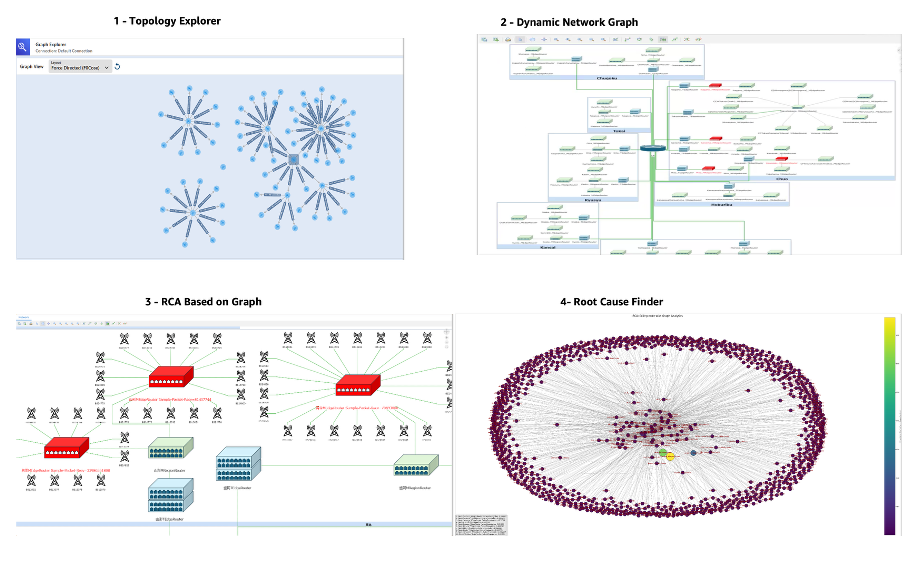
Figure 8. DOCOMO dashboards for Network Digital twin as a graph
- Performance-management (PM) and fault-management (FM) files arrive every five minutes from the transport network and the RAN and are dropped into an Amazon S3 landing bucket.
- An AWS Lambda triggers a Glue Job,
- Glue job parses the parses the raw files and converts them into the format required by the Amazon Neptune bulk loader. The converted files are written to an S3 staging bucket,
- Another AWS Lambda calls the Neptune bulk-load API and imports the new graph data automatically, without manual intervention.
DOCOMO starts with an on-demand usage: When the number of critical alarms volume hits an abnormal pattern, the RCA pipeline loads those alarms into the digital twin and launches the graph analytics; a Lambda function constructs the subgraph of alarming nodes, runs graph analytics, and stores both the RCA scores and the subgraph in Amazon S3. The same function invokes Amazon Bedrock agents to generate the RCA report, summarizes the alarm description, and notifies the Network Operations Centre (NOC), after which operators can review the faulty devices in Tom Sawyer Perspectives, where the affected node is highlighted in red within the network topology view.
The following diagram shows NTT DOCOMO’s MVP Targeted architecture.
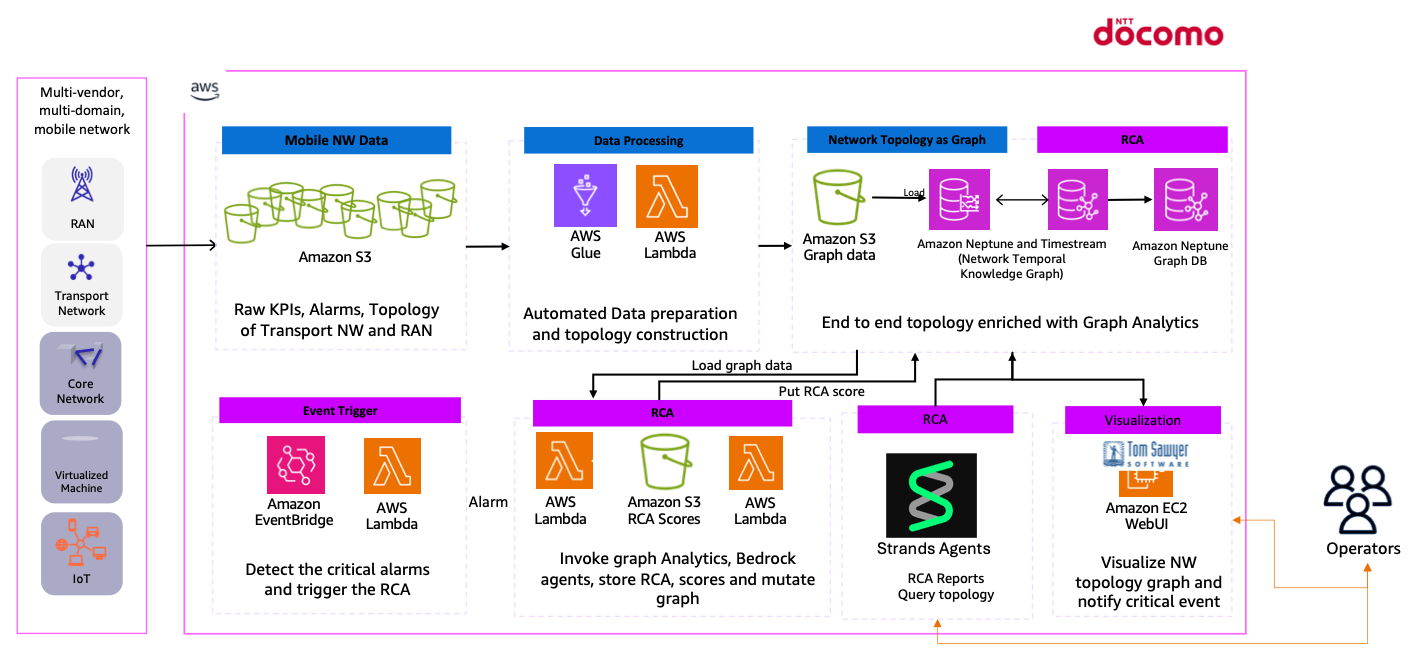
Figure 9. DOCOMO Overall HLD Solution architecture with current deployment and future enrichment
The following diagram shows NTT DOCOMO’s current MVP WebUI dashboard, built with TomSawyer Perspective. For more details about the MVP, please visit this recorded demo at Mobile World Congress 2025.
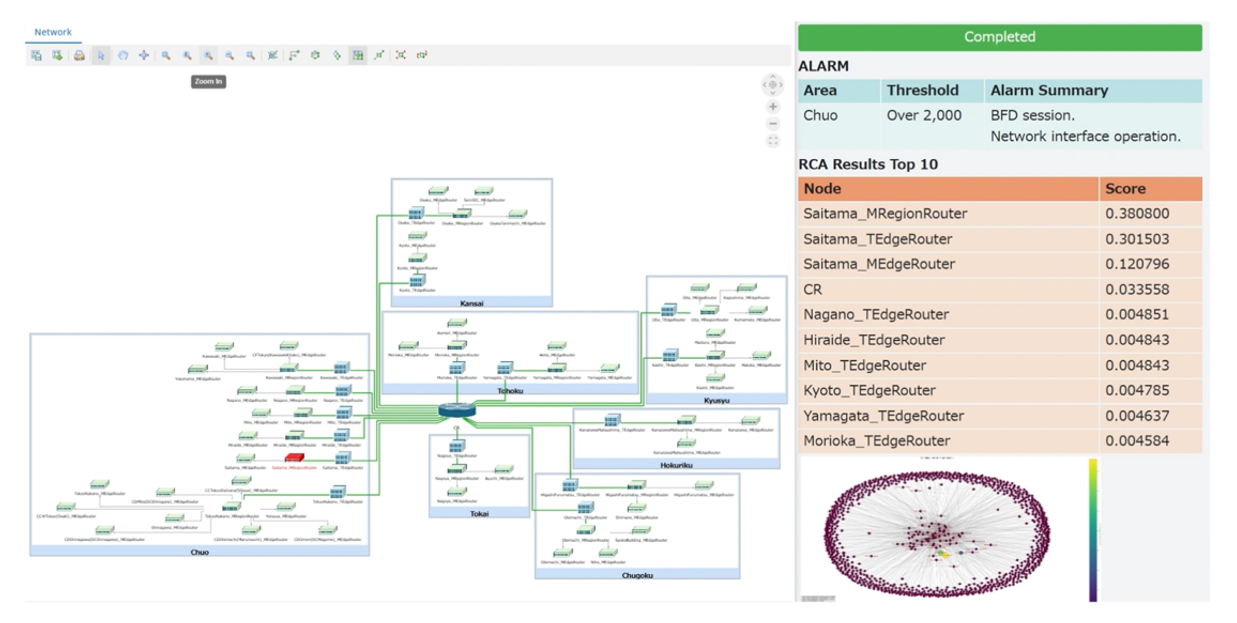
Figure 10. Neptune Graph Analytics Algorithms isolating the failure
Root Cause Analysis science perspective and the emergence of Graphs
Having outlined our agentic AI-powered graph-based RCA on AWS with its four runbooks and knowledge layer, we now examine how this approach aligns with the broader scientific evolution of network root cause analysis. The timeline below demonstrates how RCA has progressively embraced graph-centric methodologies, hereafter an excerpt of the state of the art: Root-cause analysis (RCA) for mobile and software networks has moved through four graph-centered phases:
- Alarm-correlation era (2011 – 2014) – A hierarchical alarm-information graph condensed tens of thousands of raw alarms into a single causal chain within minutes.
- Self-modelling era (2015 – 2017) – Dependency graphs generated in real time from software-defined networking (SDN) or network functions virtualization (NFV) controllers located faults with 95 % accuracy in less than 30 seconds. Online Bayesian weighting then cut false positives by approximately 30 % compared with static rules.
- Log-mining and explainable machine-learning (ML) era (2020): The directed-interval-graph–directed-acyclic-graph (DIG-DAG) structure streamed live fourth generation (4G) and fifth generation (5G) alarms into queryable causal subgraphs. Ericsson combined SHapley Additive exPlanations (SHAP) with gradient boosting to reveal the key performance indicator (KPI) path behind slice service-level-agreement (SLA) breaches.
- Deep graph-learning era (2022 – 2024): Graph-structure-learning graph neural networks (GNNs) inferred hidden inter-cell links and lifted localization F1-score by 15 % when metrics were missing; a deep autoencoder pinpointed Industrial Internet of Things (IIoT) application anomalies with sub-second latency. A recent GNN-Transformer hybrid, captures spatio-temporal patterns across thousands of 5G cells and identifies the root cause on its first guess in greater than 90 % of test cases.
Next steps
This post covered our network digital twin solution using graphs and Agentic AI. We showed the Amazon Neptune foundation layer with real-time topology, alarms, and KPIs. The solution features four runbooks from basic alarm correlation to predictive KPI forecasting, each powered by specialized agentic AI crews for root cause analysis. As next steps:
- Deep-Dive Blogs: Four implementation blogs coming soon. Each covers one runbook with network scenarios and code examples showcasing practical deployments.
- DOCOMO Commercial Deployments: continuing our collaboration with OSS teams to enrich with new features and extend to other network segments and the service layer.
- Extended Partnerships: Currently working with multiple customers and partners to develop digital twin solutions for root cause analysis, service impact assessment, and change management.
Previous customer public references on the network digital twin as a graph for RCA and service impact assessment on AWS can be found at the following sites: Networks for AI and AI for Networks: AWS and Orange’s Journey, DOCOMO- Network digital twin as a graph: powered with generative AI, re:invent 2024 with Orange, Generative AI–powered graph for network digital twin, and Telenet Belguim/LG, Celfocus and AWS- Network operations powered by network digital twin