AWS Compute Blog
Accelerating local serverless development with console to IDE and remote debugging for AWS Lambda
Delightful developer experience is an important part of building serverless applications efficiently, whether you’re creating an automation script or developing a complex enterprise application. While AWS Lambda has transformed modern application development in the cloud with its serverless computing model, developers spend significant time working in their local environments. They rely on familiar IDEs, debugging tools, testing frameworks, and build within established organizational workflows to deliver production-ready applications.
This post covers some recent enhancements to local developer experience. Two new Lambda features, namely console to IDE and remote debugging, further bridge the gap between cloud and local development, enabling you to leverage the full power of your local tools while working with Lambda functions in the cloud.
Overview
Serverless development with Lambda spans both cloud and local environments, each with its unique strengths. While the Lambda console offers rapid deployment and prototyping, local development provides the depth and flexibility needed for a complex application development workflow that includes integration testing, deployment to shared environments, continuous integration/continuous deployment (CI/CD) pipelines, and collaboration with other team members. The local developer experience encompasses the tools, workflows, and practices that developers use on their local devices to build and maintain their applications. An intuitive local development experience helps application development teams achieve high productivity, ensure code quality, and confidently ship changes to production.
Recent local serverless development experience enhancements
Local development workflows can be seen as two distinct but interconnected loops: the inner loop of writing, testing, and debugging code locally, and the outer loop that extends to cloud deployment, integration testing, release pipeline, and monitoring, as shown in the following figure. For serverless applications, developers want immediate feedback within the inner loop, as they iterate on function code and test integrations with AWS services. AWS has been steadily enhancing the local development experience for developers building on Lambda, with a focus on accelerating the inner loop, where developers spend most of their time.
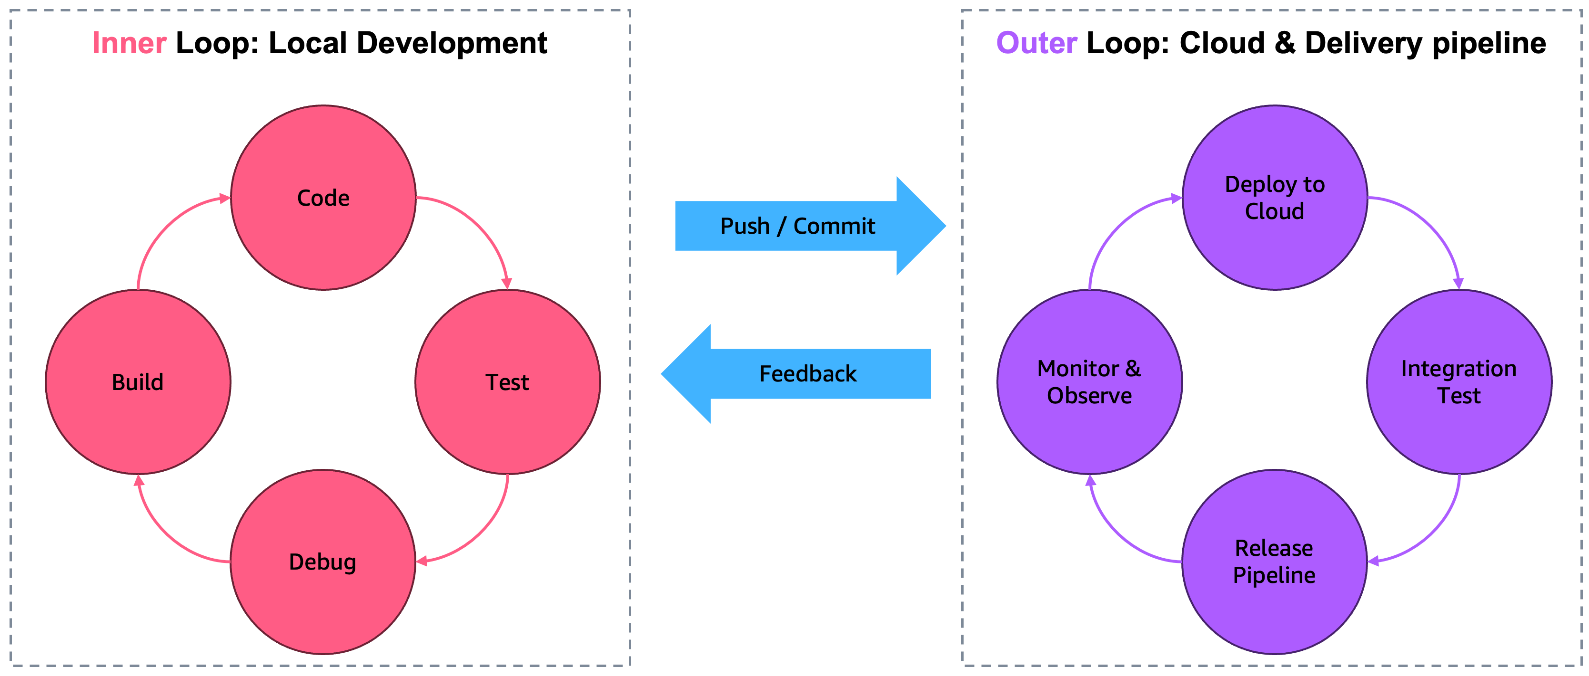
Figure 1: Inner and outer loop
Visual Studio Code (VS Code) is the most popular IDE among developers according to the 2024 Stack Overflow Developer Survey. Enhanced local IDE experience enables developers to code, test, debug, and deploy Lambda-based serverless applications more efficiently in their local IDE when using VS Code. It introduced the Application Builder interface, which streamlines the entire development workflow from setup to deployment with features such as guided walkthrough for environment setup, pre-configured sample applications, build setting management, and improved local debugging capabilities. This eliminates the need to switch between multiple interfaces. This experience also integrates with AWS Infrastructure Composer, which enables visual application building directly from VS Code, and provides quick-action buttons for common tasks like building, deploying, and invoking functions both locally and in the cloud.
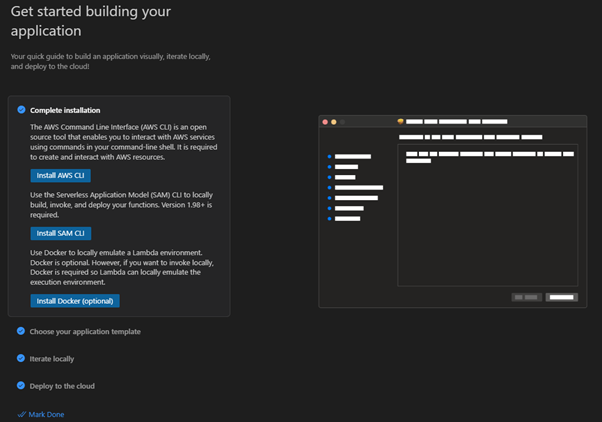
Figure 2 Guided walkthrough in VS Code IDE
With Serverless Land’s extensive ready-to-use pattern library available directly in VS Code, you can now browse, search, and implement a collection of curated, pre-built serverless patterns without leaving the IDE. This integration makes it easier to use proven architectures and AWS best practices while building serverless applications. Amazon CloudWatch Logs Live Tail support for Lambda functions in VS Code brings real-time log streaming and analytics capabilities directly into the IDE, enabling you to monitor and troubleshoot your Lambda functions without context switching. Whether testing a new feature or debugging an issue, you can now see the immediate impact of your code changes without leaving the IDE.
Console to IDE
Over the past decade, the Lambda console has enabled developers to quickly get started with writing Lambda functions, allowing them to rapidly iterate through changing code, testing, and deploying their functions. The console IDE experience saw a major usability refresh in 2024, including the introduction of Amazon Q Developer in the Lambda console.
As applications grow in complexity, developers often need to refactor code, add complex logic, include utility libraries as dependencies, or handle edge cases in their Lambda functions. Examples include using external libraries for complex time calculations or adding modules that perform caller-specific validations. This can make functions too bulky to manage in the console.
Developers may also want to move their functions into a software development lifecycle (SDLC) process that includes test frameworks, security scanning tools, infrastructure as code (IaC) templates, or CI/CD pipelines. This may necessitate that they use version control to collaborate across the team or develop with an AI agent steered by custom rules.
Previously, setting this up required manually configuring a local development environment, including IDE, language runtime, and build/package toolchains. Then, you had to download your function code, configuration, and integration settings and copy them into the IDE. You also had to create the required IaC template with AWS Serverless Application Model (AWS SAM). Only then could you deploy to the cloud to validate the accuracy of your code and configuration and continue with your development workflow.
The new Lambda console to IDE feature enables seamless transition from a cloud-hosted code/test cycle to a local environment, allowing you to download your function code and configuration to local VS Code IDE with just one click. From there, you can easily add dependencies and commit code into source control. Furthermore, you can sync back to the cloud for deployment or export a full AWS SAM template with the “Convert to SAM” capability and continue managing your function as if you had started locally. Console to IDE guides you through setting up the IDE on your local device, if you don’t already have one, along with any necessary configuration. The following figures show a function open in the Lambda console and thereafter in the local VS Code IDE.
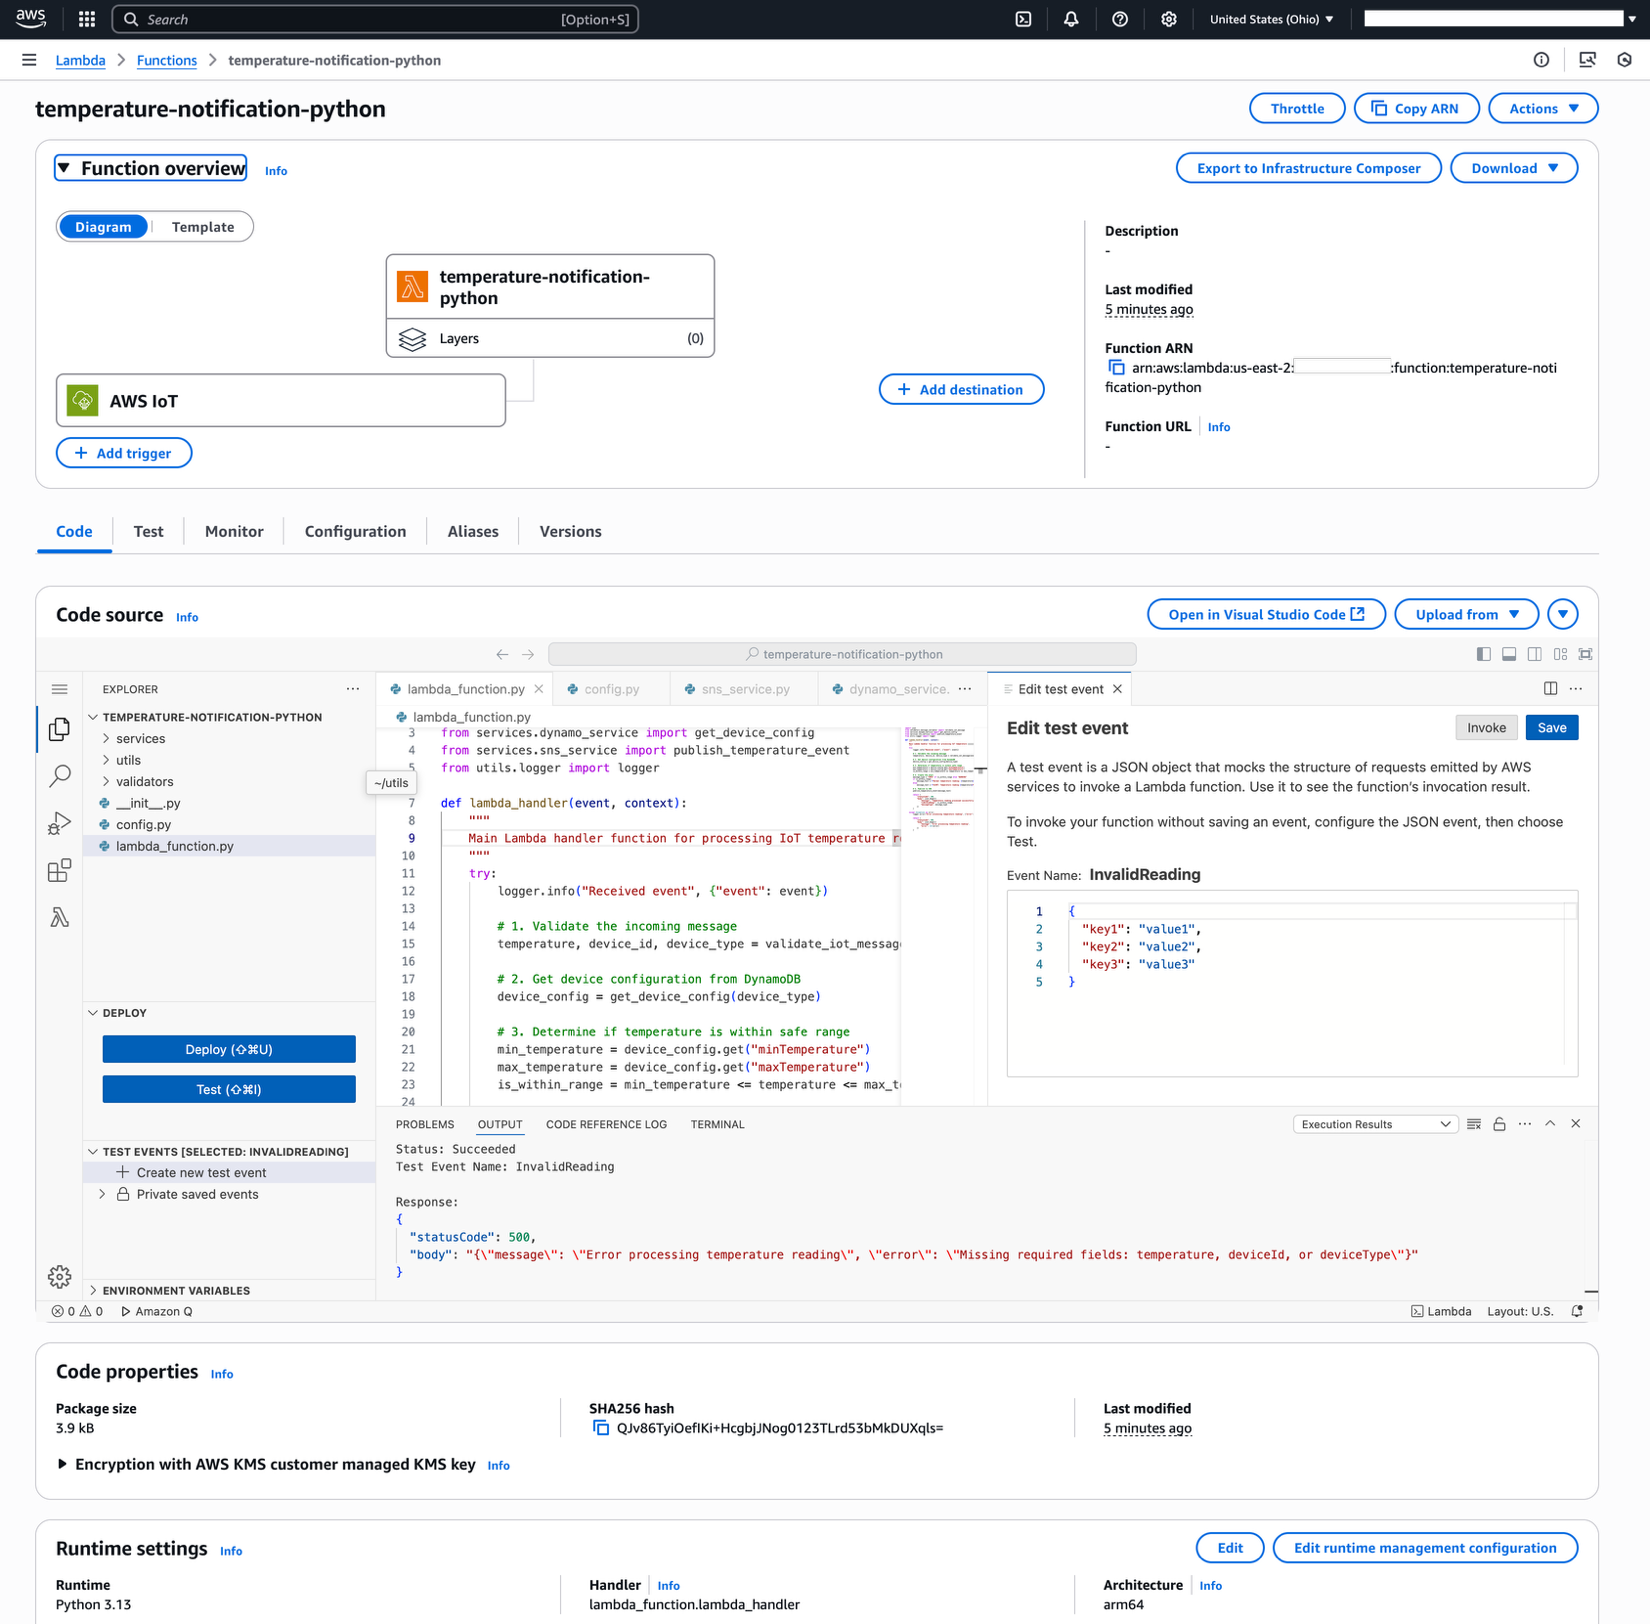
Figure 3: A Lambda function as seen in the console IDE
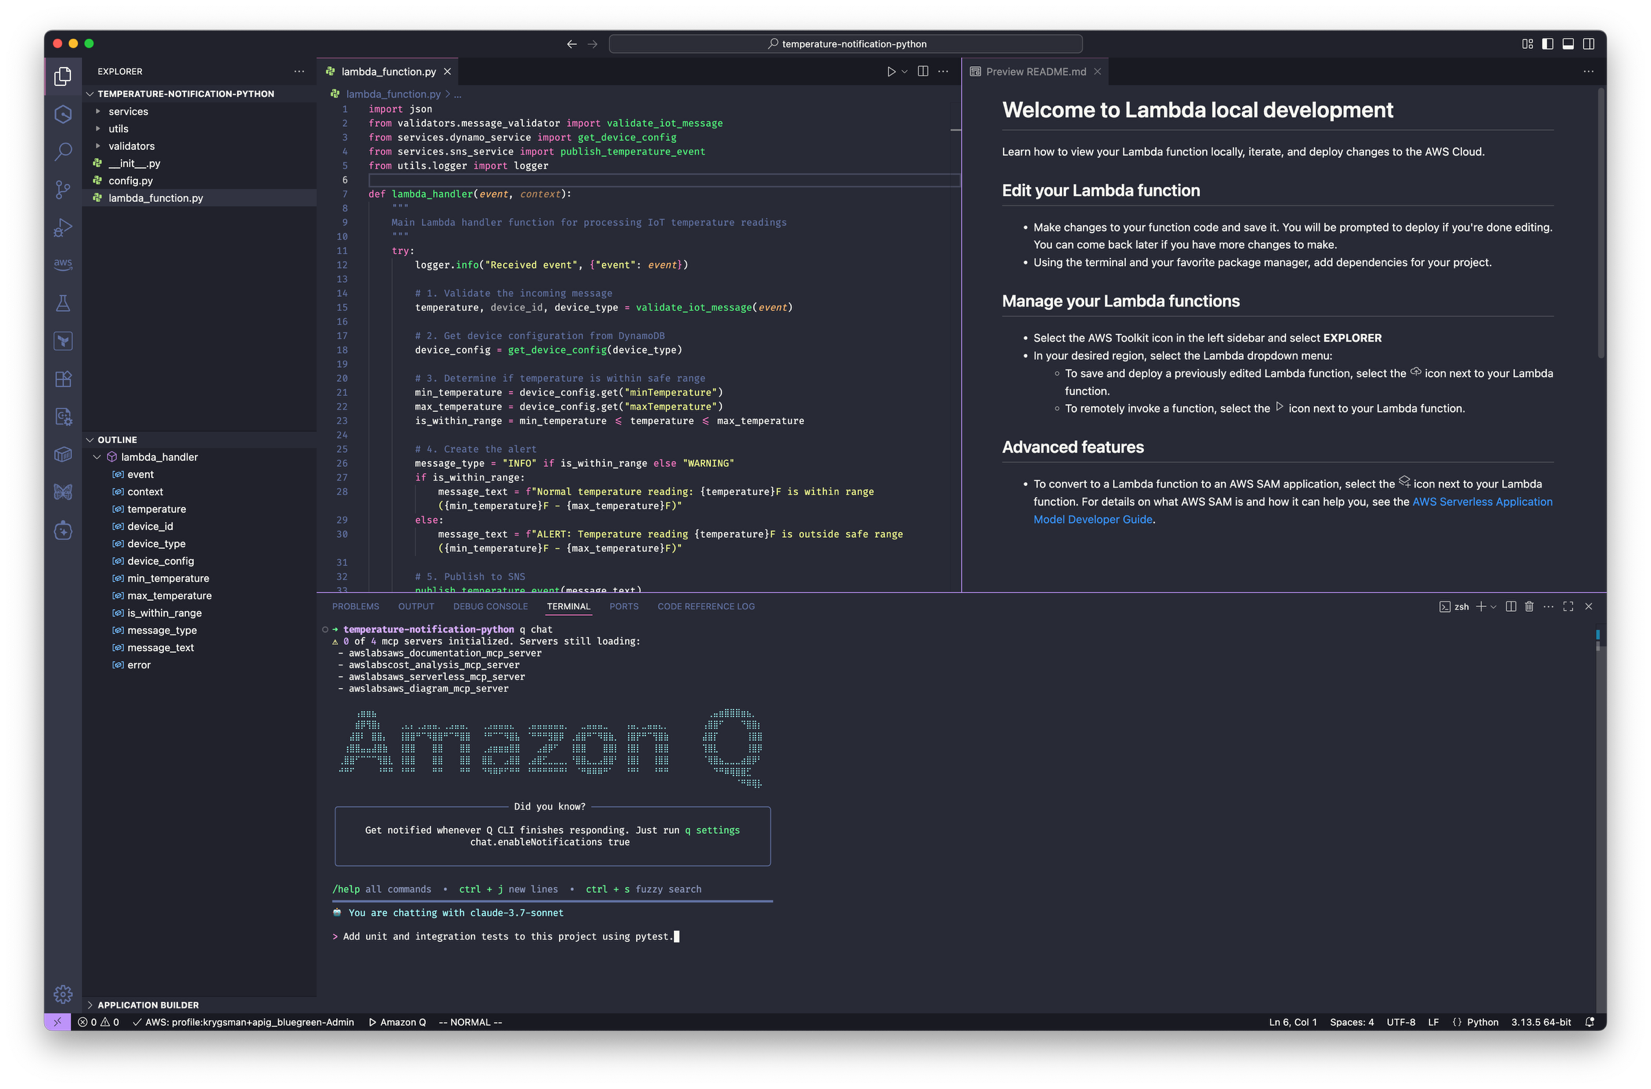
Figure 4: The same Lambda function as seen in a local IDE after Console to IDE export
By making it easy to transition inner loop development between cloud and local development environments, the console to IDE feature makes it easy to quickly scale an idea from proof-of-concept to a full-fledge serverless application. Visit the Lambda documentation to learn more.
Remote debugging
Developers building serverless applications with Lambda often need to test and debug cross-service integrations. While local debugging tools offer valuable capabilities, they do not fully replicate the Lambda runtime environment and its interactions with other AWS services, especially when dealing with Amazon Virtual Private Cloud (VPC) resources and AWS Identity and Access Management (IAM) permissions. Therefore, developers had to rely on print statements and verbose logging, and for complex scenarios they had to deploy their functions multiple times to diagnose and resolve issues. This process extended development cycles, particularly when troubleshooting issues specific to the production environment. Developers wished they could use advanced local development tools like debuggers to investigate issues with code running in Lambda functions deployed in the cloud.
Lambda’s new remote debugging feature now enables you to debug your functions running in the cloud directly from your local VS Code IDE using the AWS Toolkit extension. You can now debug the execution environment of the function running in the cloud in its IAM execution role’s security context with access to configured VPC resources, and trace execution through entire service flows in the cloud.
To start debugging, enable Remote debugging when invoking your function through the AWS Toolkit. Configure your local code path and payload and choose Remote Invoke. AWS Toolkit automatically adds an AWS-managed debugging Lambda layer to your function, extends the timeout, publishes a temporary version, and reverts the config change. AWS Toolkit then invokes the published debug version. You can then start debugging. This feature establishes a secure connection between your local debugger and the function running in the cloud using AWS IoT Secure Tunneling. When your debug session is finished, Lambda automatically removes the temporary function version. You can end your debug session explicitly. Otherwise, it will end automatically after 60 seconds of inactivity or when the Lambda function timeout is reached.
The following figure shows how setting a breakpoint in VS Code IDE during a remote debugging session pauses execution so that you can inspect the data with which the function running in the cloud is called, along with your function’s variables. You can continue to step forward from this point line-by-line to follow the function’s execution.
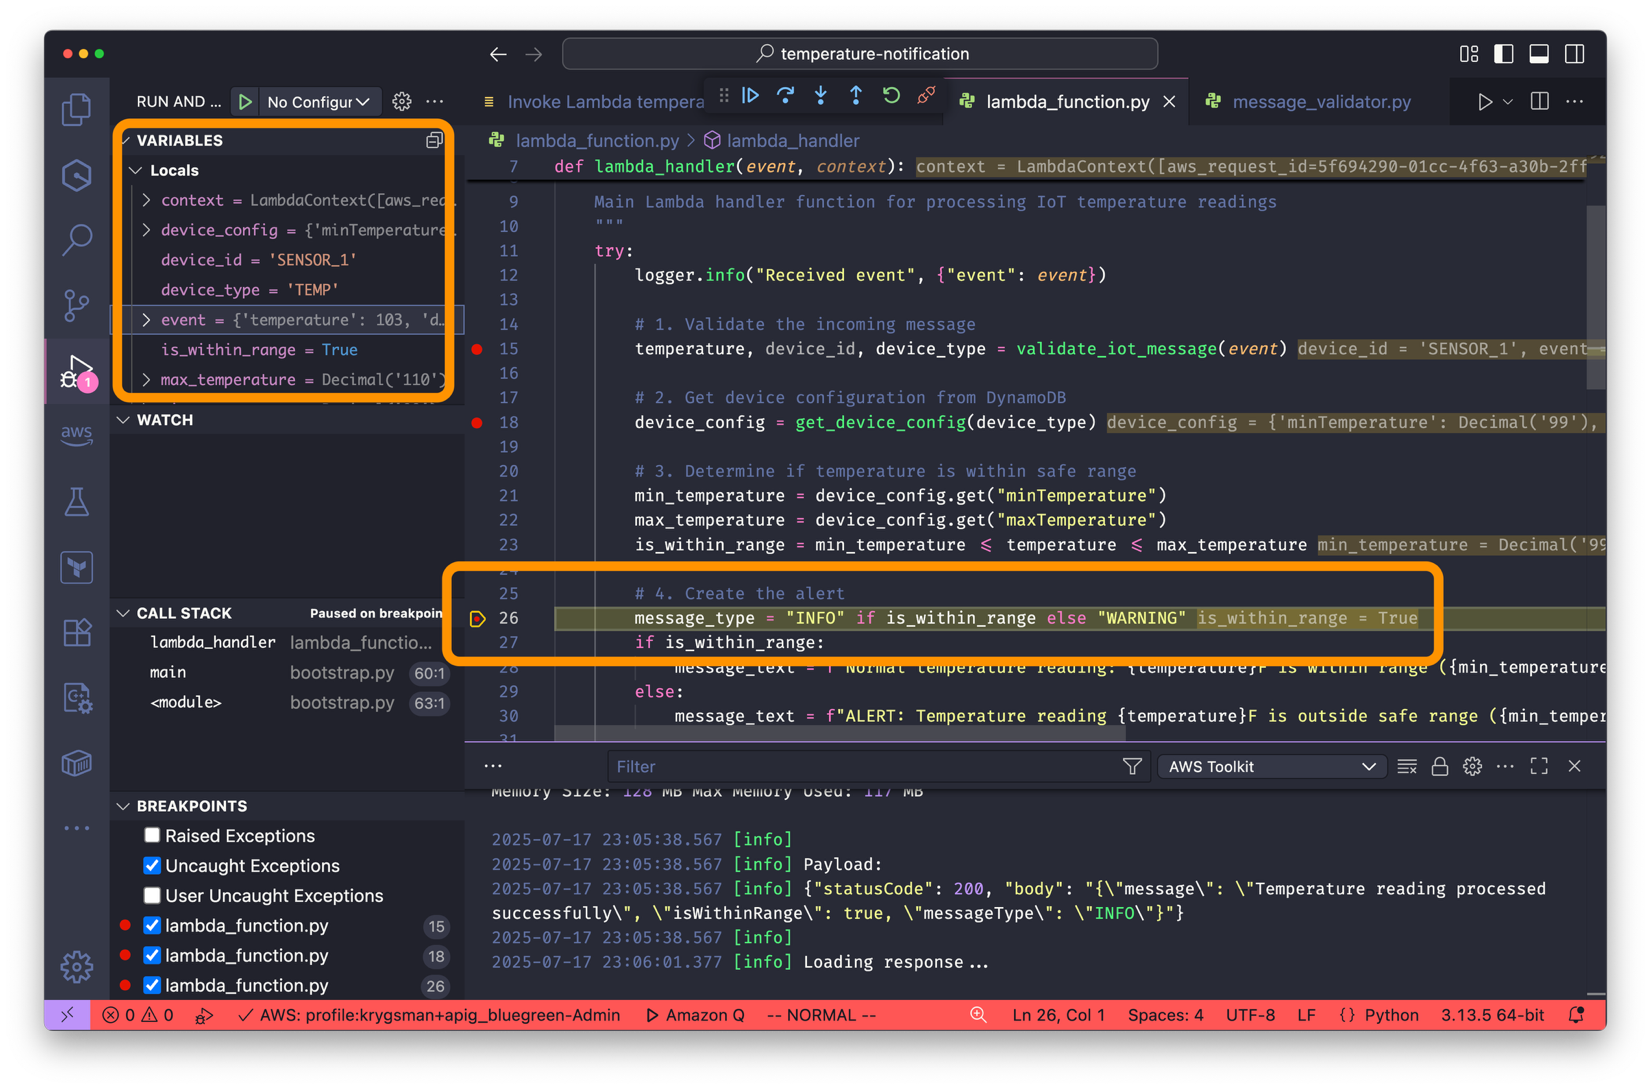
Figure 5: VS Code IDE debugger attached to execution environment of a Lambda function running in the cloud
All of this means that you don’t have to set up local emulators to approximate cloud behavior, manage complex test frameworks, or continuously capture expensive logs with TRACE-level detail to understand how your code executes. Your debugger can show you exactly what invocation parameters look like, such as event and context, when they reach your function handler. You can step through how your function behaves for different inputs and inspect variable values along the way. Since your code is running in the cloud, you can even see how your function’s IAM execution role affects its behavior. As you step through, you can immediately see when an AWS SDK service call fails due to lack of permissions.
Moreover, you can combine this with the console to IDE feature described previously in this post. When you’ve downloaded your function and scaffolded your local environment with console to IDE, you can debug the function as it runs in the cloud with remote debugging. This gives you much more visibility into the Lambda developer experience, which helps you find issues more easily, fix bugs quickly, and deliver new features rapidly. Follow the steps in the documentation to get started.
Best practices
Although the improved developer experience enables you to move faster when building serverless applications using Lambda, you should incorporate AWS-recommended best practices into your application development workflow.
For large or complex functions, refactor the code following the programming language norms so that developers and AI agents can better understand it. For example, move complex business logic, such as inventory calculations, out of the function handler into a separate module. Console to IDE allows you to use your local refactoring tools to refactor function code.
For isolated cost allocation and security boundaries between development and production, use separate AWS environments for different stages of your development process. You can use console to IDE to generate an AWS SAM template for your application with properties of your function and related AWS resources, which streamlines consistent cross-environment deployments. Then, you can then automate deployments of your template and function code with a CI/CD pipeline.
During development, you should test your functions in the cloud when you can. Remote debugging makes it easier to test functions running in the cloud from your local environment, allowing you to step through your code to validate logic and least-privilege function execution permissions. To optimize cost, focus on logging just enough to recreate problem scenarios, including necessary context about function execution, rather than logging everything you need to diagnose behavior. This also means that you have smaller log volumes to sift through.
You should recreate problem scenarios in an environment where you control the flow of input and can use remote debugging. When possible, you should use a development environment where there are no other sources of invokes. There’s a small window while remote debugging applies the temporary config change where other traffic to $LATEST might cause unexpected results, such as a slower cold start. By default, the debugger does not initialize when running on $LATEST. You should also use Aliases and Versions to explicitly pin environments to the appropriate version of a function, which avoids this problem and gives you more deterministic behavior along with the ability to do canary deployments.
Conclusion
The local development experience enhancements, including debugging workflows and IDE integrations, minimize the configuration and setup needed for developers to locally build serverless applications using Lambda. This enables developers to focus on building business logic. These enhancements also provide the rapid feedback loop developers need while making sure that their local environment accurately reflects cloud behavior.
AWS continues to streamline the local developer experience for serverless applications in areas such as local testing of service integrations, IaC workflows, troubleshooting capabilities, and using AI assistance more deeply in local development workflows. All of this helps developers build more efficient and secure serverless applications.
To get started with these new capabilities, visit the Lambda developer guide for detailed walkthroughs and best practices. Share your experiences and suggestions through the Lambda GitHub issues page to help shape the future of serverless developer experience.
For more serverless learning resources, visit Serverless Land. Likewise, check out this video from an AWS Community Builder showcasing the latest capabilities.