AWS Big Data Blog
Introducing AWS Glue Data Catalog usage metrics for API usage
We’re excited to announce AWS Glue Data Catalog usage metrics. The usage metrics is a new feature that provides native integration with Amazon CloudWatch. This feature provides you with immediate visibility into your AWS Glue Data Catalog API usage patterns and trends.
AWS Glue Data Catalog is a centralized repository that stores metadata about your organization’s datasets. With its unified interface that acts as an index, you can store and query information about your data sources, including their location, formats, schemas, and runtime metrics.
As you scale your lakehouse architecture on Amazon Web Services (AWS) and maintain reliable data operations, observability and monitoring becomes critical to understanding and optimizing Data Catalog API usages.
With Data Catalog usage metrics in CloudWatch, you can achieve the following:
- Monitor API call patterns at 1-minute intervals
- Proactively request service quota increase for API rate limits
- Enable the CloudWatch pre-built anomaly detection feature to identify abnormalities in your API usage
- Understand lakehouse usage across more than 50 APIs
In this post, we demonstrate how to access these metrics, provide a step-by-step walkthrough, and set up meaningful alarms.
Access Data Catalog usage metrics in Amazon CloudWatch console
To access Data Catalog usage metrics, complete the following steps:
- Open Amazon CloudWatch console
- Under Metrics, choose All metrics
- In the search bar, enter
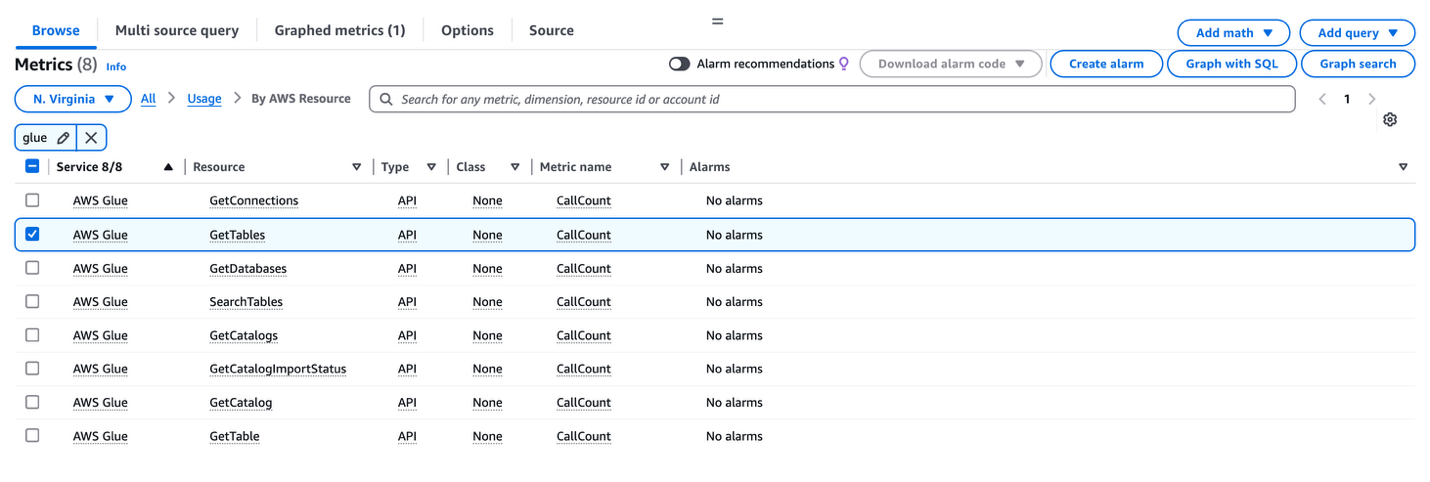
Glueand choose Enter - Choose Usage > By AWS Resource, as shown in the following screenshot
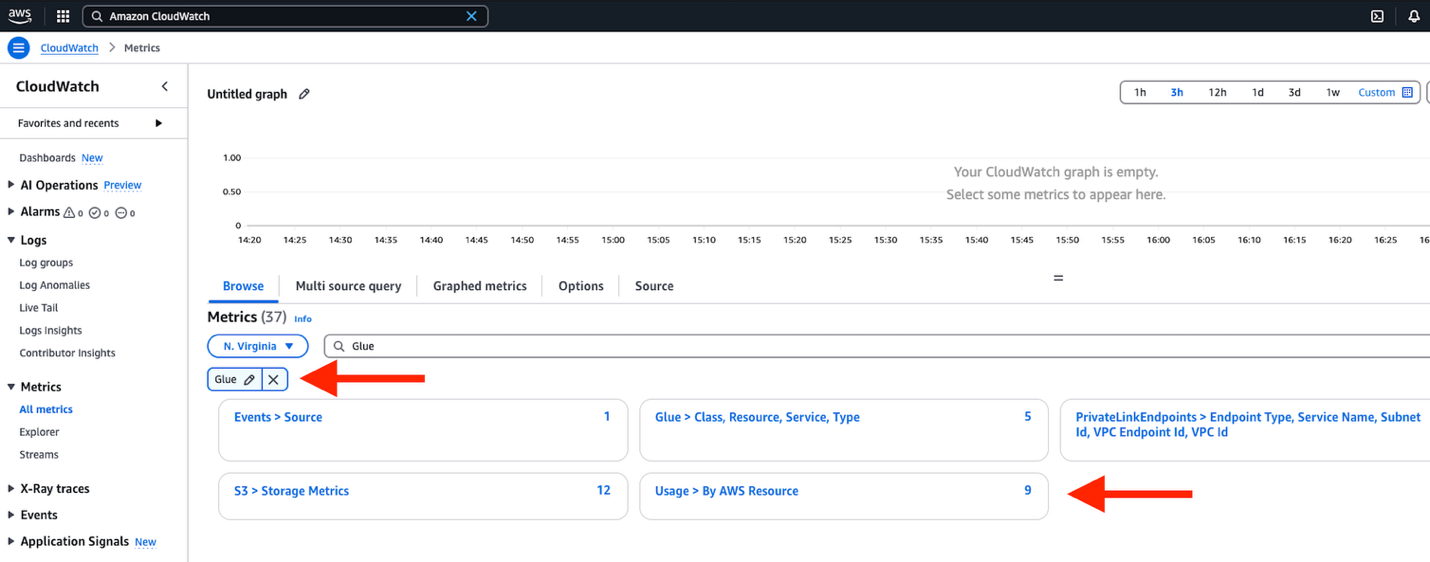
- The Metrics section opens and displays different catalog usage metrics that you can select from to create dashboards and alarms, as shown in the following screenshot
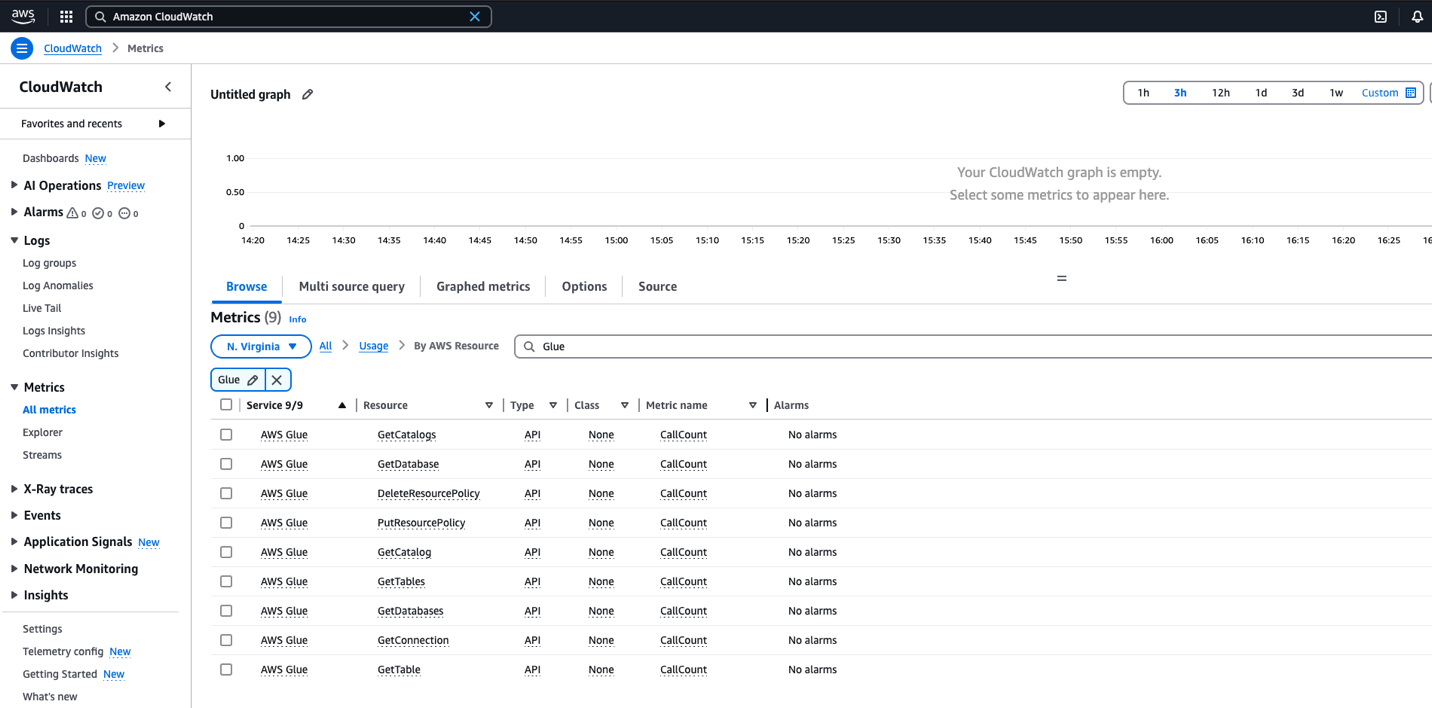
Monitor CallCount metrics
Each Amazon CloudWatch metric for Data Catalog is of a type API and set as CallCount. This means that for each API call on that specific resource (for example, GetConnection API) will be logged as one count. These metrics can seamlessly integrate into your existing CloudWatch dashboards, or you can use them to create new ones. For proactive monitoring, you can configure custom alarms that trigger automatically when this API usage exceeds your defined thresholds, helping you comply with service limits.
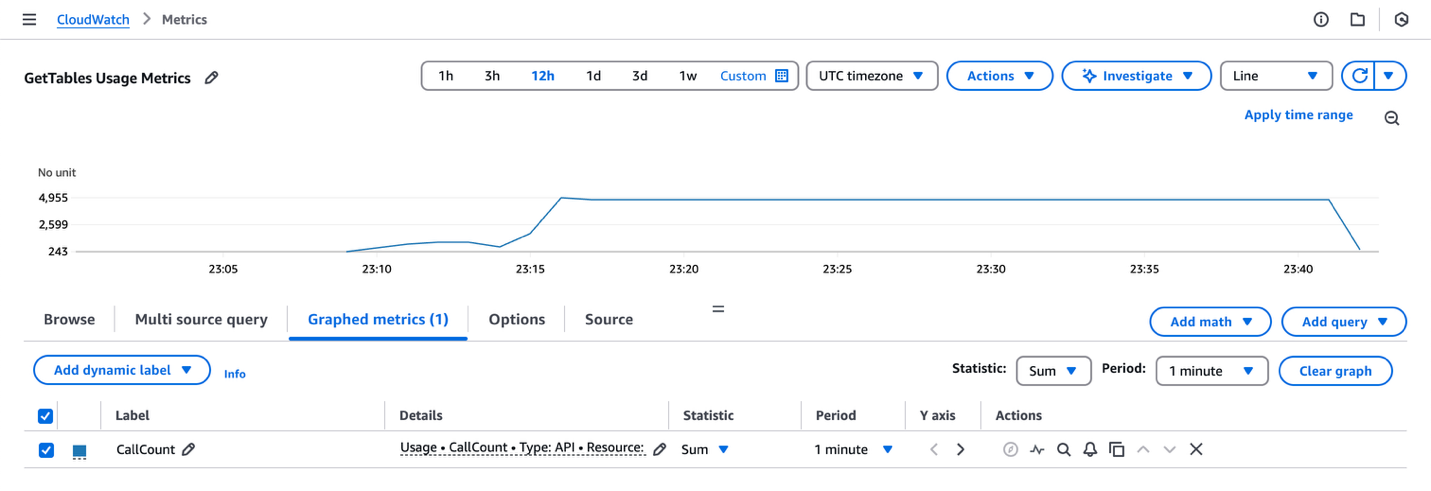
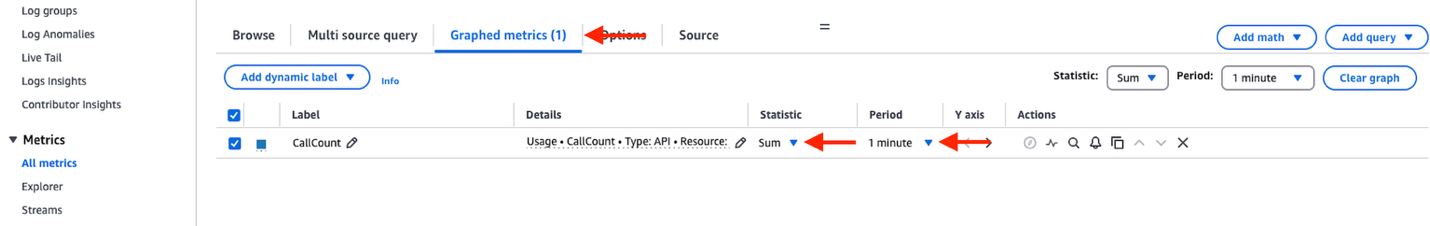
Under the Graphed metrics tab, you can provide additional customizations to match your monitoring needs. In the Details column, you can create alarms and enable anomaly detection to identify unusual patterns.
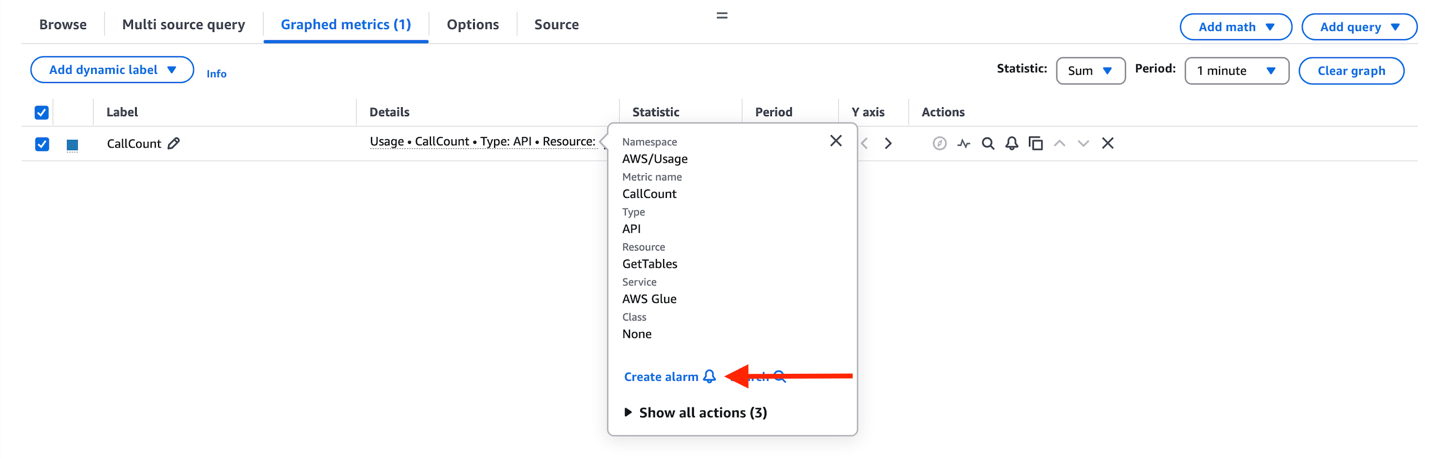
To help with effective API monitoring, CallCount metrics specifically focus on successful API calls. This way, you have more precise monitoring and can troubleshoot different types of API behaviors. The following screenshot shows the AWS Glue usage metrics view for GetTables API.
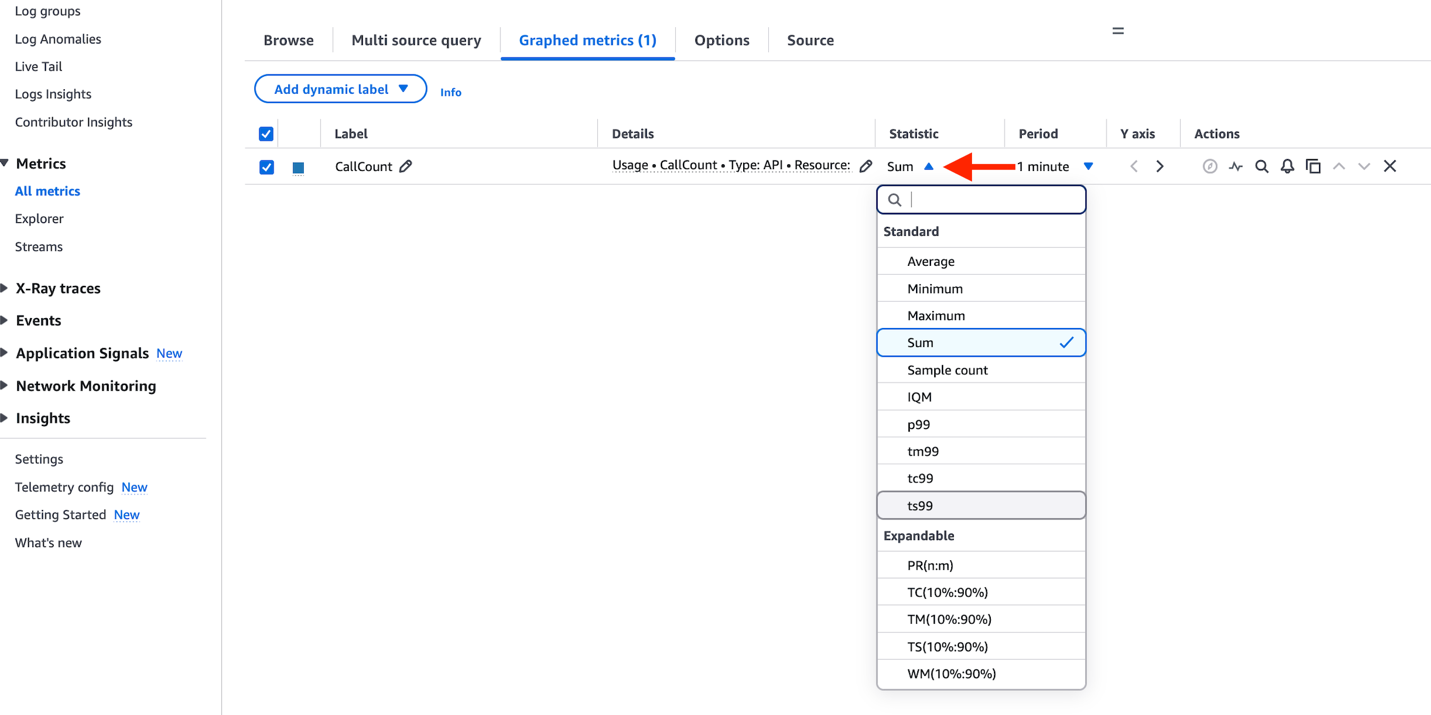
In the Statistics column, you can view your API usage beyond the default Sum, Min, and Max metrics. You can now select a wide variety of statistical methods to analyze your usage patterns, as shown in the following screenshot.
Metrics and dimensions for Data Catalog usage metrics
Data Catalog usage metrics use the AWS/Usage namespace and provide CallCount metrics. These metrics are published with the dimensions Service, Resource, Type and Class.
The CallCount metric doesn’t have a specified unit. The most useful statistic for the metric is SUM, which represents the total operation count for the 1-minute period. An important note is that the metric value is emitted at 1-minute intervals. Reducing the period further (for example, to 1 second) won’t change the emittance interval.
Metrics
| Metric | Description |
CallCount |
The number of specified operations performed in your account. |
Dimensions
| Dimension key | Dimension value | Description |
| Service | AWS Glue | The name of the AWS service containing the resource. For Data Catalog usage metrics, the value for this dimension is AWS Glue. |
| Type | API | The type of resource being tracked. Currently, when the Service dimension is AWS Glue, the only valid value for Type is API. |
| Resource | <API name> |
The name of the API operation. Valid values include the following: GetCatalogs, GetCatalog, GetDatabases, GetDatabase, GetTables, GetTable, GetTableVersion, GetTableVersions, SearchTables, GetPartitionIndexes, GetColumnStatisticsForTable, GetPartition, GetPartitions, BatchGetPartition, GetColumnStatisticsForPartition, GetConnection, GetConnections, GetUserDefinedFunction, GetUserDefinedFunctions, GetCatalogImportStatus, GetTableOptimizer, BatchGetTableOptimizer, ListTableOptimizerRuns, CreateCatalog, CreateDatabase, CreateTable, CreatePartitionIndex, CreatePartition, BatchCreatePartition, CreateConnection, CreateUserDefinedFunction, CreateTableOptimizer, UpdateCatalog, UpdateDatabase, UpdateTable, UpdateColumnStatisticsForTable, UpdatePartition, BatchUpdatePartition, UpdateColumnStatisticsForPartition, UpdateConnection, UpdateUserDefinedFunction, UpdateTableOptimizer, DeleteCatalog, DeleteDatabase, DeleteTable, BatchDeleteTable, DeleteTableVersion, DeletePartitionIndex, DeleteColumnStatisticsForTable, DeletePartition, BatchDeletePartition, DeleteColumnStatisticsForPartition, DeleteConnection, BatchDeleteConnection, DeleteUserDefinedFunction, DeleteTableOptimizer, TestConnection, ImportCatalogToGlue |
| Class | None | The class of resource being tracked. Data Catalog usage metrics use this dimension with a value of None. |
Set up CloudWatch alarms for Data Catalog usage metrics
Data Catalog has defined rules to manage atypical usage patterns that limit the customer call rate at the granularity of requests per second. You can generate CloudWatch alarms using the CallCount metric so that limit increases can be done proactively. To configure a CloudWatch alarm with this threshold, complete the following steps:
- On the CloudWatch metrics console, select one of the available metrics, as shown in the following screenshot. In this example, we select the resource
GetTables. You can select multiple metrics to fit your use case.
- Choose Graphed metrics.
- Choose Sum as the primary statistic.
- Set period to 1 minute.
- Choose Details and Create Alarm.
- For Threshold type, choose Anomaly Detection. You can also select Static based on your requirements and after you’ve determined a specific threshold value.
- Set the Anomaly detection threshold to 2 (default). The threshold value is used to determine the normal range of values for the metric. A higher value produces a thicker band of normal values. For more information on how CloudWatch anomaly detection works, refer to How CloudWatch anomaly detection works.
- Choose Next.
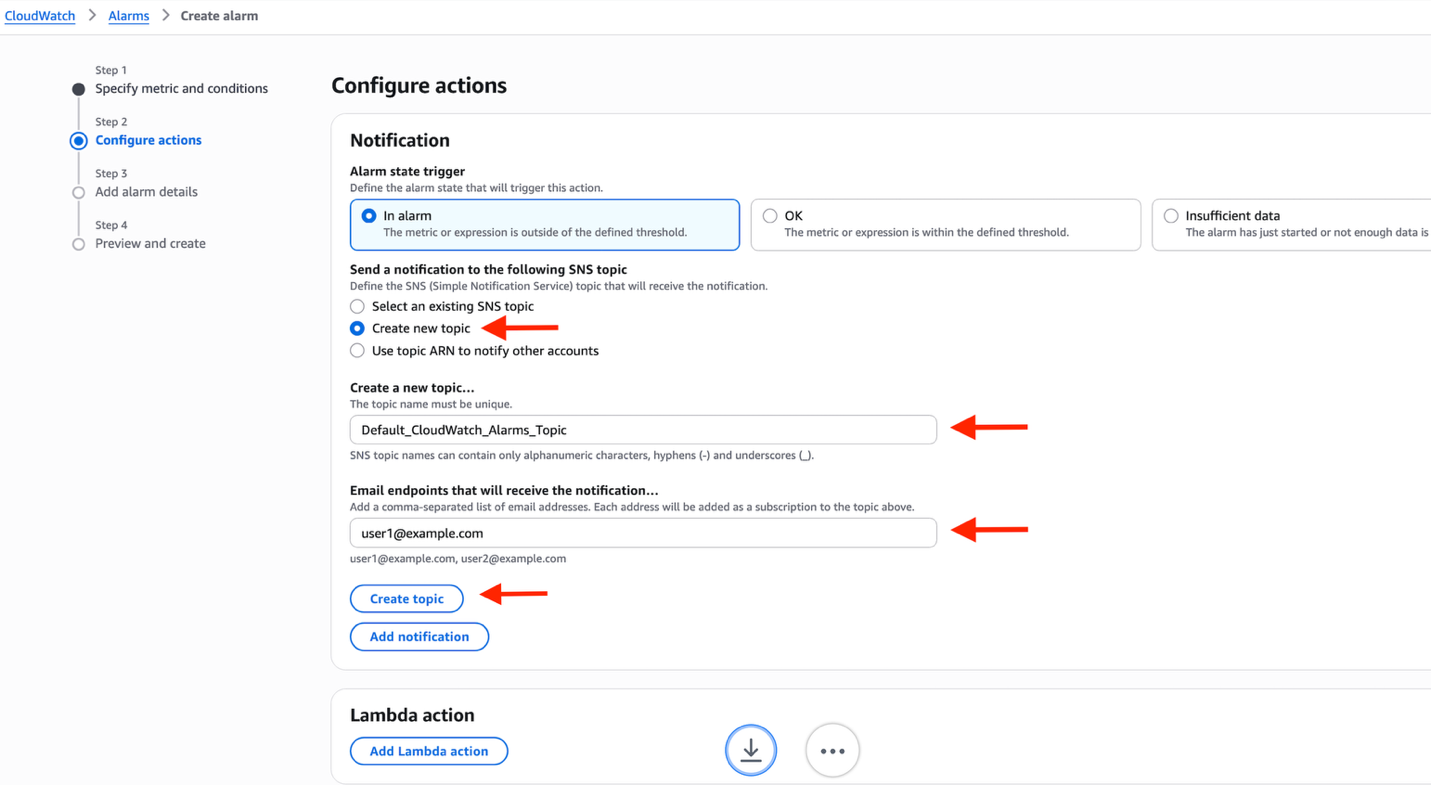
- For Send a notification to the following SNS topic, choose Create new topic.
- For Create a new topic, enter your Amazon Simple Notification Service (Amazon SNS) topic name.
- For Email endpoints that will receive the notification, enter your email address. In this example, we’re going to create a new SNS topic. However, you can use your existing SNS topics or use other options such as AWS Lambda or auto scaling action.
- Choose Create topic.
- Scroll down and choose Next.
- Enter an alarm name and a description and choose Next.
- Review all the details you’ve entered and choose Create alarm, as shown in the following screenshot.
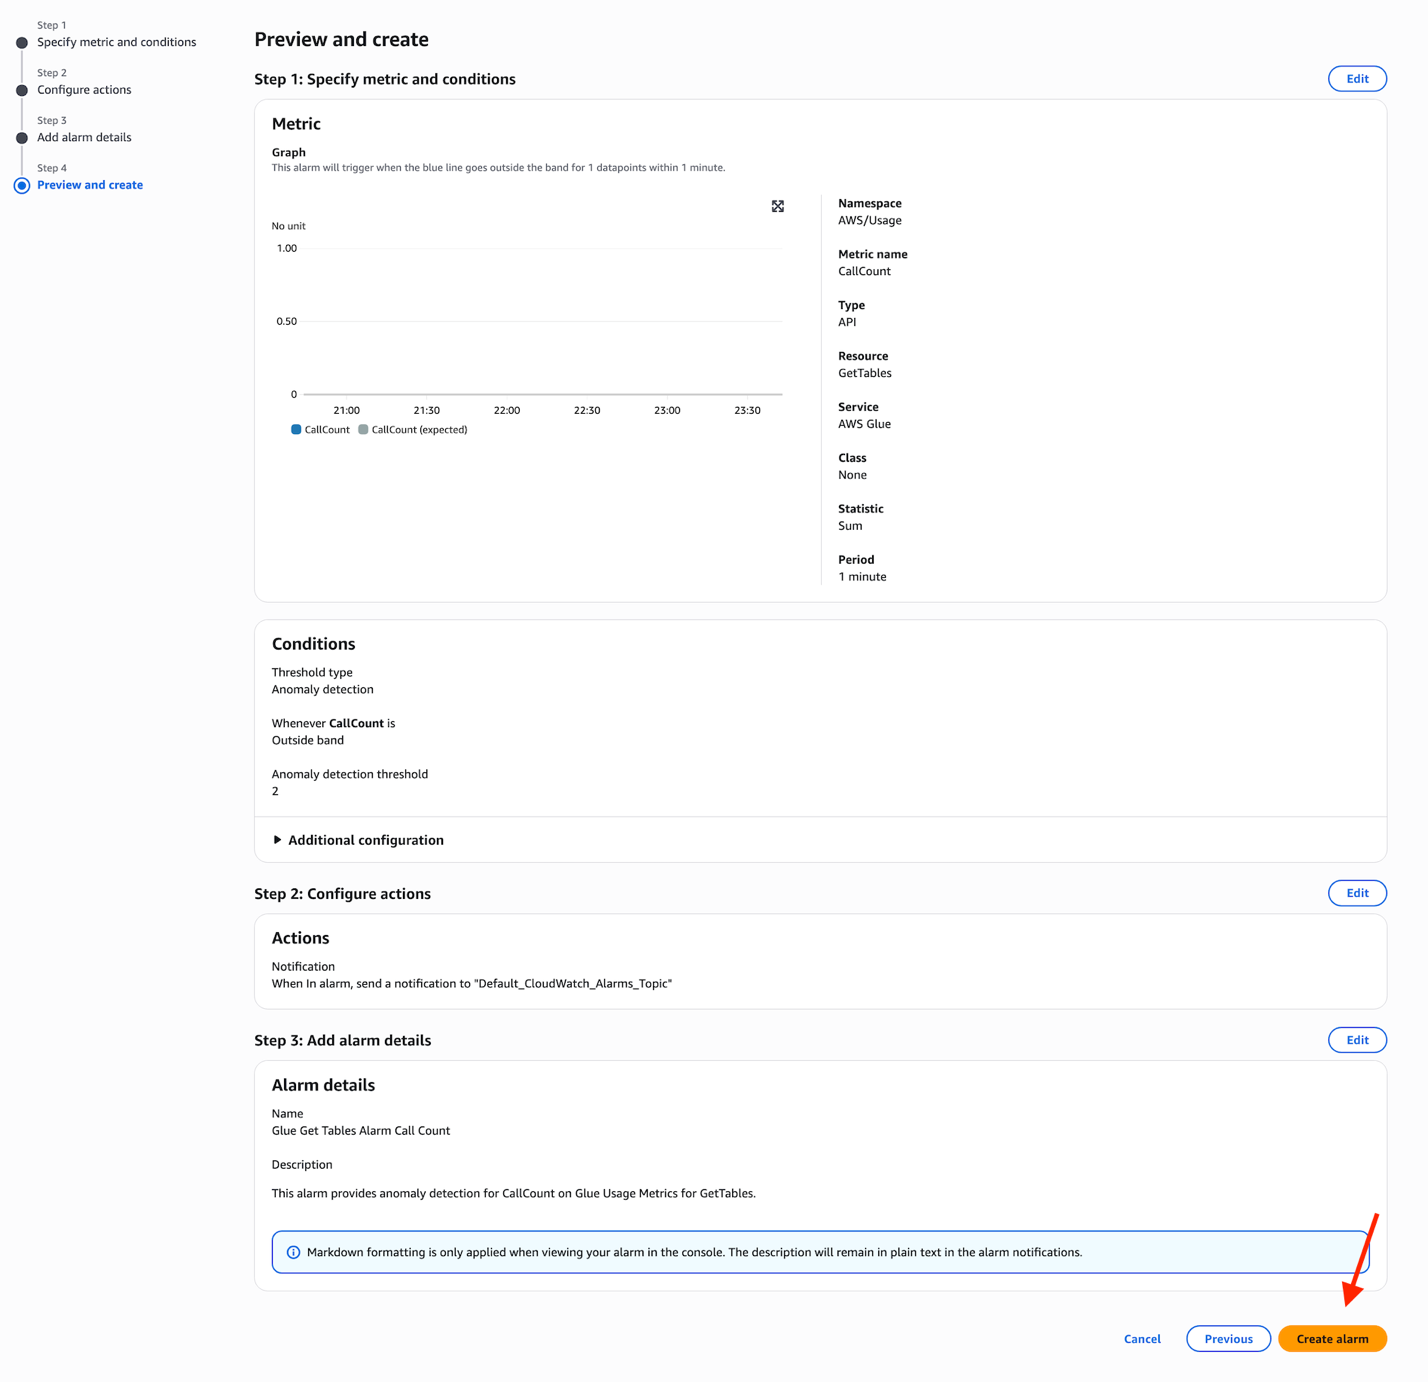
By following these steps, you’ve successfully configured a CloudWatch alarm using anomaly detection that monitors your Data Catalog usage with the threshold that you set. The alarm will trigger when the CallCount metric exceeds the calculated threshold, sending notifications to your specified SNS topic and email endpoints.
This proactive monitoring approach prevents API rate limit issues and provides a smooth operation of your Data Catalog usage. For more information on using CloudWatch alarms, refer to Using Amazon CloudWatch alarms.
Conclusion
AWS Glue Data Catalog usage metrics is an effective enhancement to your data infrastructure monitoring capabilities. It addresses the growing need for detailed observability through Amazon CloudWatch in modern data architectures built on top of Data Catalog. You now have access to more granular statistics, moving beyond simple maximum and average request metrics to comprehensive performance indicators including p99 percentiles. These metrics are emitted in 1-minute intervals, providing visibility into your data catalog operations. Organizations can now proactively identify bottlenecks before they affect operations and efficiently conduct capacity planning through detailed usage patterns.
From building monitoring dashboards to setting up alerts, the native support with CloudWatch anomaly detection and flexible alarm configurations makes it straightforward to proactively monitor your lakehouse deployment and prevent abnormalities in your lakehouse usage. For more information, refer to Monitoring Data Catalog usage metrics in Amazon CloudWatch in the AWS Glue documentation. We recommend testing and using these metrics as part of your modern monitoring and observability strategy. We encourage you to share your feedback with us.
Special thanks to everyone who contributed to this launch: Vineet Sunkavalli, Shubham Bansal, Mike Kloss, Zarius Dubash.
About the authors
 David Zhang is an Analytics Solutions Architect specializing in designing and implementing large-scale data infrastructure, ETL processes, and extensive data management systems. He helps customers modernize data platforms on Amazon Web Services (AWS). David is also an active speaker at AWS events and contributor to technical content and open source initiatives. He enjoys playing volleyball, tennis, and basketball during his free time.
 Noritaka Sekiyama is a Principal Big Data Architect with Amazon Web Services (AWS) Analytics services. He’s responsible for building software artifacts to help customers. In his spare time, he enjoys cycling on his road bike.
 Sandeep Adwankar is a Senior Product Manager at AWS. Based in the California Bay Area, he works with customers around the globe to translate business and technical requirements into products that enable customers to improve how they manage, secure, and access data.
 Abhay Joshi is a Software Development Engineer at AWS Glue and AWS Lake Formation. He is passionate about building fault tolerant and reliable distributed systems at scale.