AWS Architecture Blog
Architecting conversational observability for cloud applications
Modern cloud applications are commonly built as a collection of loosely coupled microservices running on services like Amazon Elastic Kubernetes Service (Amazon EKS), Amazon Elastic Container Service (Amazon ECS), or AWS Lambda. This architecture gives engineering teams flexibility and scalability, but its inherently distributed nature also makes troubleshooting more difficult. When something breaks, engineers often find themselves digging through logs, events, and metrics scattered across different observability layers. With Kubernetes, for example, without a deep understanding of the service, troubleshooting can turn into a time-consuming effort to manually correlate information from different sources.
In this post, we walk through building a generative AI–powered troubleshooting assistant for Kubernetes. The goal is to give engineers a faster, self-service way to diagnose and resolve cluster issues, cut down Mean Time to Recovery (MTTR), and reduce the cycles experts spend finding the root cause of issues in complex distributed systems.
Overview
One of the challenges of architecting a modern cloud application is keeping observability intact across many moving pieces. Anyone who has ever tailed logs in one terminal while running kubectl describe and curl commands in another, knows how tedious this can get. Distributed systems are powerful, but they’re also complex. Kubernetes, for example, offers strong orchestration capabilities, yet troubleshooting inside a cluster often means navigating multiple layers of abstractions such as pods, nodes, networking, logs, and events. On top of that, the system generates a large volume of telemetry, including kubelet logs, application logs, cluster events, and metrics. Making sense of these layers requires both expertise on the system and application knowledge.
This skill gap shows up in the numbers. According to the 2024 Observability Pulse Report, 48% of organizations say that lack of team knowledge is their biggest challenge to observability in cloud-native environments. MTTR has also been going up for three years straight, with most teams (82%) saying it can take more than an hour to resolve production issues.
When something goes wrong and your applications start to fail for an unknown reason, engineers often must start stitching together signals from multiple sources to find the root cause. That can be tedious for specialists, and it gets worse when the issue is intermittent or spans across services. Often, multiple teams need to get involved – application engineers may not know Kubernetes well, while platform teams may not have deep insight into the applications. This can result in longer troubleshooting cycles, potentially degraded user experience, and pulling engineers away from planned work that drives business goals.
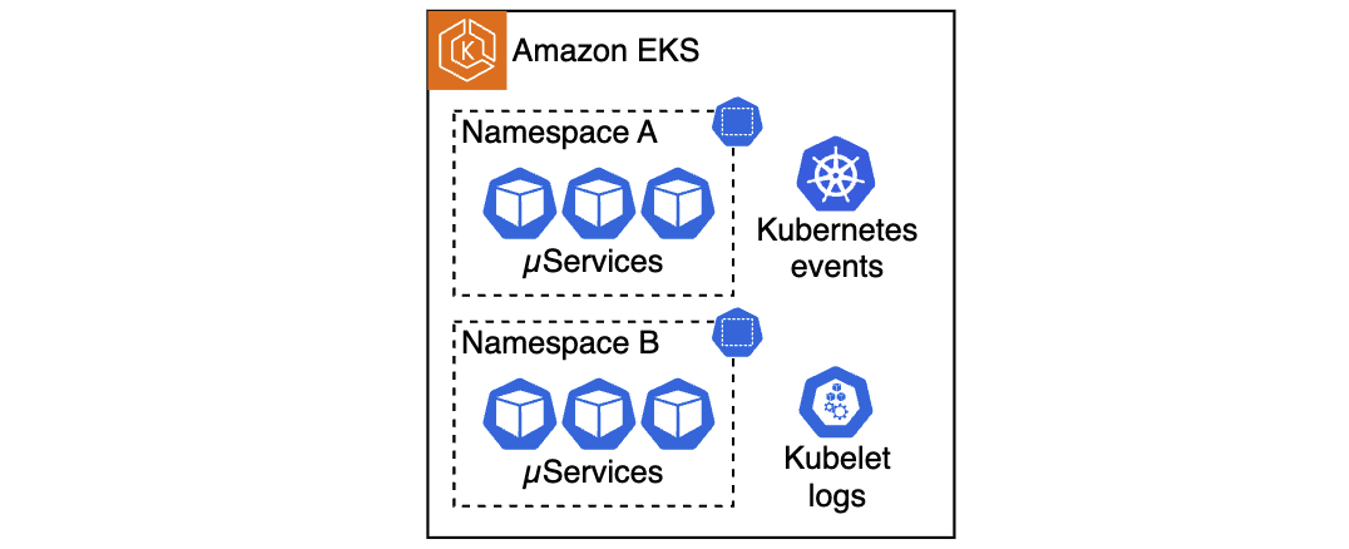 Figure 1. A multitude of telemetry sources in Kubernetes clusters
This is where generative artificial intelligence (AI) can help. Users can build an AI assistant that combines large language model (LLM)-driven analysis and guidance with existing telemetry data. This assistant enables engineers to troubleshoot issues faster, in a self-service way, without requiring every team to become Kubernetes experts. In the following sections, we show how to build such an assistant for Amazon EKS, however, keep in mind that a similar approach can be extended to other compute services like Amazon ECS or AWS Lambda.
Solution architecture
Architecting this AI-powered troubleshooting assistant consists of three primary parts:
- Deployment approach selection: The solution supports two architectures – a traditional Retrieval-Augmented Generation (RAG)-based chatbot and a modern Strands-based agentic system that uses the Strands Agents SDK with EKS MCP Server integration for direct EKS API access.
- Telemetry collection and storage: Collecting telemetry from various sources and storing it as vector embeddings in Amazon OpenSearch (RAG approach) or as 1024-dimensional embeddings in Amazon S3 Vectors (Strands approach).
- Interactive troubleshooting interface: Building either a web-based chatbot that retrieves relevant telemetry and injects it into LLM prompts, or a Slack integrated multi-agent system that uses MCP tools for real-time Kubernetes diagnostics.
For this architecture walkthrough, we focus on the RAG-based approach. The first step is setting up a pipeline that can reliably collect, process, and store telemetry data. This pipeline aggregates telemetry from the relevant data sources, such as application logs, kubelet logs, and Kubernetes events. In Kubernetes environments, this can be done with a telemetry processor and forwarder, such as Fluent Bit, which streams telemetry into Amazon Kinesis Data Streams. On the receiving end, we use a Lambda function to normalize collected data, Amazon Bedrock to generate vector embeddings, and OpenSearch Serverless to store this embedded representation for efficient retrieval. Because these services are serverless, we can avoid the overhead of managing infrastructure and can focus on the troubleshooting workflow itself.
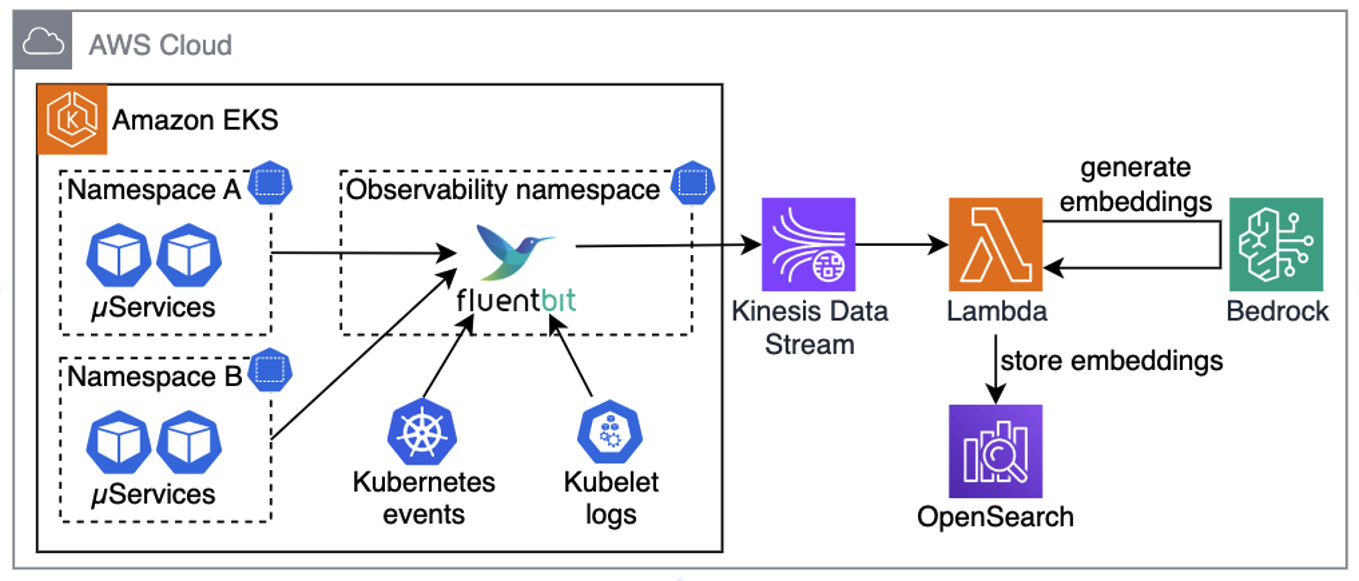 Figure 2. Collecting telemetry from sources, generating embeddings, and saving in OpenSearch
Pro tip: for better performance and cost-efficiency, your Lambda functions should use batching when ingesting data from Kinesis, generating embeddings, and storing them in OpenSearch.
Once telemetry is collected, converted to embeddings, and stored in OpenSearch, the next step is building a chatbot that uses RAG. Using RAG means that when a user asks a question, the chatbot looks up semantically similar telemetry in OpenSearch, adds it to the prompt, and sends it to the LLM. Instead of generic answers, the model now has relevant telemetry and cluster-specific details it can use to generate useful next steps, such as precise kubectl commands for the troubleshooting assistant, as illustrated in the following diagram.
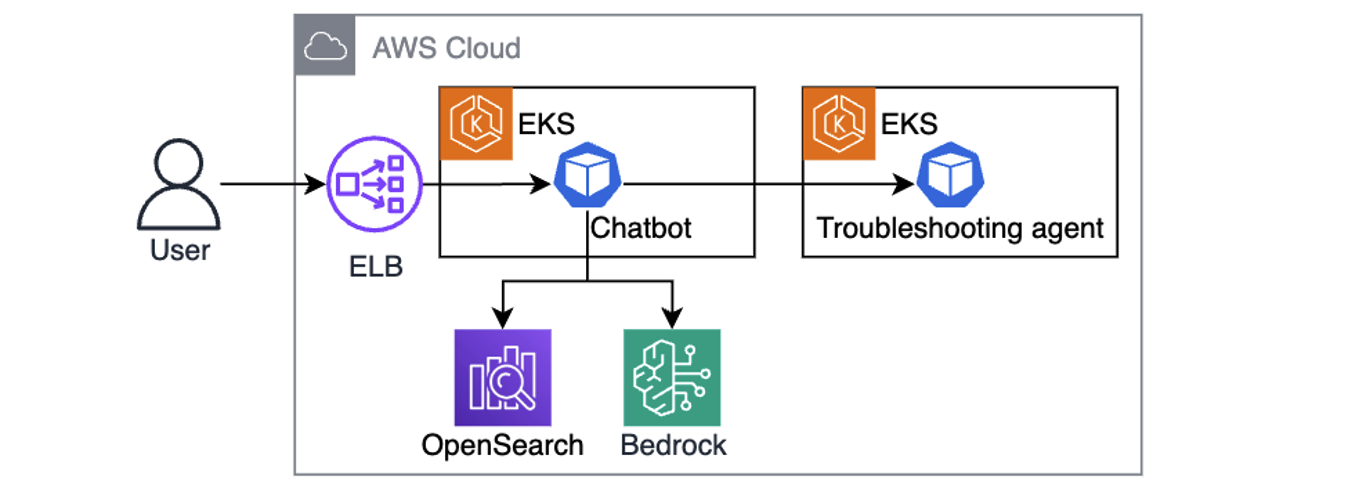 Figure 3. Chatbot is using user queries augmented with telemetry context to send kubectl commands to the troubleshooting assistant.
One powerful aspect of this design is its iterative nature. The chatbot hands instructions to a troubleshooting assistant running in the cluster, which executes a set of allowlisted, read-only kubectl commands. The output comes back to the LLM, which can decide whether it needs to investigate further (by asking the troubleshooting assistant to run more kubectl commands), or present a clear resolution path to the engineer. This cycle gradually builds a richer picture of the issue by combining historical telemetry with real-time cluster state to speed up root cause analysis.
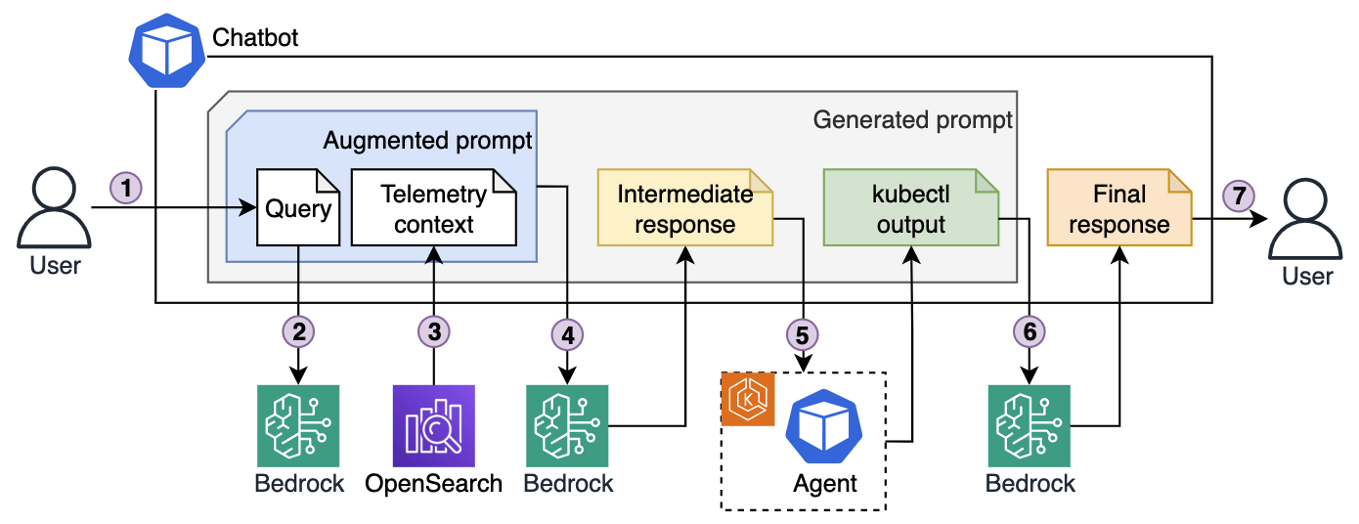 Figure 4. Iterative troubleshooting process.
Here’s the end-to-end troubleshooting flow illustrated in the preceding diagram:
- An engineer enters a query into the chatbot interface, for example “My pod is stuck in pending state. Investigate.”
- The chatbot sends the query to Bedrock, which converts it into vector embeddings.
- Using those embeddings, the chatbot retrieves semantically matching telemetry that was previously stored in OpenSearch.
- The chatbot generates an augmented prompt, which contains both the original query and semantically relevant telemetry, and passes it to the LLM. The LLM responds with a list of kubectl commands to run for further diagnostics.
- The chatbot forwards those commands to the troubleshooting assistant running in the EKS cluster. The agent executes them with a service account that has read-only permissions, following the principle of least privilege, and sends the output back.
- Based on the output, the chatbot asks LLM to decide whether to continue investigation (by asking the agent to run more commands), or whether it has enough context to produce an answer.
- Once enough information has been gathered (investigation concluded), the chatbot composes a final prompt, including the query, telemetry, and investigation results, and asks the LLM for a final resolution, which it then returns to the engineer.
Example implementation
Use the example repo to deploy the solution in your AWS account. Follow the instructions in README.md for provisioning and testing the sample project using Terraform. Resources provisioned by the example project incur costs in your AWS account. Make sure to clean up the project as described in the README.md to avoid unexpected costs.
The repository provides two deployment architectures controlled by the deployment_type Terraform variable:
- RAG-based deployment (default): See the
./terraform/modulesdirectory for the “ingestion-pipeline” module that creates a Kinesis Data Stream and Lambda function to generate embeddings using"amazon.titan-embed-test-v2:0"and store them in OpenSearch. The “agentic-chatbot” module handles the Gradio web interface and kubectl command execution. - Strands agentic deployment: this approach uses the Strands Agents SDK to create a multi-agent system with three specialized agents:
- Agent Orchestrator: Coordinates troubleshooting workflows
- Memory Agent: Manages conversation context and historical insights
- K8s Specialist: Handles Kubernetes diagnostics
The agentic system stores knowledge as 1024-dimensional embeddings in Amazon S3 Vectors, providing cost-optimized vector storage for AI agents. EKS MCP Server integration enabled direct EKS API access through standardized MCP tools located in ./apps/agentic-troubleshooting/src/tools/. Engineers interact via Slack bot integration, where the Strands agents can execute kubectl commands through the MCP protocol while maintaining Pod Identity security for AWS service access.
The following screenshot shows an example chatbot response to a query about a pod being stuck in pending state. The assistant generated and ran multiple kubectl commands to build the output and came up with recommendations for issue remediation.
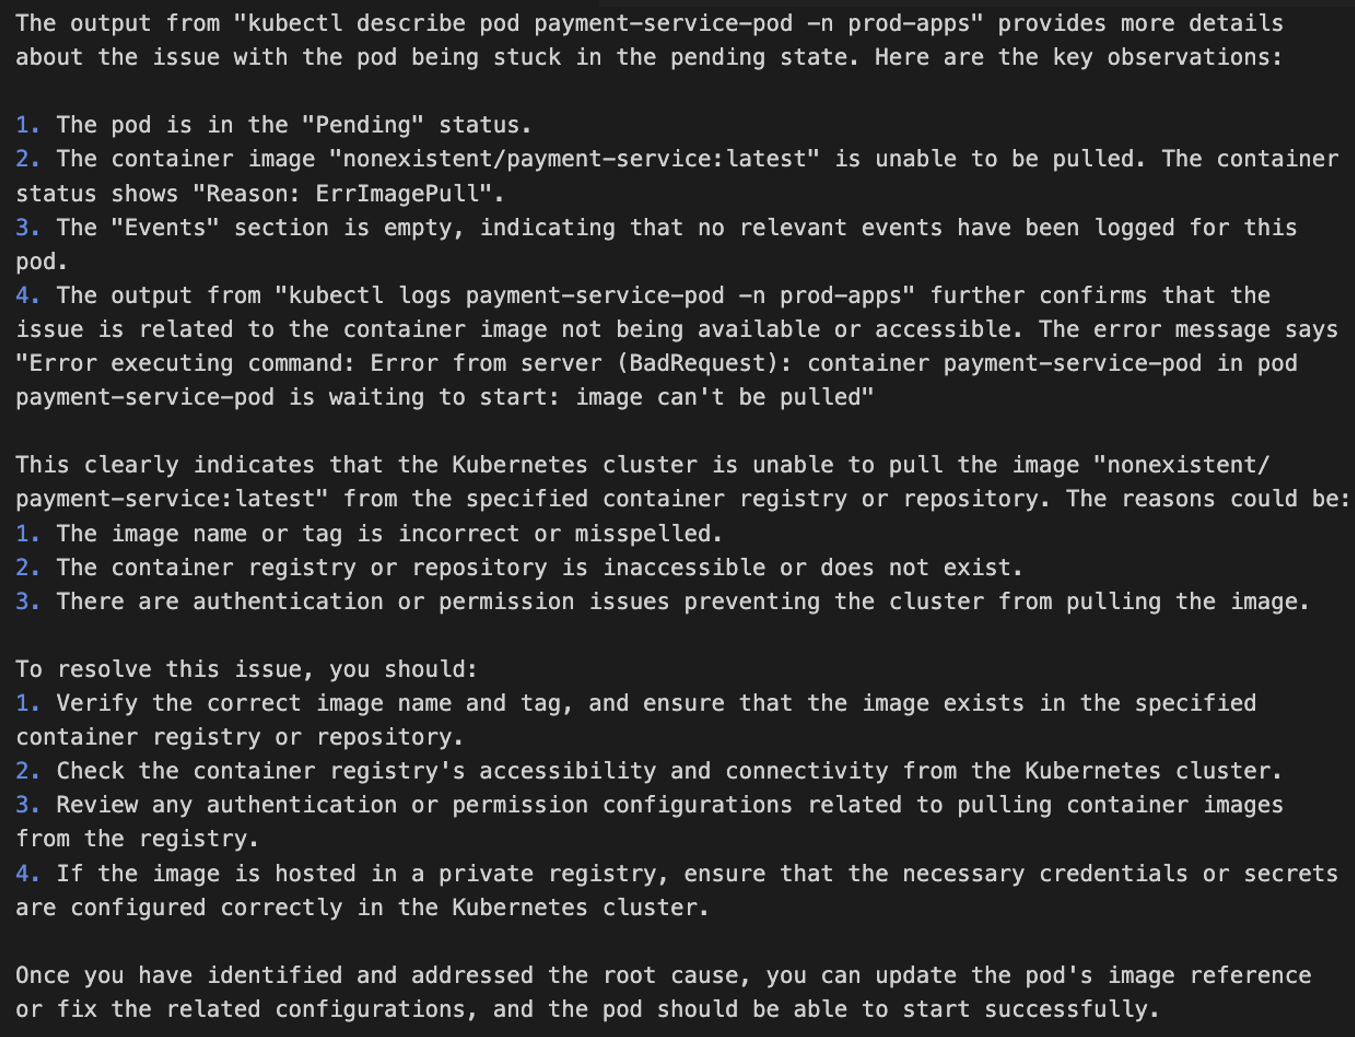 Figure 5. EKS cluster troubleshooting, example output
See AWS re:Invent 2025 – Streamline Amazon EKS operations with Agentic AI and KubeCon – From Logs To Insights: Real-time Conversational Troubleshooting for Kubernetes with GenAI sessions for a deeper dive into solution implementation.
Security considerations
When implementing AI agents for Kubernetes environments, security must be a primary consideration throughout the architecture. The solution requires secure communication channels between the chatbot and EKS clusters, with interactions authenticated through AWS Identity and Access Management (AWS IAM) roles.
Permissions-wise, command execution security is critical. Implementing strict allowlists that only allow read-only kubectl operations to help prevent unauthorized cluster modifications while maintaining diagnostic capabilities. The troubleshooting assistant should also operate with minimal Kubernetes RBAC permissions, limited to viewing pods, services, events, and logs within specific namespaces.
Data protection measures must include sanitizing application logs before embedding generation to help prevent sensitive information exposure, encrypting the telemetry data in transit through Kinesis and at rest in OpenSearch using AWS Key Management Service (AWS KMS).
Follow the AWS Well-Architected Framework Security Pillar principles, deploy components within Amazon Virtual Private Cloud (Amazon VPC) using private subnets and VPC endpoints to minimize network exposure, implement comprehensive logging of troubleshooting activities for audit purposes, and validate user inputs to protect against prompt injection attacks that could manipulate the AI assistant’s behavior.
Conclusion
In this post, we walked through how to architect a generative AI-powered troubleshooting assistant that gives engineers a way to solve Kubernetes issues in a self-service way, without always needing service experts to step in. By combining telemetry analysis with AI-driven context, engineers can get to the root causes faster and keep MTTR low. Assistant’s ability to pull from multiple telemetry sources, run safe diagnostic commands, and provide actionable recommendations helps to make the troubleshooting process more efficient and less disruptive to ongoing work.
As distributed systems continue to grow in scale and complexity, solutions like the one described in this post become essential. Putting AI on top of your observability data helps to practically handle these challenges today, while also setting you up for more autonomous, resilient operations in the future.