- Cloud Operations›
- Transformation›
- Features
Features
Find root cause of issues in a fraction of the time
Start troubleshooting your operational issues from many entry points - by selecting the Investigate action on any Amazon CloudWatch data widget across the AWS Management Console, configuring to auto-trigger from a CloudWatch alarm, or initiating from an Amazon Chime chat.

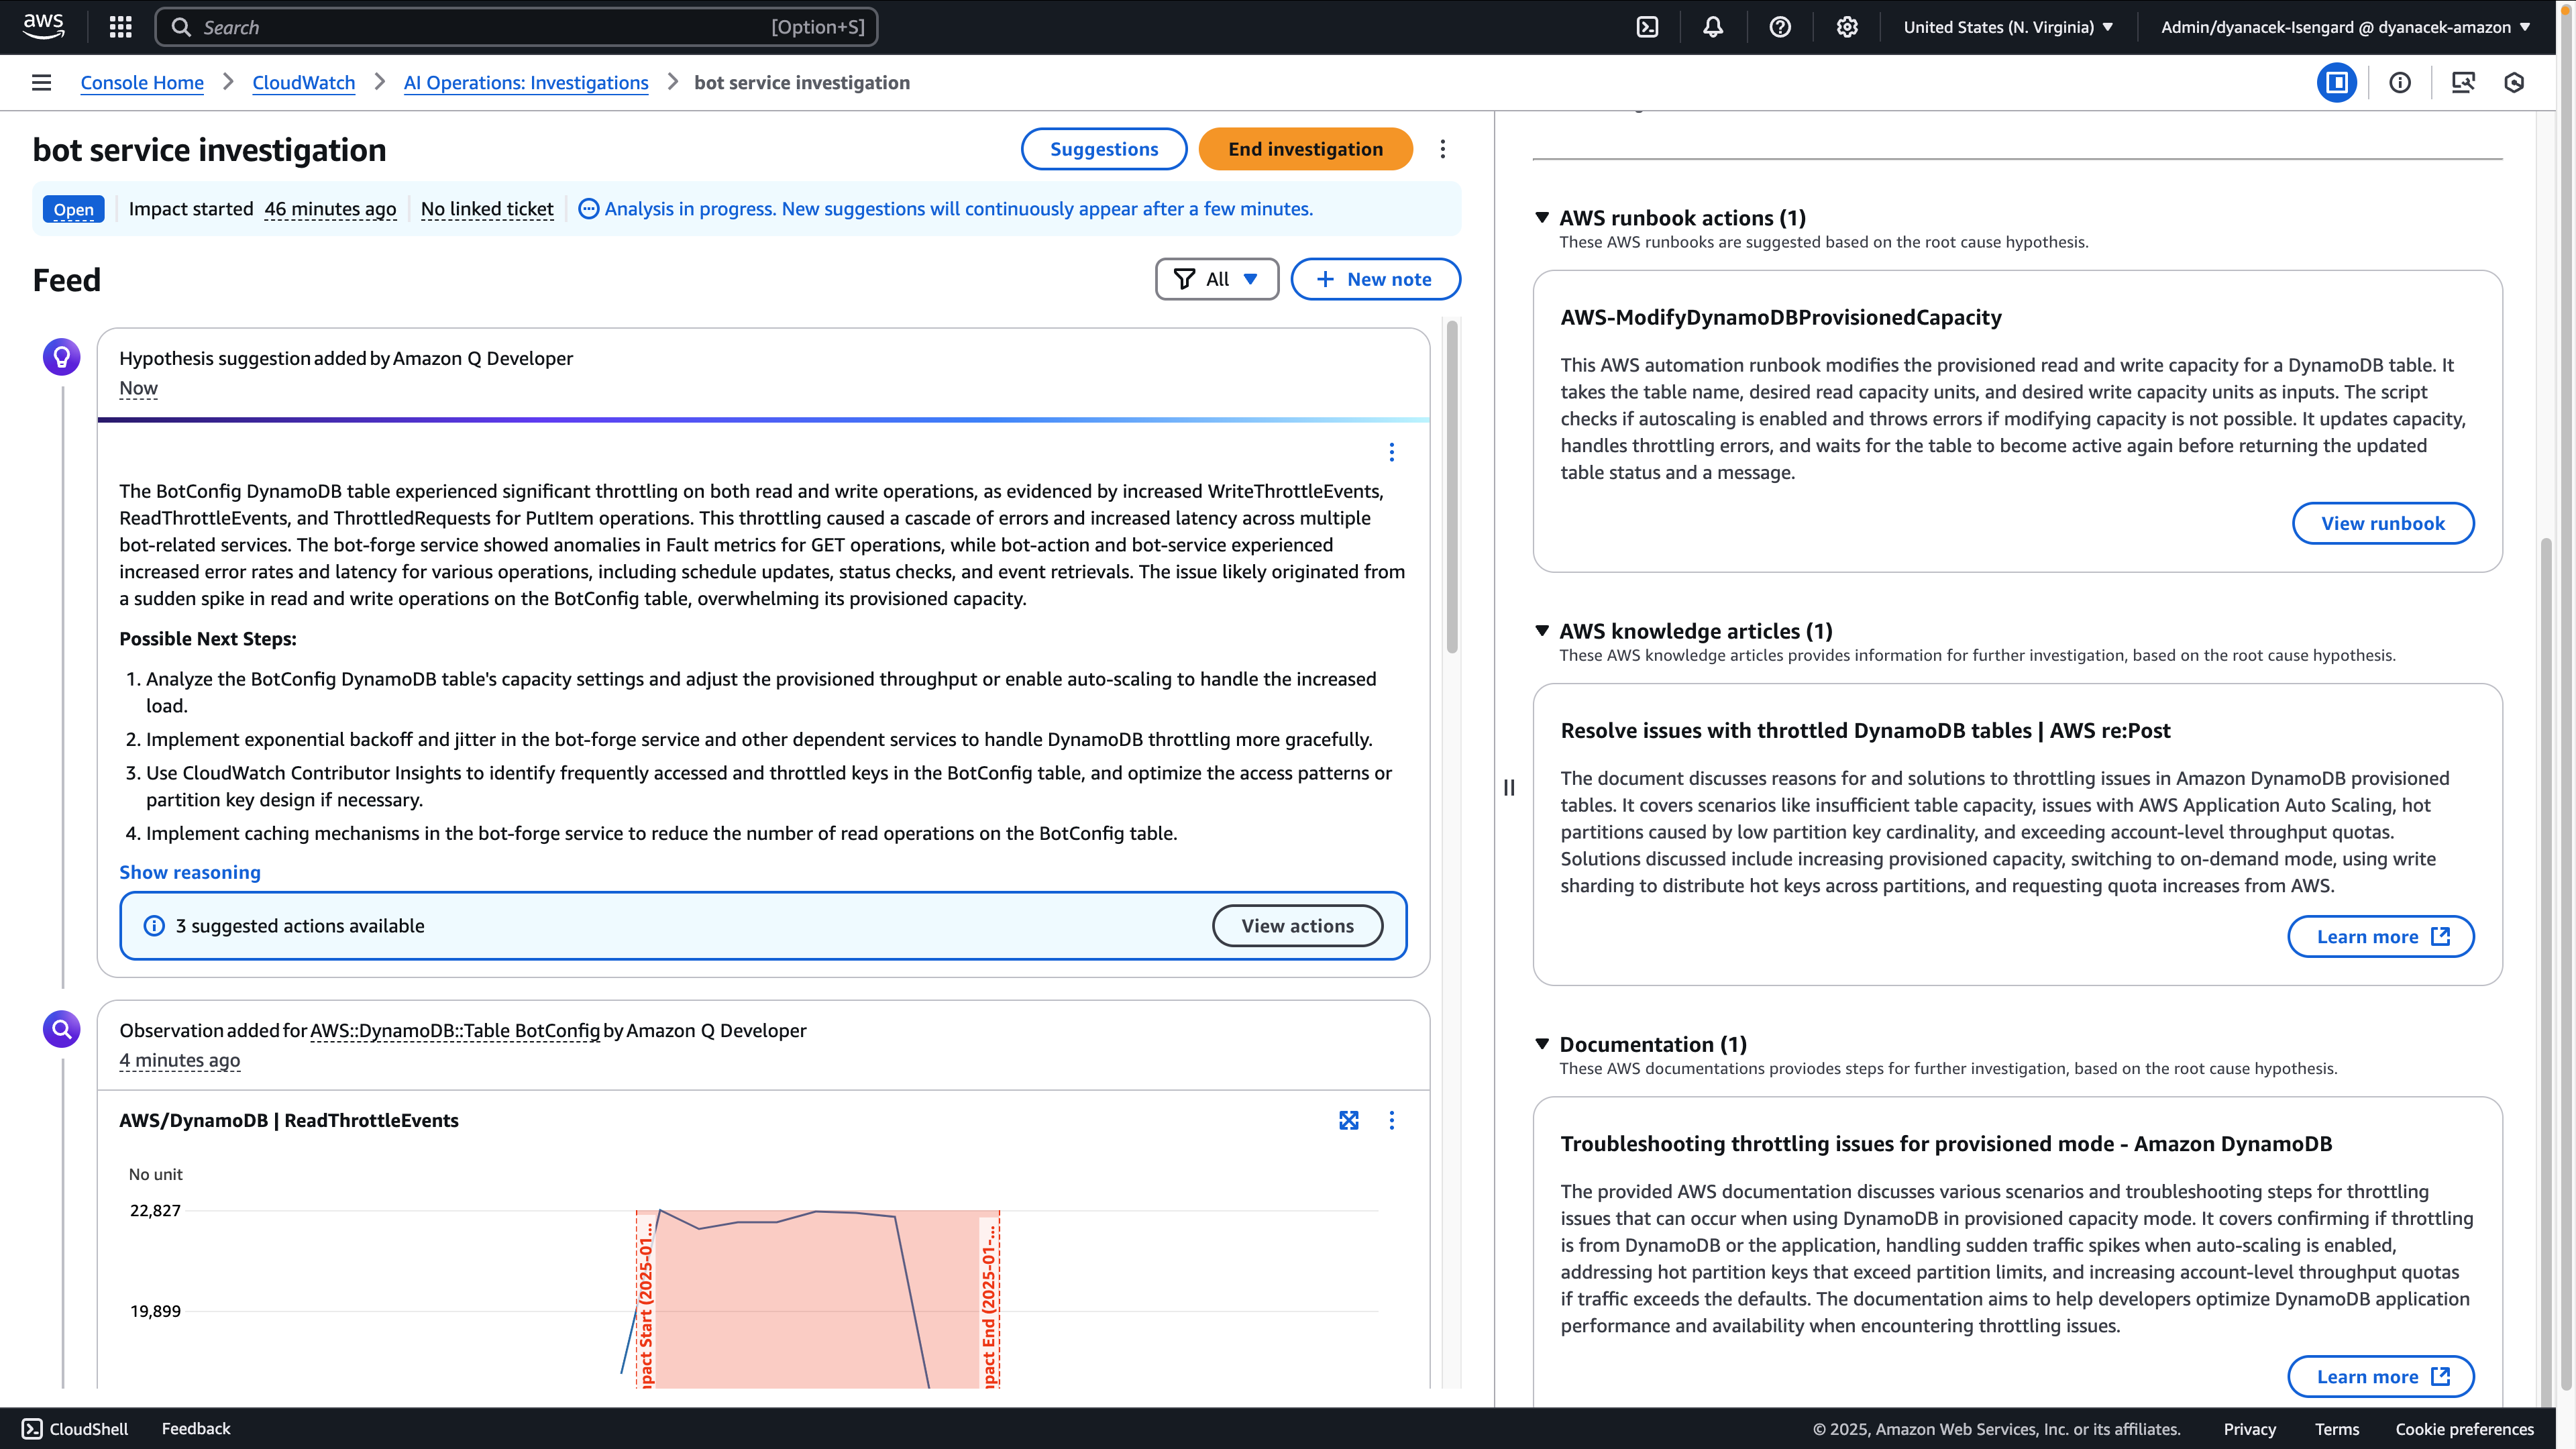
Quickly resolve operational issues using remediation suggestions
Amazon CloudWatch suggests remediation actions for common AWS issues by surfacing relevant AWS Systems Manager Automation runbooks, AWS re:Post articles, and documentation. Fill in key parameters and review runbook contents prior to running the runbook to resolve the issue so you can get your business-critical application back to fully operational quickly.
Transform disparate telemetry into real-time insights
Easily understand the relationships between your AWS resources and their related telemetry so you can correlate infrastructure resources to your workloads. Amazon CloudWatch automatically reveals relationships between your AWS resources and workloads through an interactive topology map, transforming scattered telemetry into actionable insights with clear navigation paths to related data.

Drill into telemetry using one topology map
Navigate seamlessly from high-level service views to individual resource metrics through an interactive topology map that maintains system- wide context. This intuitive interface eliminates the need to switch between consoles or sift through large volumes of telemetry.

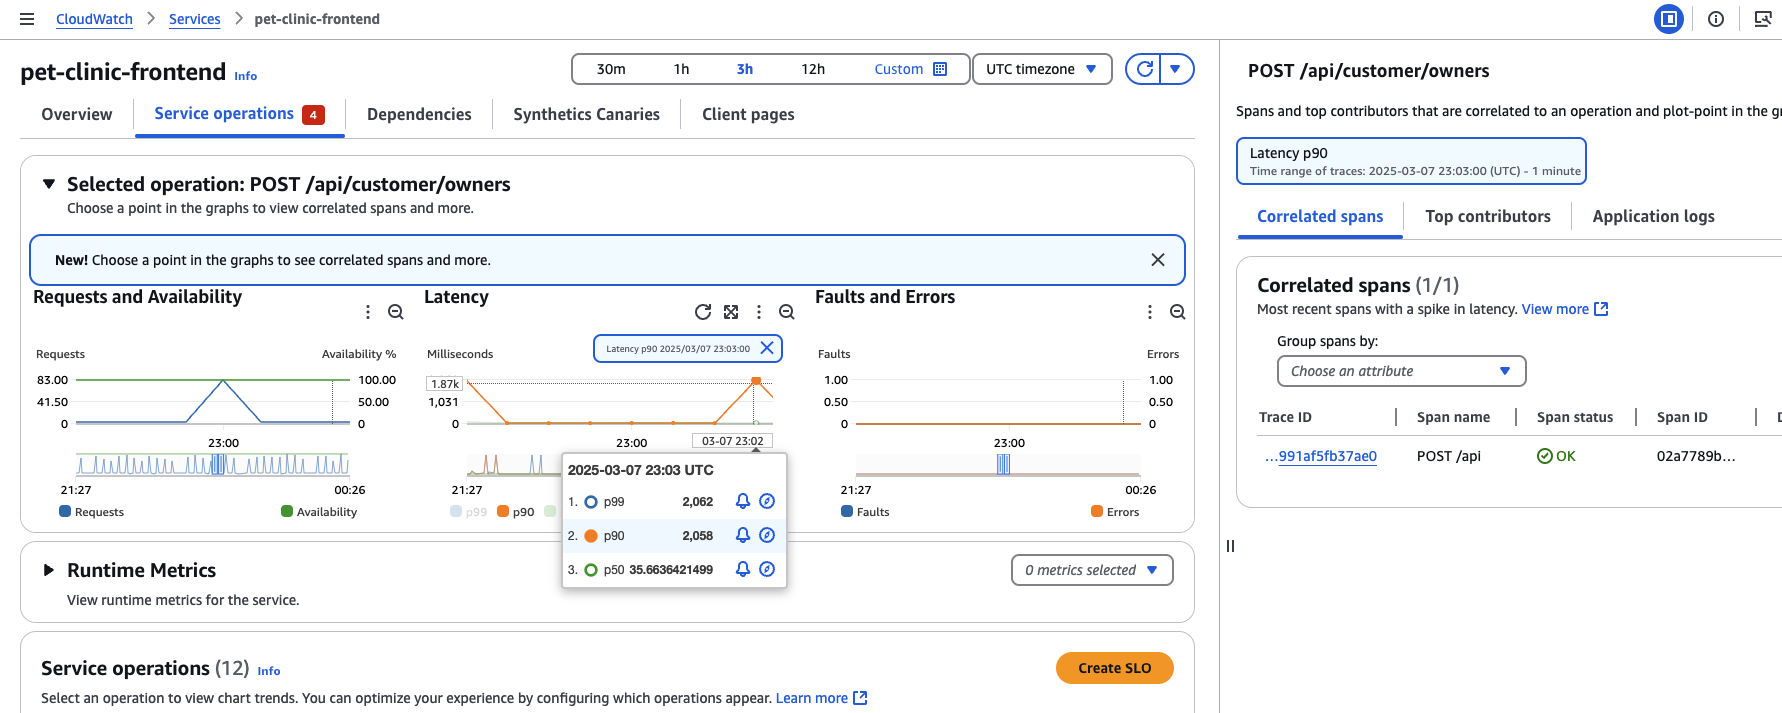
Uncover application signals in APM
Quickly identify and resolve application issues through a unified view of your applications and related AWS resources. View critical performance metrics across services in one unified console. Drill down from anomalies to correlated traces with a single click, streamlining troubleshooting and reducing resolution time.
Analyze application transactions at any scale
Find and resolve end-user transaction issues faster with Amazon CloudWatch Application Signals Transaction Search. Get complete visibility into your application spans and transactions – seeing every step from placing an order to completing a purchase – with detailed visual analytics. You can monitor and troubleshoot how users interact with different parts of your applications using span analysis.

Expand your operational and security analytics
Amazon OpenSearch Service customers can analyze Amazon CloudWatch Logs directly without data duplication, reducing cost and complexity. Easily search, analyze and visualize security data across your AWS environment without complex engineering or data movement. Amazon OpenSearch Service adds powerful search and analytics capabilities to Amazon Security Lake data so you can investigate threats and monitor security posture all from a single unified view.

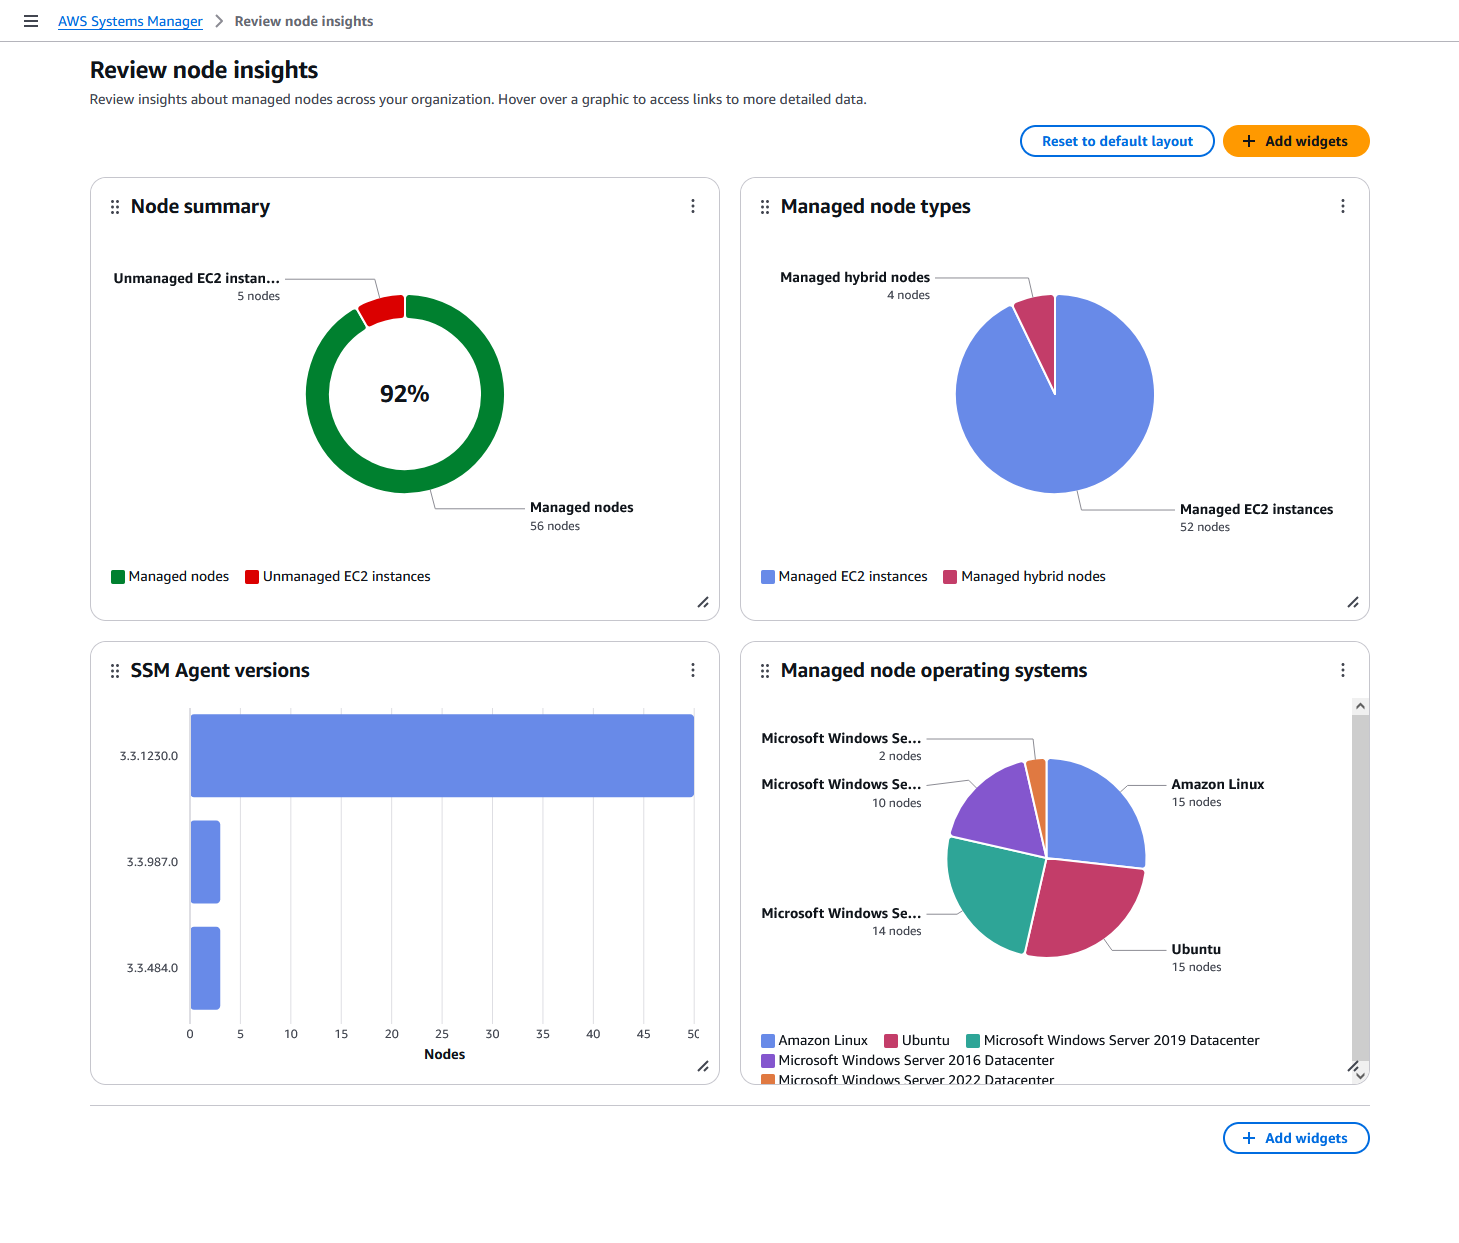
See all managed and unmanaged nodes
Get complete visibility across your organization's AWS accounts and Regions through a centralized delegated administrator account. View comprehensive node information including instance details, OS data, installed agents, and tags.
Simplify node management
Scale your node management effortlessly with automated SSM Agent installation and maintenance. Schedule recurring diagnostic checks to identify agent issues like network misconfigurations and outdated software, then resolve them smoothly using pre-defined runbooks.
