AWS Storage Blog
Faster threat detection at scale: Real-time cybersecurity graph analytics with PuppyGraph and Amazon S3 Tables
Modern cybersecurity teams are facing unprecedented challenges in data analysis by the scale, complexity, and velocity of data. Cloud environments continuously generate massive amounts information in form of access logs, configuration changes, alerts, and telemetry. Traditional analysis methods of looking at these data points in isolation can’t effectively detect threats such as lateral movement and privilege escalation in this data.
Security solutions such as Security Information and Event Management (SIEM), Cloud Security Posture Management (CSPM), and cloud workload protection need relationship-based analysis. It’s not just about a login attempt or a policy change—it’s about who did it, what systems were involved, which privileges were active, and what followed next. These relationship-driven questions are hard to answer with traditional event-based analysis alone. Graph analysis offers an efficient solution for processing data, particularly when dealing with complex relationships. The conventional approach involves storing data in a data lake or lakehouse and building a business model before beginning analysis.
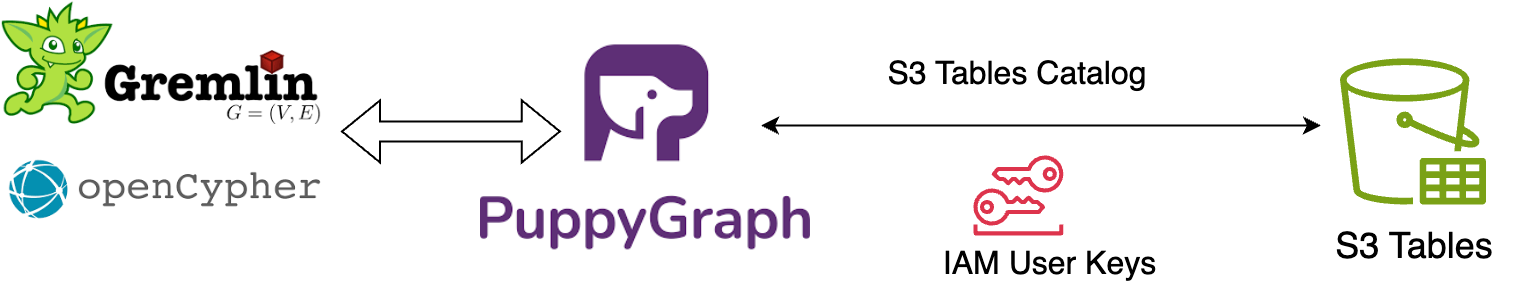
That’s where the combination of Amazon S3 Tables and PuppyGraph changes the game. Together, they enable real-time graph analytics directly on your security data lake—without ETL or data duplication. This post shows how this zero-ETL stack powers threat detection at scale, using data already stored in your Iceberg-backed S3 Tables and graph queries powered by openCypher or Gremlin.
Why S3 Tables are ideal for cybersecurity data
S3 Tables is a managed Amazon Web Services (AWS) service that stores data in Apache Iceberg format. It provides a robust foundation for storing and analyzing cybersecurity data, such as logs, telemetry, and threat intelligence. Its combination of performance, flexibility, and integration capabilities makes it ideal for critical security tasks such as threat detection, forensic investigation, and compliance.
Providing better metadata management, more flexible evolution of data structures, and optimizations for modern cloud-based analytics environments means that Iceberg allows for faster queries, more efficient storage use, and maintenance of large, complex large-scale datasets. Features such as metadata indexing and partition pruning allow security teams to scan massive logs to isolate suspicious events. Schema evolution makes sure that log formats can change over time—whether due to new threat indicators or updated sources—without breaking existing queries or analysis pipelines.
As a managed service, S3 Tables streamline operations while meeting the scale and security demands of cybersecurity workloads. They inherit the durability and availability of Amazon S3, scaling seamlessly to support years of retained logs and growing telemetry volumes. Automated maintenance tasks such as compaction and cleanup preserve fast query performance over time, while encryption and access controls provide built-in protection and regulatory alignment.
S3 Tables also integrate seamlessly with the broader AWS analytics stack. Services such as Amazon Athena and Amazon Redshift allow teams to query data directly for investigations or compliance audits, while AWS Lake Formation enables centralized access governance. This native interoperability allows S3 Tables to become more than just storage—they serve as a live, query-ready foundation for security analytics pipelines across the AWS environment.
Why graph analytics for security?
Security investigations often rely on understanding how entities relate to one another. These relationships might include users and their assigned roles, roles and the resources they govern, alerts tied to specific hosts, or the progression of access across multiple systems. Traditional SQL queries struggle to represent these connections, especially when they involve several layers of indirection or changing privilege structures. As cloud environments become more complex, so do the potential pathways that attackers can exploit.
Graph analytics addresses this challenge by representing security data as a connected structure of entities and relationships. This model allows you to ask questions such as:
- Which users have indirect access to a sensitive system?
- How lateral movement could occur between assets?
- What’s the full path of this privilege escalation?
- Are there clusters of lateral movement between services?
Query languages such as openCypher and Gremlin are designed to express these patterns intuitively, and they often outperform multi-join SQL queries when navigating complex relationships.
Viewing your data as a graph brings clarity to the way access, identity, and infrastructure interact. It helps uncover hidden access paths, evaluate the potential impact of a compromise, and focus investigation efforts where risk is highest. Graph modeling also supports proactive defense by allowing analysts to explore the same routes an attacker might take before any damage is done.
Query graphs directly on S3 Tables—no ETL needed
PuppyGraph connects directly to S3 Tables through the s3tablescatalog in AWS Glue Data Catalog, allowing users to run graph queries on Iceberg tables without copying, transforming, or migrating data. Defining a graph schema allows users to model existing datasets stored in S3 Tables buckets as vertices and edges.
This architecture eliminates the complexity and overhead typically associated with a traditional graph database. Queries run directly on the underlying Iceberg tables, with no ETL process and no data duplication. Results are returned in near real time, even at large scale, because PuppyGraph uses the S3 Tables built-in optimizations, such as partition pruning and snapshot isolation. The result is a clear, low-latency, and storage-efficient approach to deriving relationship-based insights from tabular datasets already stored in Amazon S3.
Real-world use case: build a SIEM graph on S3 Tables
Security teams rely on SIEM solutions to detect and investigate threats, but understanding attacker behavior often needs more than isolated log events. The challenge lies in uncovering how events relate. This necessitates tracking which users accessed which services, whether privilege escalation occurred, and what sequence of actions followed. This is where graph analytics makes the difference.
This demo shows how to build a SIEM-like investigation graph directly on S3 Tables using PuppyGraph. We use a public dataset of anonymized AWS CloudTrail logs from flaws.cloud, a security training environment created by Scott Piper. It contains 1.9 million events simulating realistic attack scenarios in AWS—ideal for modeling real-world threat investigations.
Turning CloudTrail logs into a graph allows us to connect users, roles, API calls, IP addresses, and resources. This allows security analysts to ask natural, high-value questions such as:
- What sequence of actions led to a specific privilege escalation?
- Which users accessed a resource either directly or indirectly through assumed roles?
- Are there lateral movement paths that cross organizational boundaries or sensitive services?
These kinds of questions are difficult to express or maintain in SQL, but natural in graph query languages such as openCypher or Gremlin.
Viewing your data as a graph brings clarity to the way access, identity, and infrastructure interact. It helps uncover hidden access paths, evaluate the potential impact of a compromise, and focus investigation efforts where risk is highest. Graph modeling also supports proactive defense by allowing analysts to explore the same routes an attacker might take before any damage is done.
Prerequisites
You need an AWS user account with access to S3 Tables to import the dataset. You also need an AWS user account with at least AmazonS3TablesReadOnlyAccess permission to connect to S3 Tables from PuppyGraph. You also need the following tools in this demo:
We prepared the materials of this demo for you in GitHub, such as:
- import_from_json.py: a Python script to import data
- schema.json: the schema JSON file for PuppyGraph to connect to S3 Tables
Make sure to download the files, because they are used later. We also recommend reviewing the S3 Tables User Guide, the PuppyGraph integration guide for S3 Tables, and the connection documentation.
The instructions in this post were created and tested using an Amazon Elastic Compute Cloud (Amazon EC2) instance with 8 vCPU and 16 GB of RAM running Amazon Linux 2023.
Walkthrough
The following steps walk you through this solution.
Data preparation
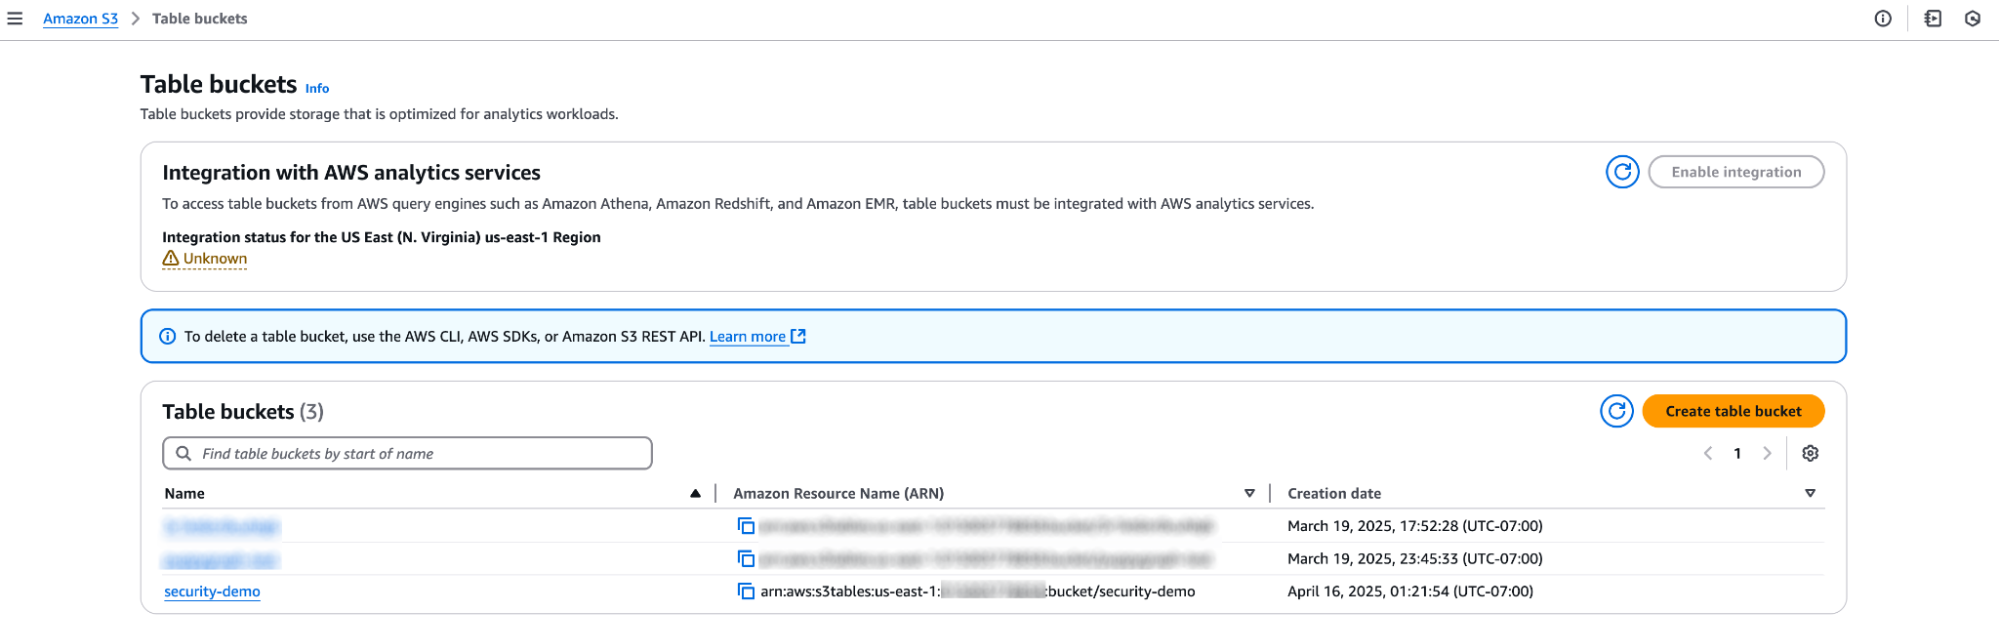
1. Create a table bucket
You can create a table bucket using AWS Management Console from a web browser or use AWS CLI from a terminal.
aws s3tables create-table-bucket \ –region <region> \ –name security-demo ()
 2. Create a namespace called security_graph
aws s3tables create-namespace \
    --table-bucket-arn <table-bucket-arn> \
    --namespace security_graph
3. Stage the CloudTrail logs dataset and import script
Create a directory to host your files
# Create and use a subdirectory
mkdir -p ~/spark-container
cd ~/spark-container
Download and extract the CloudTrail logs in your newly created subdirectory.
wget https://summitroute.com/downloads/flaws_cloudtrail_logs.tar
mkdir -p ./json_data
tar -xvf flaws_cloudtrail_logs.tar --strip-components=1 -C ./json_data
gunzip ./json_data/*.json.gz
Download the import script.
wget https://raw.githubusercontent.com/puppygraph/puppygraph-getting-started/main/use-case-demos/cloudtrail-s3tables-demo/import_from_json.py
4. Import the dataset to S3 Tables using Docker
Use a Docker container with Apache Spark to import the data. This approach makes sure of a consistent environment and streamlines the set up process.
# Run the official Spark docker container and open an interactive shell
docker run -it \
  --name spark-container \
  -p 4040:4040 \
  -v ~/spark-container:/spark-container \
  -w /spark-container \
  -e AWS_ACCESS_KEY_ID=<your-access-key> \
  -e AWS_SECRET_ACCESS_KEY=<your-secret-key> \
  -e AWS_REGION=<region> \
  --user root \
  apache/spark:3.5.1 \
  /bin/bash
Set up the Spark PATH and install the necessary Python packages in your container.
# Add Spark to PATH
export PATH=$PATH:/opt/spark/bin

# Install Python packages
pip install --target=/spark-container/python_libs ijson faker
export PYTHONPATH=/spark-container/python_libs:$PYTHONPATH
Submit a Spark job that imports the CloudTrail logs dataset and inserts the data into S3 Tables. Make sure to adjust the AWS Region and table bucket Amazon Resource Name (ARN) placeholders.
# Run spark-submit
spark-submit \
  --conf "spark.jars.ivy=/spark-container/ivy" \
  --master "local[*]" \
  --packages "org.apache.iceberg:iceberg-spark-runtime-3.5_2.12:1.4.1,software.amazon.awssdk:bundle:2.20.160,software.amazon.awssdk:url-connection-client:2.20.160" \
  --conf "spark.sql.extensions=org.apache.iceberg.spark.extensions.IcebergSparkSessionExtensions" \
  --conf "spark.sql.defaultCatalog=spark_catalog" \
  --conf "spark.sql.catalog.spark_catalog=org.apache.iceberg.spark.SparkCatalog" \
  --conf "spark.sql.catalog.spark_catalog.type=rest" \
  --conf "spark.sql.catalog.spark_catalog.uri=https://s3tables.<region>.amazonaws.com/iceberg" \
  --conf "spark.sql.catalog.spark_catalog.warehouse=arn:aws:s3tables:<region>:<account-id>:bucket/<table-bucket-name>" \
  --conf "spark.sql.catalog.spark_catalog.rest.sigv4-enabled=true" \
  --conf "spark.sql.catalog.spark_catalog.rest.signing-name=s3tables" \
  --conf "spark.sql.catalog.spark_catalog.rest.signing-region=<region>" \
  --conf "spark.sql.catalog.spark_catalog.io-impl=org.apache.iceberg.aws.s3.S3FileIO" \
  --conf "spark.hadoop.fs.s3a.aws.credentials.provider=org.apache.hadoop.fs.s3a.SimpleAWSCredentialProvider" \
  --conf "spark.sql.catalog.spark_catalog.rest-metrics-reporting-enabled=false" \
  --driver-memory 4G --executor-memory 8G \
  import_from_json.py /spark-container/json_data --database security_graph
Type exit to exit the container shell.
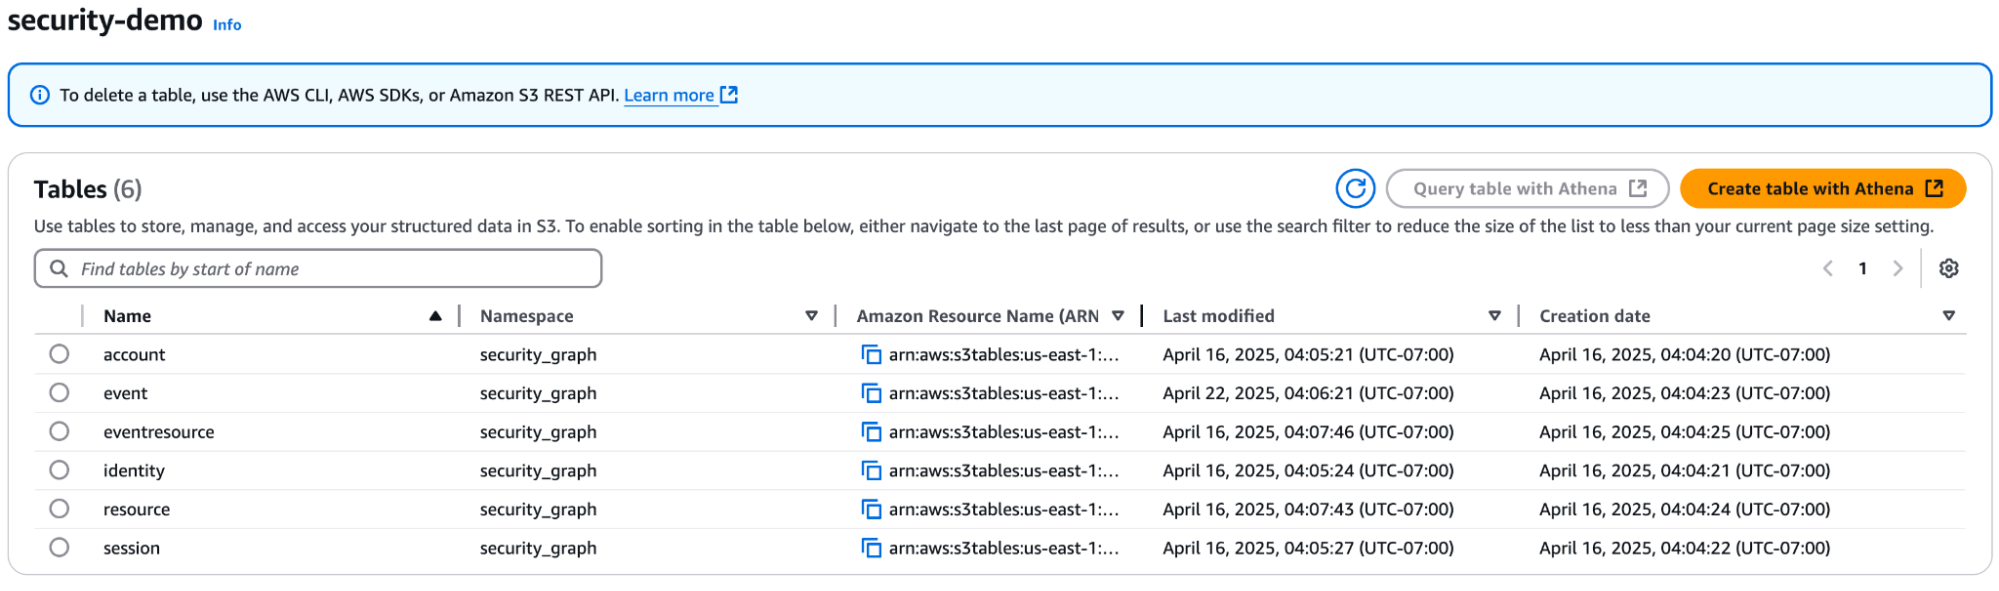
After importing the data, you should see six tables in the table bucket under the namespace security_graph.
5. Stop and remove the Spark container
Clean up the Spark container and temporary files after the import is complete.
docker stop spark-container
docker rm spark-container
rm -rf ~/spark-container
Modeling the graph
1. Update the schema.json file
Before starting PuppyGraph, you need to download and edit the schema.json file. Update the contents with your AWS credentials and modify the warehouse location to reflect your S3 Tables bucket ARN. Following are the lines that you need to edit:
  "accessKey": "<your-access-key>",
  "secretKey": "<your-secret-key>",
  "warehouse": "arn:aws:s3tables:<region>:<account-id>:bucket/<table-bucket-name>"
2. Start PuppyGraph using Docker
Run the following command to start PuppyGraph. You can change PUPPYGRAPH_PASSWORD as desired.
docker run \
  -p 8081:8081 \
  -p 8182:8182 \
  -p 7687:7687 \
  -e PUPPYGRAPH_PASSWORD=puppygraph123 \
  -d --name puppy \
  --rm \
  --pull=always \
  puppygraph/puppygraph:stable
3. Log in to the PuppyGraph Web UI
Navigate to http://localhost:8081 with the following credentials:
- Username: puppygraph
- Password: puppygraph123
4. Upload the schema
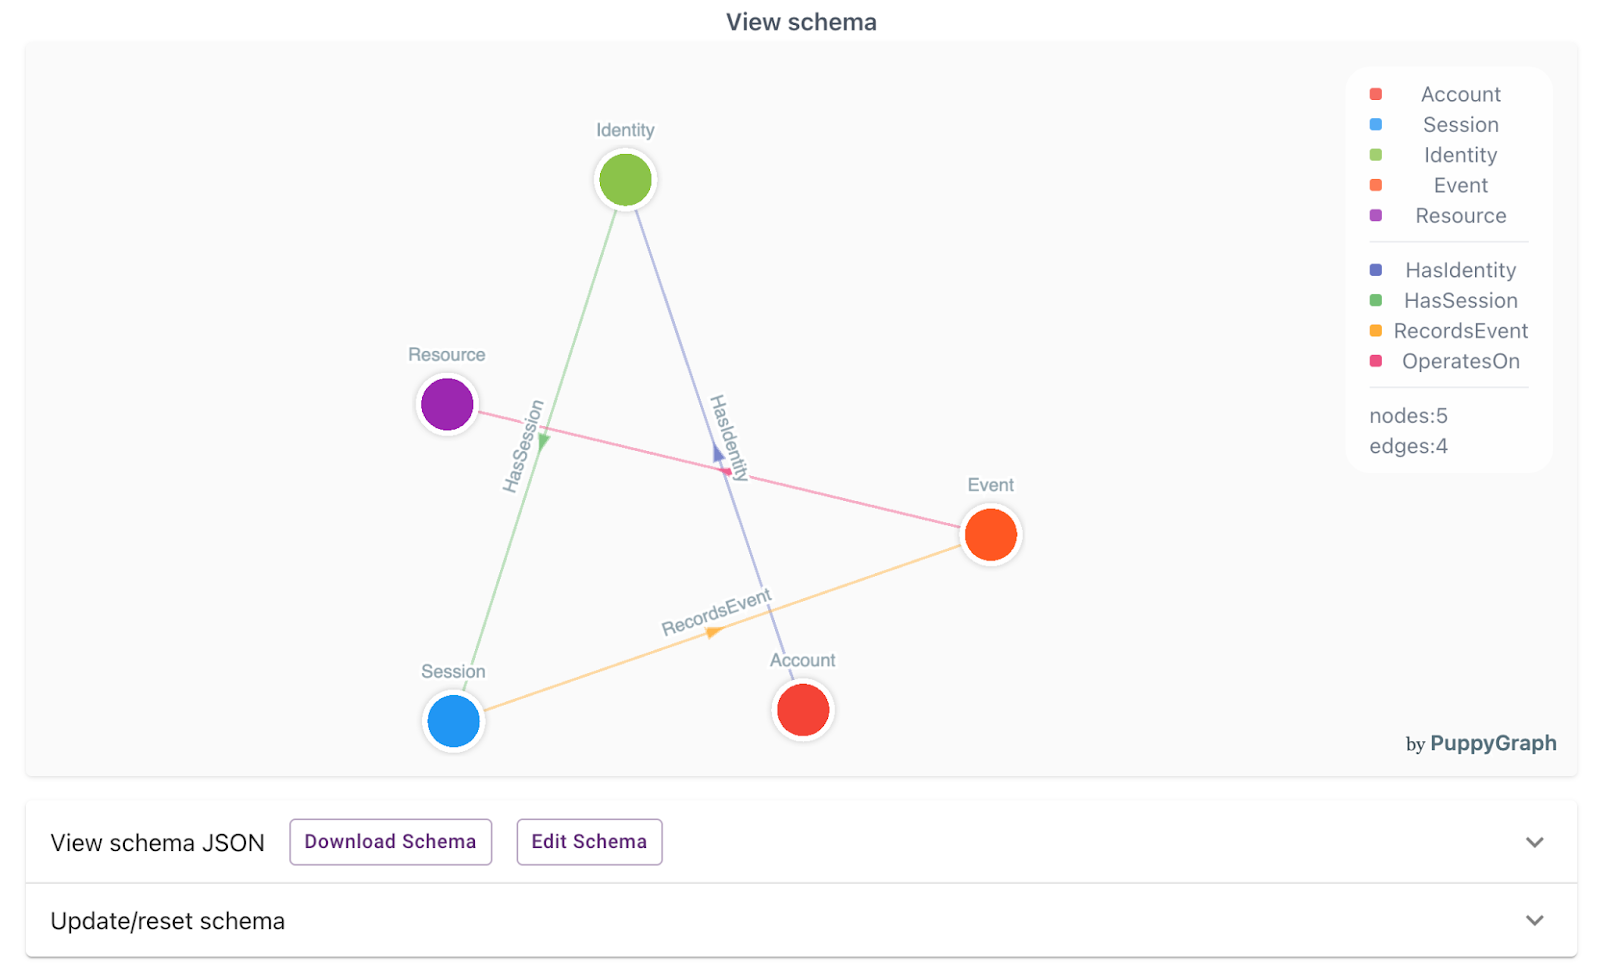
In the section Upload Graph Schema JSON, choose the file schema.json (that you edited in Step 1), and choose Upload.
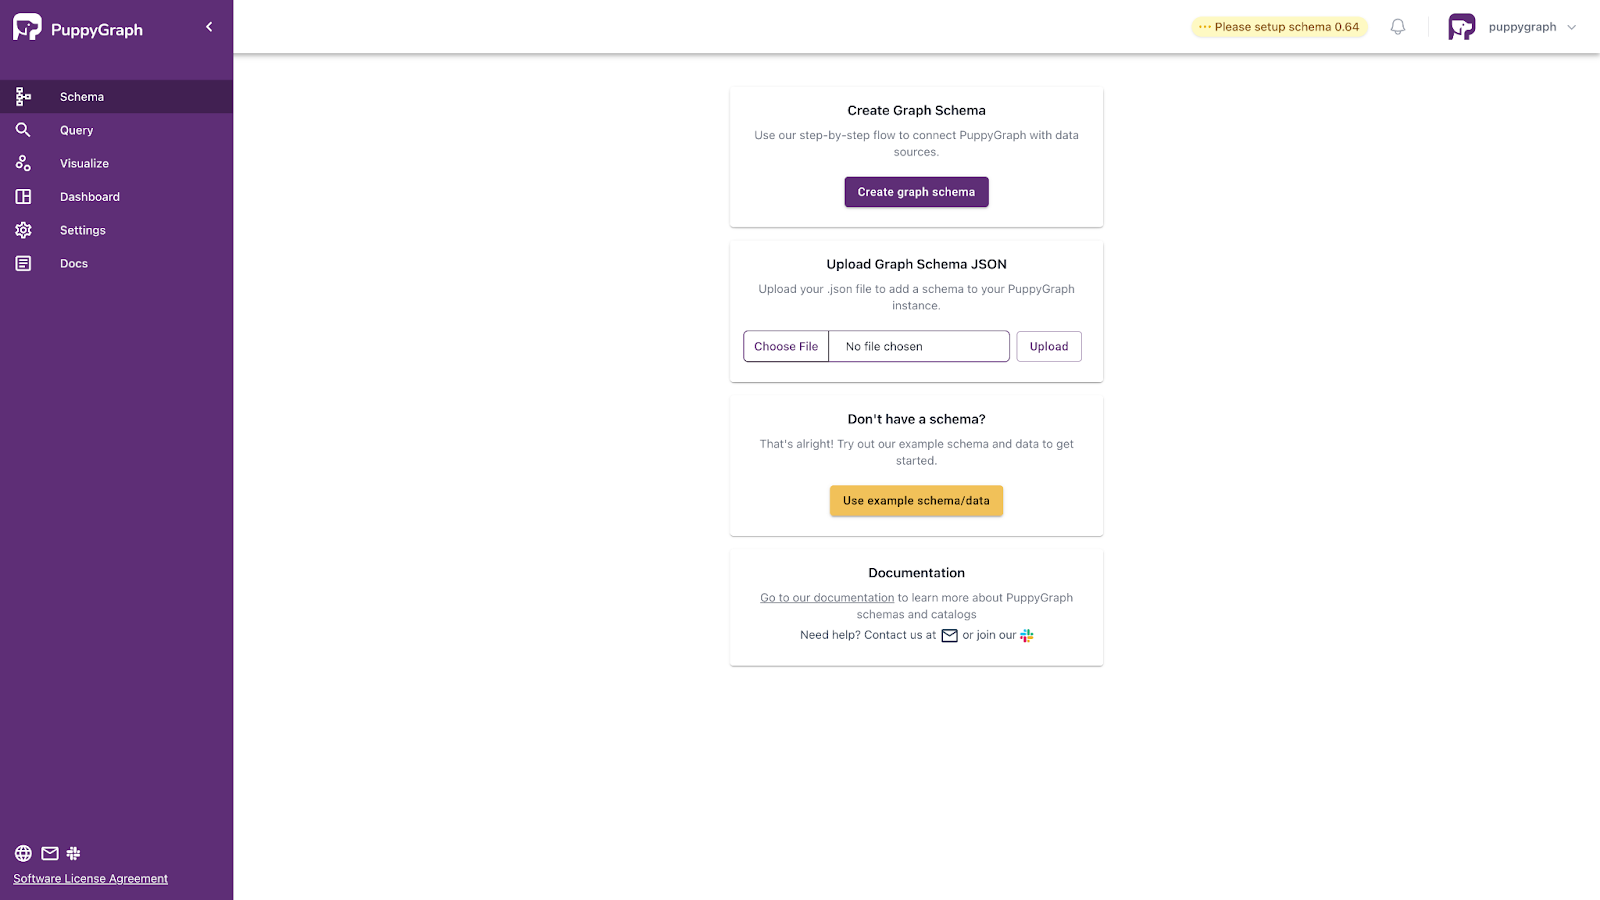
You should see the visualization of the graph model after loading the schema.
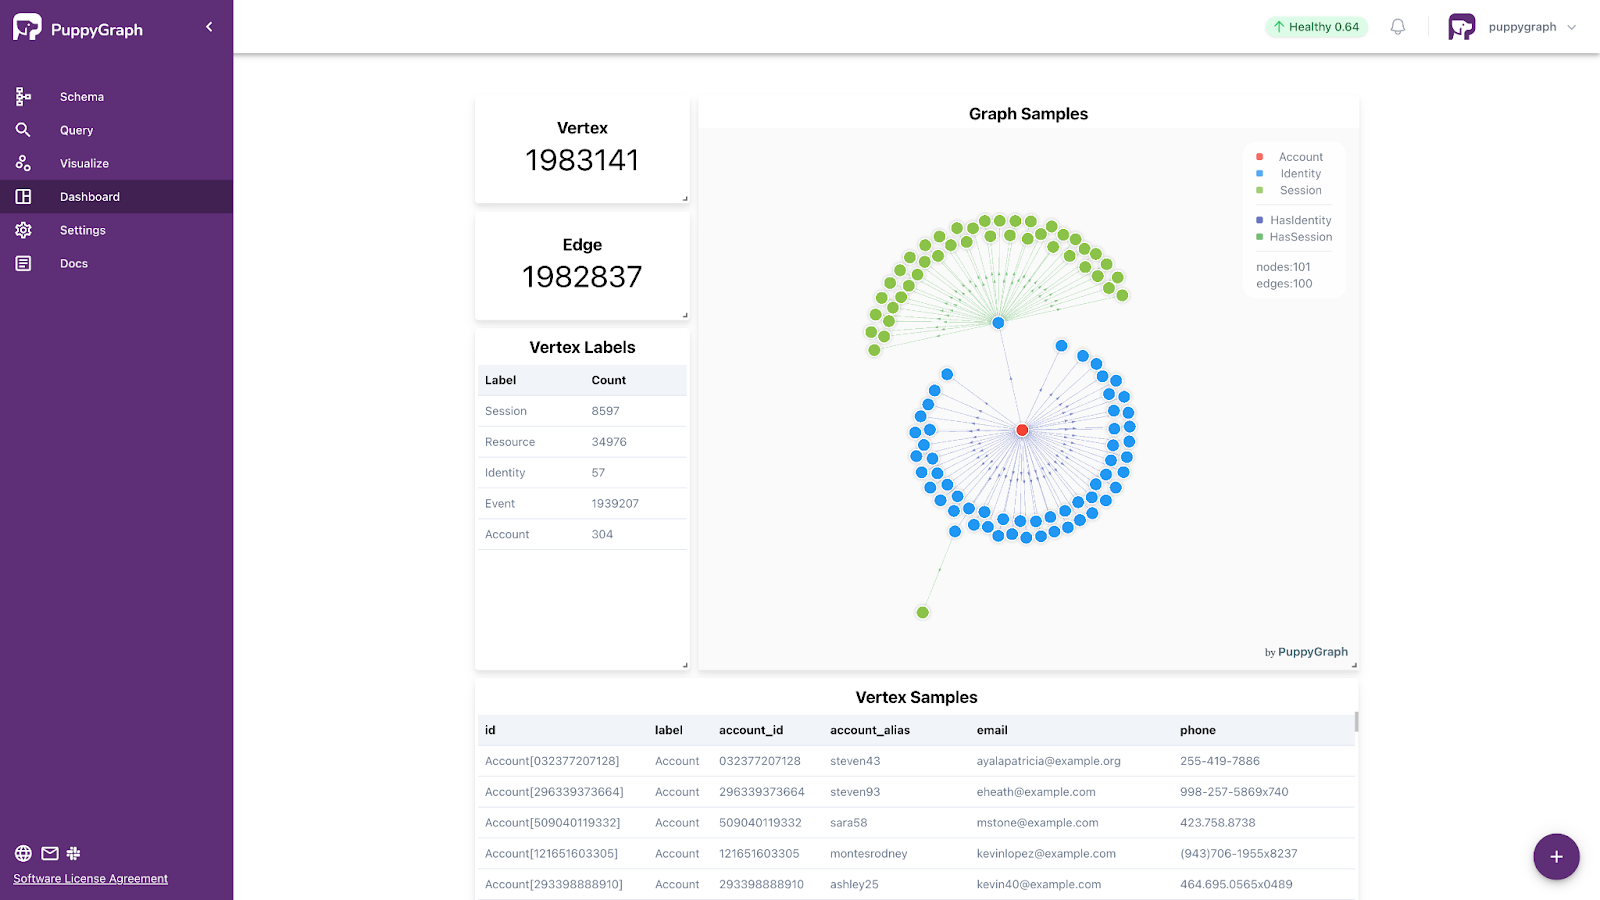
5. View the dashboard
You can also view some basic information about the graph on the Dashboard. You can customize your own dashboard by choosing the plus symbol at the bottom-right to add a query tab, or by choosing an existing tab.
Query the graph
Navigate to the Query panel on the left side. The Graph Query tab provides an interactive space to run queries using both openCypher and Gremlin. This is where graph analytics shines—letting you follow relationships in your data that would be difficult or inefficient to express in SQL.
Before running each query, choose Clear Canvas in the upper right to reset the visualization.
The following are four powerful query examples that demonstrate real-world SIEM use cases—tracking suspicious activity, detecting lateral movement, uncovering privilege escalation paths, and identifying anomalous session behavior.
1. Find the full chain from an account to a resource
Use case: Understand the complete activity flow from an account through its identity and sessions, down to the specific resources on which it operated.
Natural language:
“Show the entire chain of activity starting from an account—what identity it used, which sessions it opened, what events were recorded, and which resources were involved.”
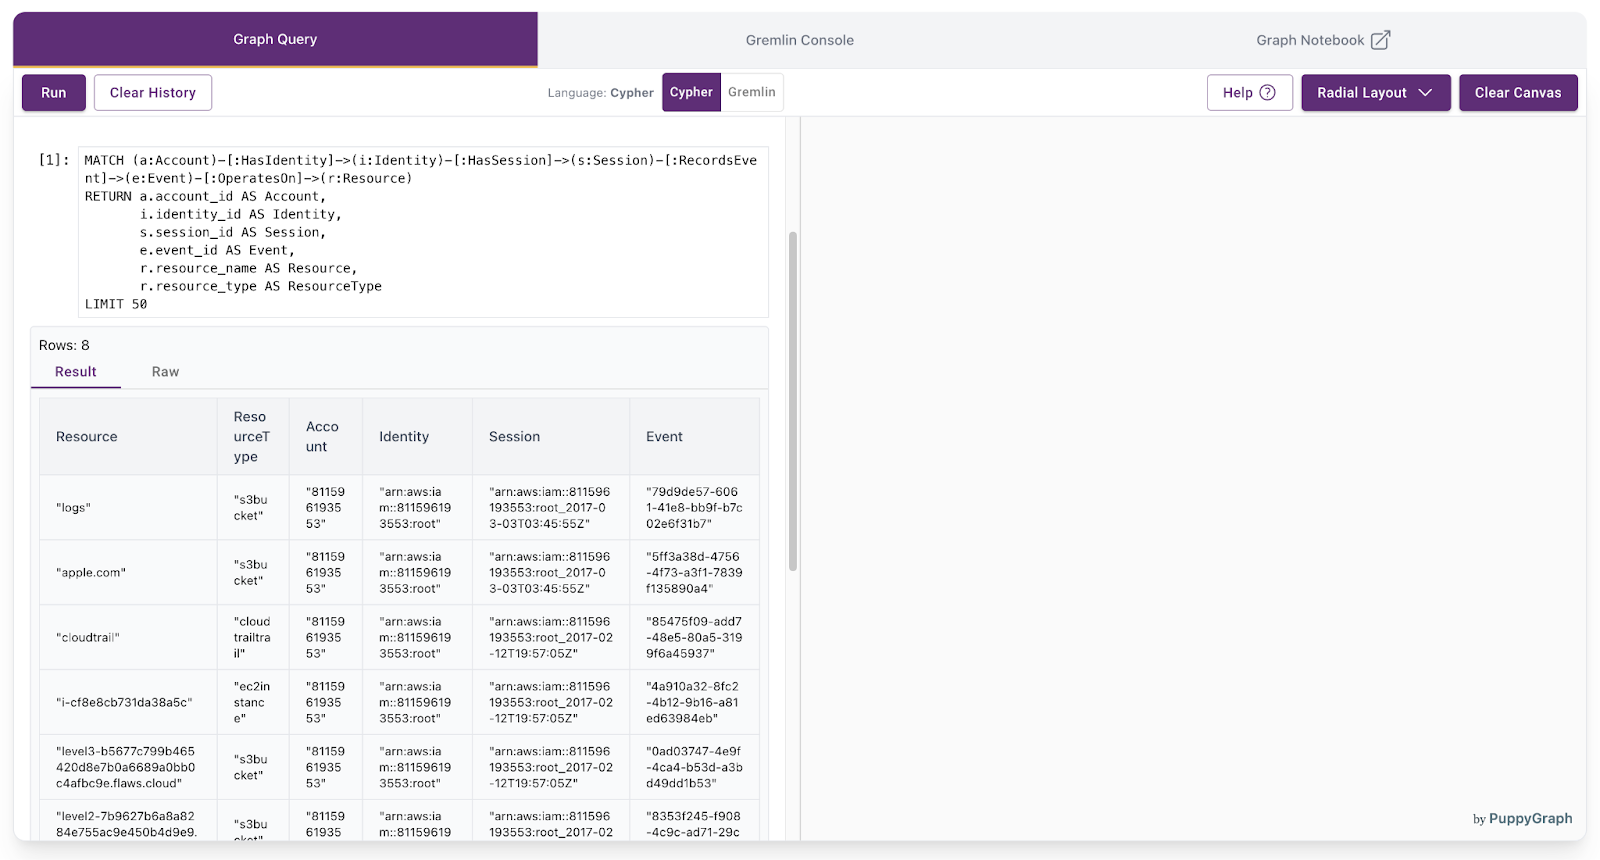
Cypher:
MATCH (a:Account)-[:HasIdentity]->(i:Identity)-[:HasSession]->(s:Session)-[:RecordsEvent]->(e:Event)-[:OperatesOn]->(r:Resource)
RETURN a.account_id AS Account,
       i.identity_id AS Identity,
       s.session_id AS Session,
       e.event_id AS Event,
       r.resource_name AS Resource,
       r.resource_type AS ResourceType
LIMIT 50
Gremlin:
g.V().hasLabel('Account').as('a')
  .out('HasIdentity').hasLabel('Identity').as('i')
  .out('HasSession').hasLabel('Session').as('s')
  .out('RecordsEvent').hasLabel('Event').as('e')
  .out('OperatesOn').hasLabel('Resource').as('r')
  .select('a', 'i', 's', 'e', 'r')
  .by(valueMap('account_id').unfold())
  .by(valueMap('identity_id').unfold())
  .by(valueMap('session_id').unfold())
  .by(valueMap('event_id').unfold())
  .by(valueMap('resource_name').unfold())
  .by(valueMap('resource_type').unfold())
  .limit(50)
The query results will be displayed:
2. Count events per account in a specific time range
Use case: Measure account activity over a defined period by counting how many events each account triggered.
Natural language:
“Between February 1 and March 1, 2017, how many events did each account generate?”
Cypher:
MATCH (a:Account)-[:HasIdentity]->()-[:HasSession]->(s:Session)-[:RecordsEvent]->(e:Event)
WHERE e.event_time >= datetime("2017-02-01T00:00:00")
AND e.event_time < datetime("2017-03-01T00:00:00")
RETURN a.account_id AS Account, count(e) AS EventCount
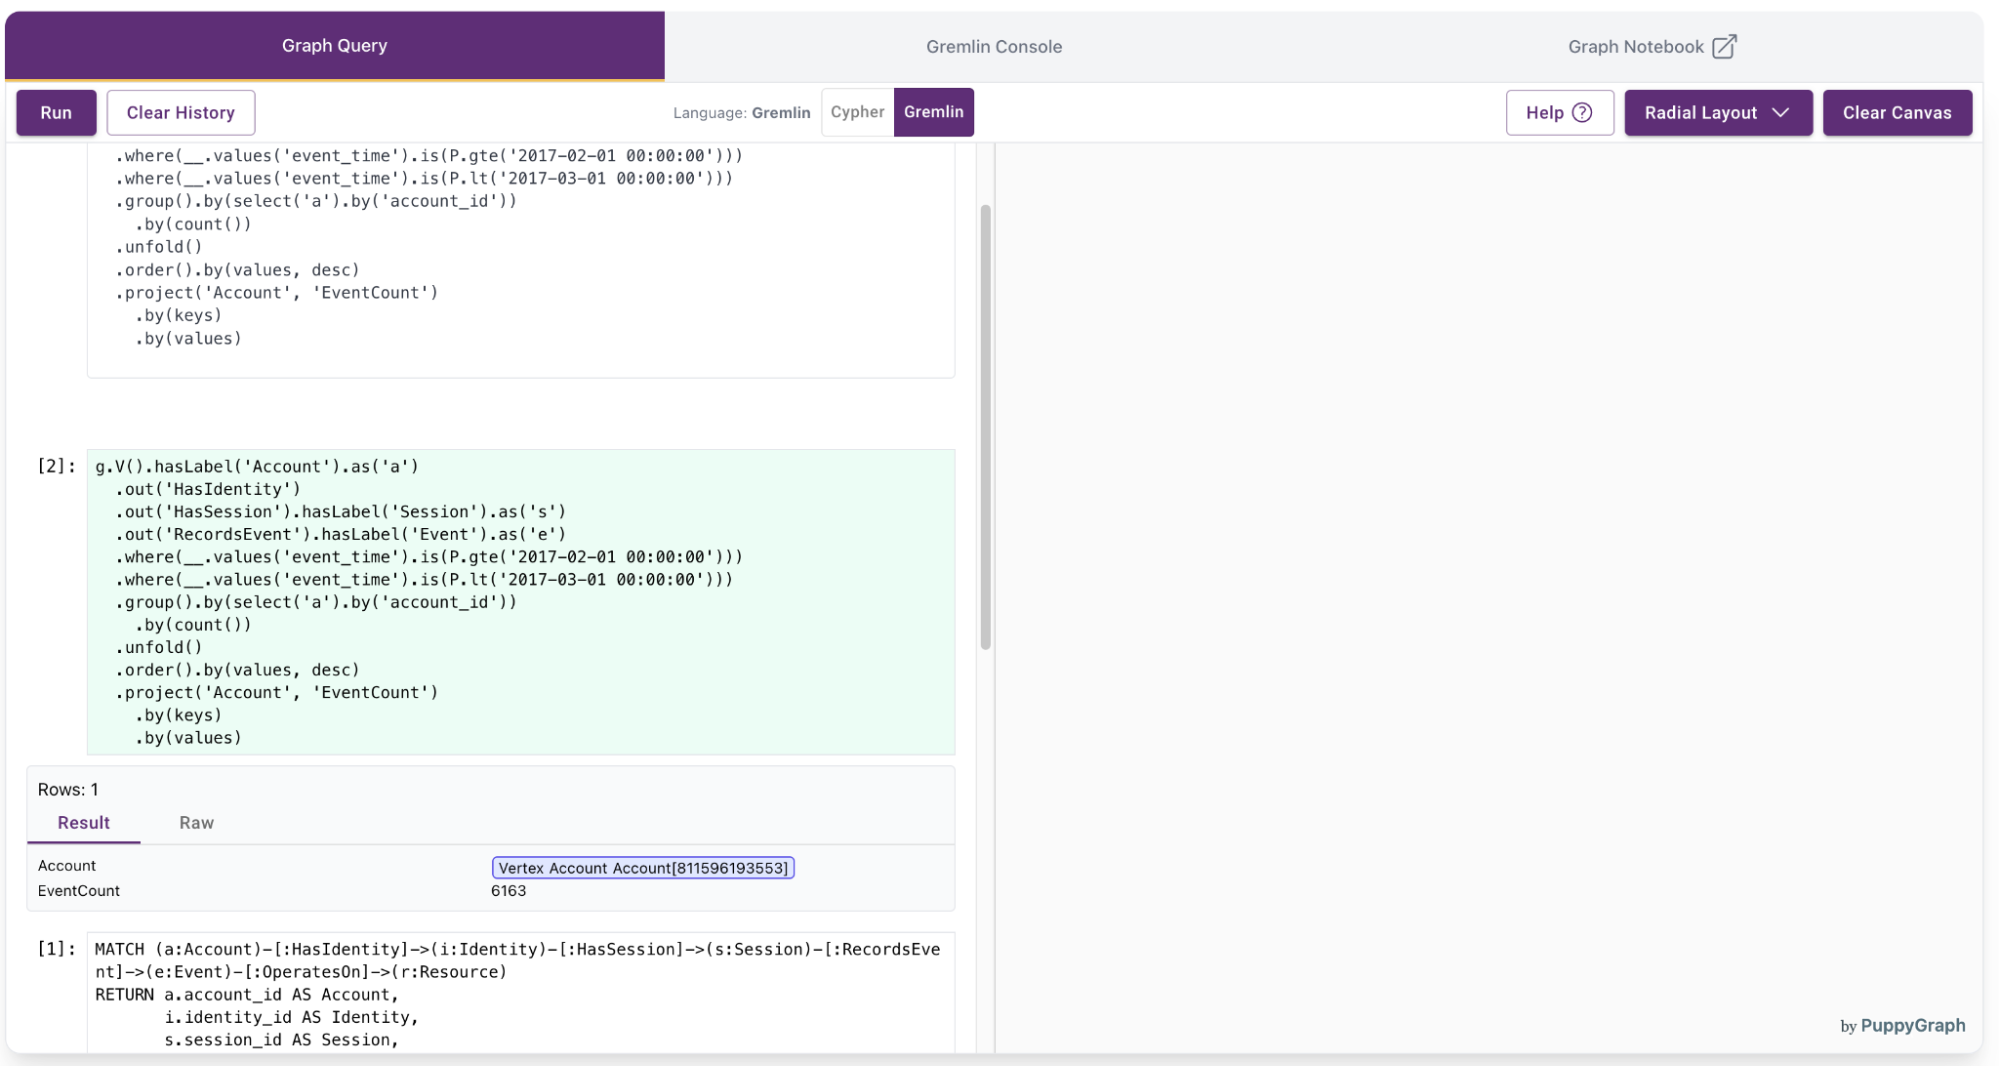
ORDER BY EventCount DESCGremlin:
g.V().hasLabel('Account').as('a')
  .out('HasIdentity')
  .out('HasSession').hasLabel('Session').as('s')
  .out('RecordsEvent').hasLabel('Event').as('e')
  .where(__.values('event_time').is(P.gte('2017-02-01 00:00:00')))
  .where(__.values('event_time').is(P.lt('2017-03-01 00:00:00')))
  .group().by(select('a').by('account_id'))
    .by(count())
  .unfold()
  .order().by(values, desc)
  .project('Account', 'EventCount')
    .by(keys)
    .by(values)
The query results will be displayed:
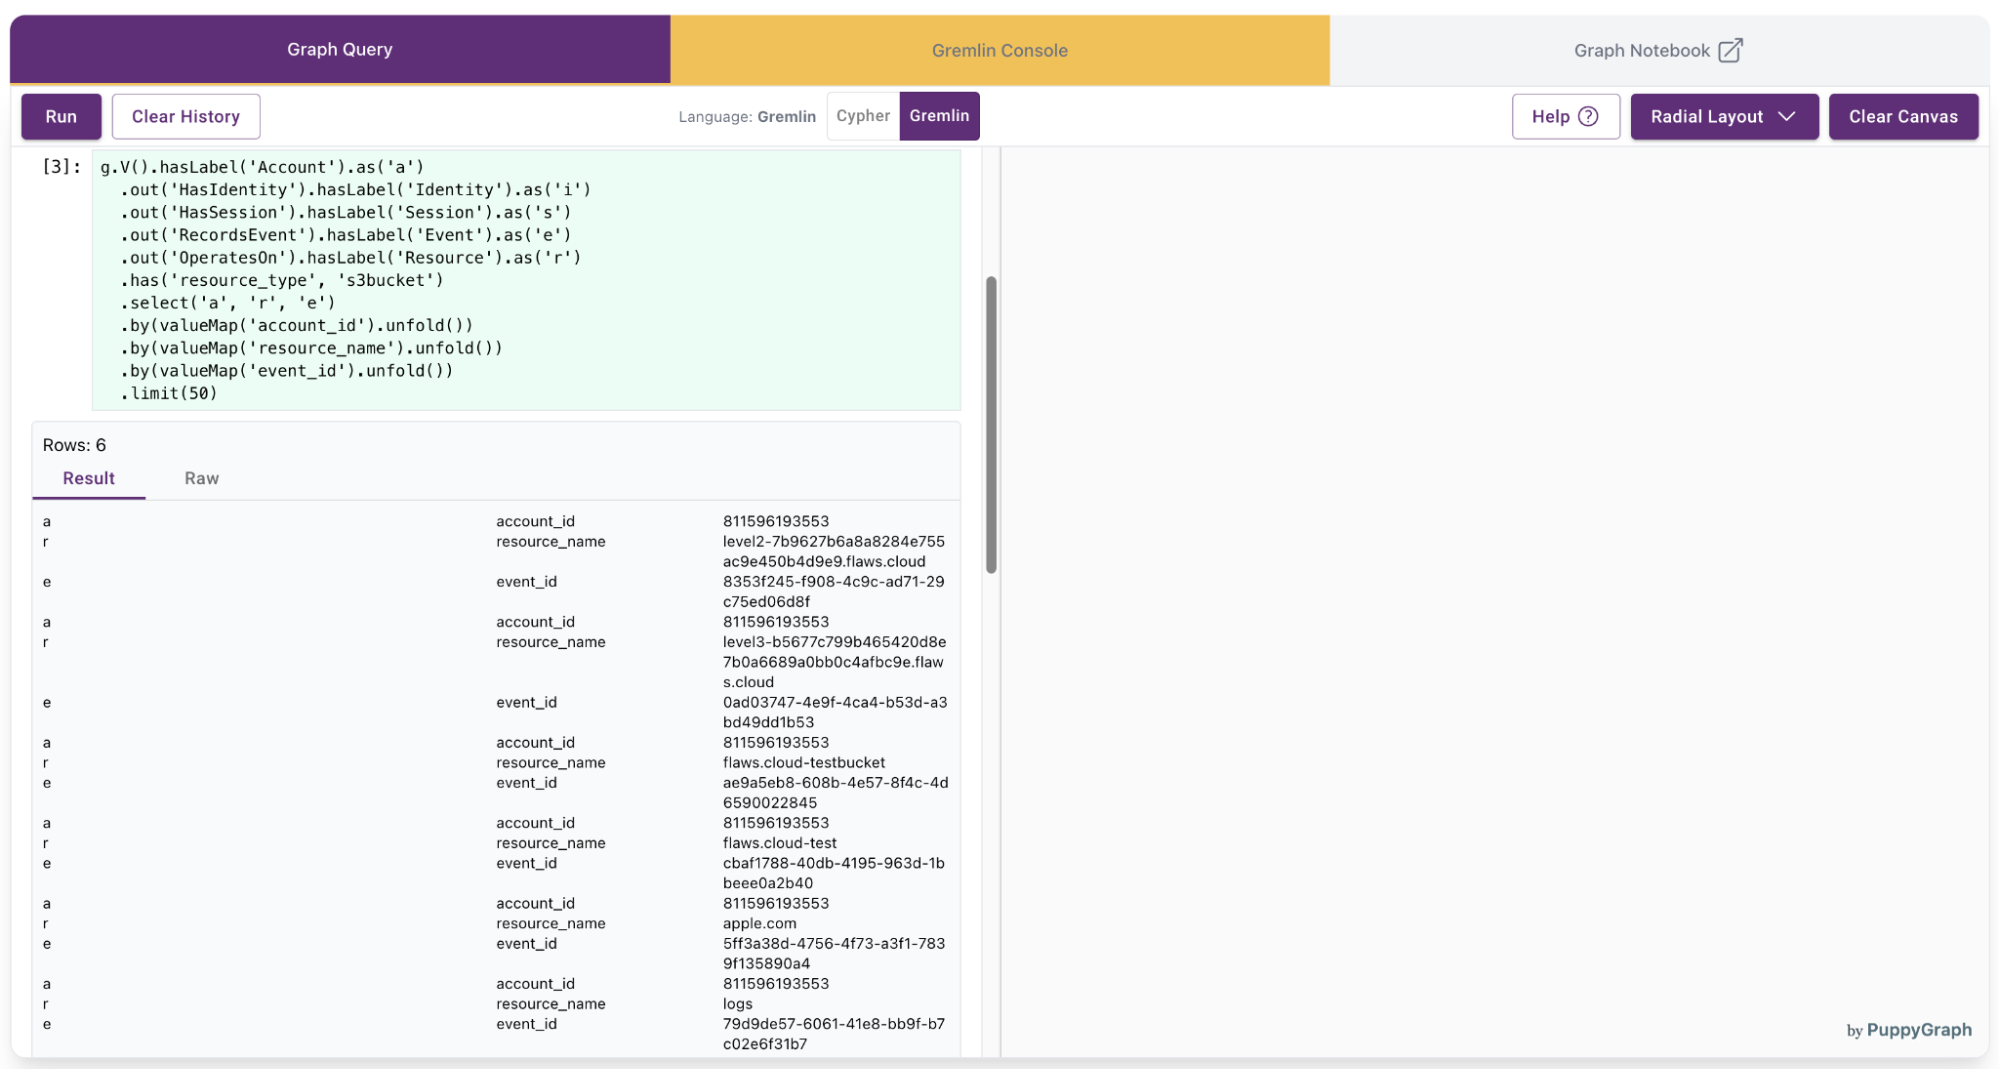
3. Identify accounts operating on a specific resource type
Use case: Find which accounts have interacted with a particular type of resource, such as S3 buckets, and what events were involved.
Natural language:
“Show me which accounts accessed S3 buckets—include the bucket name and the corresponding event ID.”
Cypher:
MATCH (a:Account)-[:HasIdentity]->(i:Identity)-[:HasSession]->(s:Session)-[:RecordsEvent]->(e:Event)-[:OperatesOn]->(r:Resource)
WHERE r.resource_type = 's3bucket'
RETURN a.account_id AS Account,
       r.resource_name AS BucketName,
       e.event_id AS EventID
LIMIT 50
Gremlin:
g.V().hasLabel('Account').as('a')
  .out('HasIdentity').hasLabel('Identity').as('i')
  .out('HasSession').hasLabel('Session').as('s')
  .out('RecordsEvent').hasLabel('Event').as('e')
  .out('OperatesOn').hasLabel('Resource').as('r')
  .has('resource_type', 's3bucket')
  .select('a', 'r', 'e')
  .by(valueMap('account_id').unfold())
  .by(valueMap('resource_name').unfold())
  .by(valueMap('event_id').unfold())
  .limit(50)
The query results will be displayed:
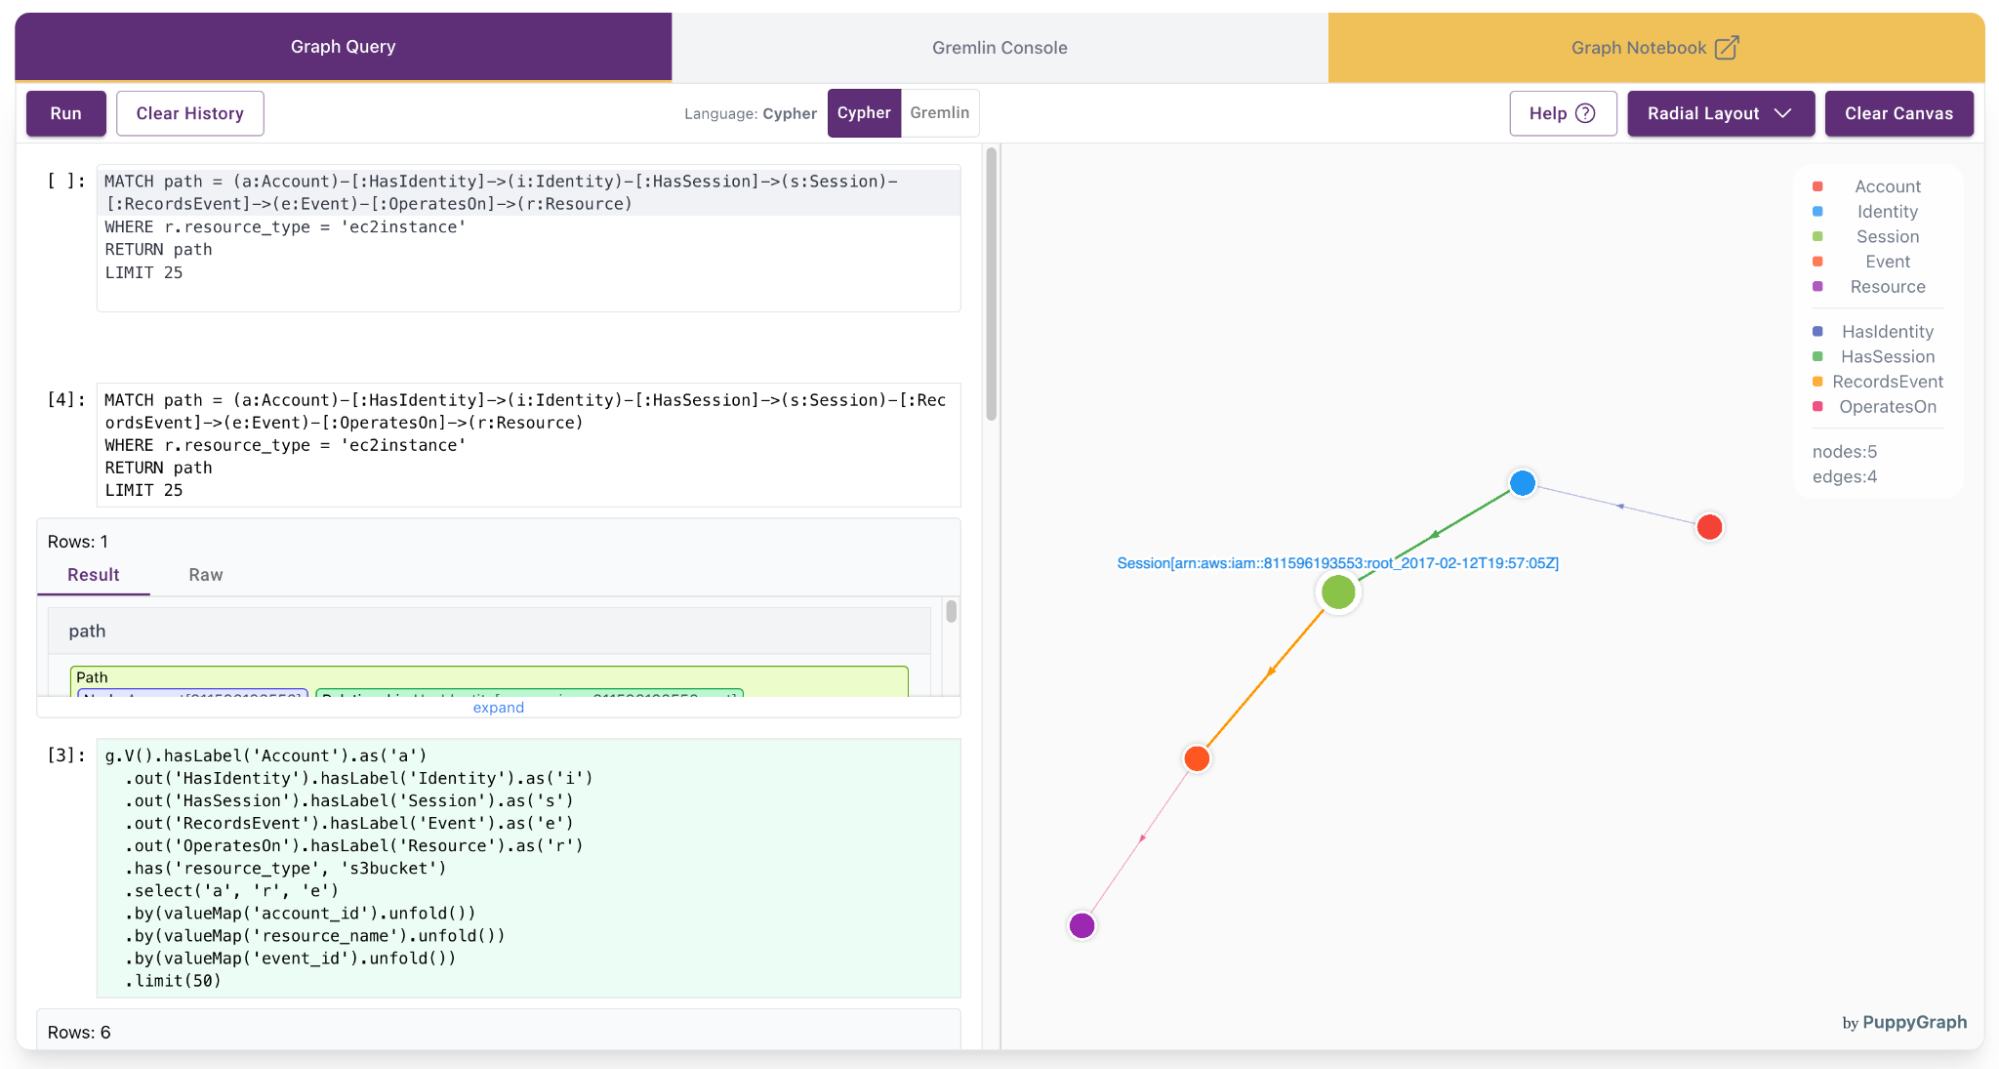
4. Retrieve detailed multi-hop paths for EC2 instances
Use case: Visualize the full interaction path from accounts to EC2 instances to understand how compute resources were accessed.
Natural language:
“Trace the full sequence of interactions—from account to identity to session to event—that led to operations on EC2 instances.”
Cypher:
MATCH path = (a:Account)-[:HasIdentity]->(i:Identity)-[:HasSession]->(s:Session)-[:RecordsEvent]->(e:Event)-[:OperatesOn]->(r:Resource)
WHERE r.resource_type = 'ec2instance'
RETURN path
LIMIT 25
Gremlin:
g.V().hasLabel('Account').as('a')
  .out('HasIdentity').hasLabel('Identity').as('i')
  .out('HasSession').hasLabel('Session').as('s')
  .out('RecordsEvent').hasLabel('Event').as('e')
  .out('OperatesOn').hasLabel('Resource').as('r')
  .has('resource_type', 'ec2instance')
  .path()
  .limit(25)
The query results will be displayed:
Cleaning up
To stop and remove the PuppyGraph container, run the following command:
docker stop puppy
docker rm puppy
Conclusion
Cybersecurity teams need more than static queries—they need context. Graph analytics offer a powerful lens for understanding how users, sessions, events, and resources interact over time. PuppyGraph and Amazon S3 Tables allow you to explore these relationships at scale—no ETL, no data duplication, and no added complexity.
Modeling your security data as a graph gives you the ability to ask deeper questions and uncover hidden patterns—whether it’s tracing suspicious activity, detecting privilege escalation paths, or understanding how access is shared across identities.
Try it yourself
- Launch a graph query engine in minutes: Download PuppyGraph’s free Developer Edition
- Explore S3 Tables with Apache Iceberg: Learn more on AWS