Networking & Content Delivery
Scaling your hybrid DNS setup with Amazon Route 53 Resolver endpoint metrics
This post demonstrates how to use a new Amazon CloudWatch metric for Amazon Route 53 Resolver endpoints to make informed scaling decisions. We show you how to monitor Resolver Networking Interface (RNI) capacity and implement a scalable architecture that makes sure of reliable DNS resolution across your hybrid infrastructure.
As organizations expand their hybrid cloud environments, managing DNS resolution between on-premises and Amazon Web Services (AWS) networks necessitates considerations for handling the scale of multiple Amazon Virtual Private Clouds (Amazon VPCs) and corresponding DNS traffic. AWS users rely on Route 53 Resolver endpoints for seamless DNS integration. However, as traffic grows, adding more RNIs to an endpoint is necessary to handle the increased load. This problem is seen in large multi-VPC environments where all DNS traffic is sent through Route 53 Resolver endpoints in a centralized DNS hub VPC. Although users have traditionally used the CloudWatch metrics InboundQueryVolume and OutboundQueryAggregateVolume to anticipate capacity challenges, it may not precisely indicate when a Route 53 Resolver endpoint has reached its capacity limit.
Customer architecture of hybrid setup
Enterprise organizations operating at scale typically implement a centralized DNS architecture for scalability and reduced management overhead. Figure 1 shows an example user architecture comprised of multiple VPCs connected through AWS Transit Gateway.
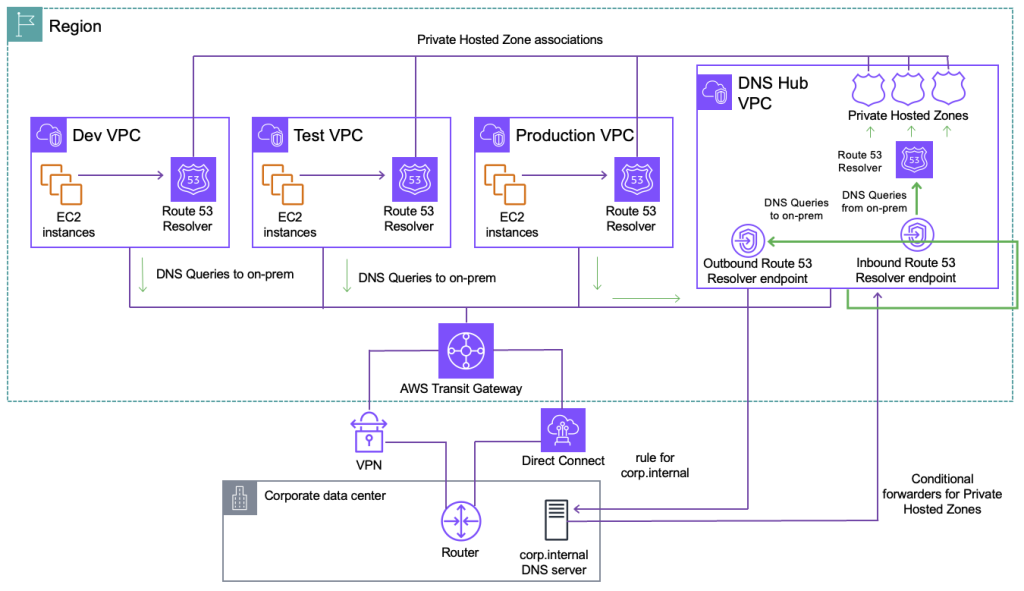
Figure 1: A multi-VPC AWS environment with Hybrid DNS setup
This integrates with on-premises through AWS Direct Connect or AWS Site-to-Site VPN connection. Route 53 Resolver endpoints are used in a designated Hub VPC to centralize and streamline DNS management. This centralized approach allows organizations to maintain consistent DNS policies, security controls, and monitoring across their entire infrastructure. As enterprises continue their cloud migration initiatives and deploy more mission-critical workloads to AWS, the volume and latency of DNS queries flowing through these endpoints increases significantly. What starts as a pair of Route 53 RNI can quickly become inadequate for supporting the organization’s expanding hybrid ecosystem. Each RNI can process up to 10,000 queries per second (QPS) over UDP, but the QPS per network interface is significantly lower for DNS over HTTPS (DoH). Factors such as query type, response size, query response times, and round-trip latency influence the actual QPS rate. When you reach that limit, you may want to increase the number of RNIs to handle the query load. This approach of scaling is covered in this AWS blog post and uses a few CloudWatch metrics such as InboundQueryVolume, OutboundQueryVolume, and OutBoundQueryAggregateVolume.
However, these metrics alone cannot accurately capture the capacity usage of the Route 53 Resolver endpoint. This is because it does not include other factors such as latency and protocol that can impact RNI usage. Route 53 has launched a new metric called ResolverEndpointCapacityStatus that provides a signal to inform your scaling decisions.
Scaling the architecture through Route 53 Resolver endpoint metrics
The ResolverEndpointCapacityStatus metric is designed to provide a holistic measure of its endpoint usage. It is a per-endpoint metric and displays results based on the highest used RNIs from the endpoints RNI pool across all Availability Zones (AZs). On the backend, the usage calculation incorporates multiple factors that affect RNI performance, such as DNS protocol, latency, and other relevant parameters. This comprehensive approach makes sure of a more accurate representation of the endpoint’s true capacity status. The capacity status is exposed through CloudWatch as the ResolverEndpointCapacityStatus metric, which is reported for each endpoint at one minute granularity. The metric uses a three-level status indicator:
- 0 (OK): Endpoint is operating within normal capacity limits
- 1 (Warning): Endpoint is approaching capacity thresholds
- 2 (Critical): Endpoint has exceeded recommended capacity limits
You may occasionally notice missing data points in CloudWatch metrics during back-to-back RNI maintenance. This is expected behavior and can be safely ignored.
Further details of this metric are covered in the AWS Documentation.
ResolverEndpointCapacityStatus metric in action
In this section we show you how the new ResolverEndpointCapacityStatus metric can be used to signal scaling actions and special considerations for inbound Route 53 Resolver endpoints.
Experiment setup
The following is an overview of the experiment, also shown in Figure 2:
- Add 50 ms latency to nameserver (simulating enterprise conditions)
- Starting point: 4 load generation nodes using dnsperf, each at 550 QPS
- Every 10 minutes: Add two more nodes
- Total duration: 40 minutes
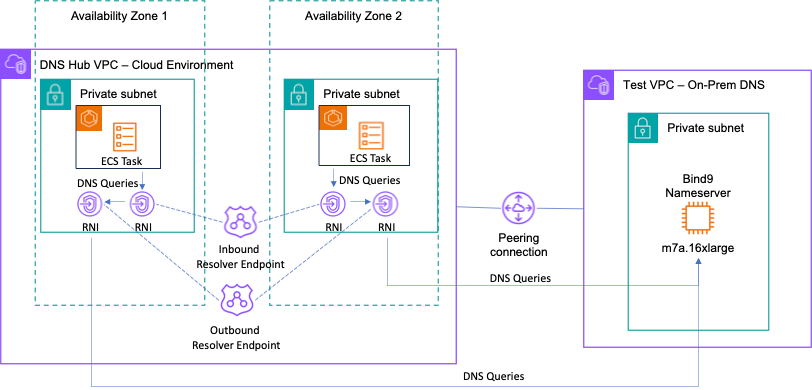
Figure 2: Test setup to simulate large volume of DNS traffic and latency for inbound resolver
To clarify, we send traffic through an inbound resolver rather than the Route 53 Resolver so that we can simulate DNS query traffic to a single RNI. Traffic automatically load balances between the minimum two RNIs for the outbound Route 53 Resolver. Then, we send traffic to an outbound Route 53 Resolver so we can use a custom name server with the added latency. The preceding setup is used to load test the Route 53 Resolver endpoints with DNS query traffic and does not represent an architecture for a real-world scenario.
Setting up the testing environment
- Download capacity-usage-test.yaml from here.
- Open the AWS CloudFormation console and deploy capacity-usage-test.yaml using the preceding template using the steps for creating a CloudFormation stack.
- When the stack is deployed, choose the Outputs tab and note the InboundEndpointId.
Setting up the traffic generator container
- Download mock_dns_traffic.sh and Dockerfile from here.
- Open the Amazon Elastic Container Registry (Amazon ECR) console.
- On the Repositories page, choose Create repository.
- Name your repo capacity-usage-blog/mock-traffic.
- Choose Create in the bottom right.
- Choose the repository created.
- Choose View push commands in the top right.
- Follow the steps on the screen to upload the container of mock_dns_traffic.sh into Amazon ECR.
- After the image uploads, copy the image URI.
- Open the Amazon Elastic Container Service (Amazon ECS) console.
- In the left side panel, choose the Task Definitions page, choose Create new task definition, and choose Create new task definition.
- Enter mock_dns_traffic as the Task definition family.
- Under Task size, choose 2 vCPU and 4 GB.
- Under Container – 1, enter the name mocker and the image URI from Step 8.
- Scroll to the bottom and choose Create
Generating DNS traffic
- Open the Amazon ECS console.
- In the left side panel, choose the Clusters page, and choose test-capacity-usage-cluster.
- Choose Tasks, then choose Run new task on the right side.
- Choose mock_dns_traffic from the Task family definition drop down.
- Under Desired tasks choose four.
- Expand the Networking tab.
- Under VPC, choose on-prem VPC.
- Under Subnets, choose the X on on-prem-public-subnet to remove public subnets.
- Under Security group, choose Use an existing security group and vpc-a-security-group from the drop down.
- Scroll to the bottom and choose Create.
- Repeat Steps 1–4 every 10 minutes with Desired tasks set to 2.
Add latency
- Open the Amazon Elastic Compute Cloud (Amazon EC2) console.
- From the left side panel, choose Instances, then choose the instance with the name nameserver.
- Choose Connect on the top right, choose Session Manager, then choose Connect.
- Use these commands to modify the latency, then repeat steps under Generating DNS Traffic
// Adds 50 ms latency
sudo tc qdisc add dev ens5 root netem delay 50ms 0ms

// Updates latency back to 0
sudo tc qdisc change dev ens5 root netem delay 0ms 0ms
Analyzing CloudWatch metrics
1. Open the Amazon CloudWatch console.
2. From the left side panel, expand Metrics, then choose All metrics.
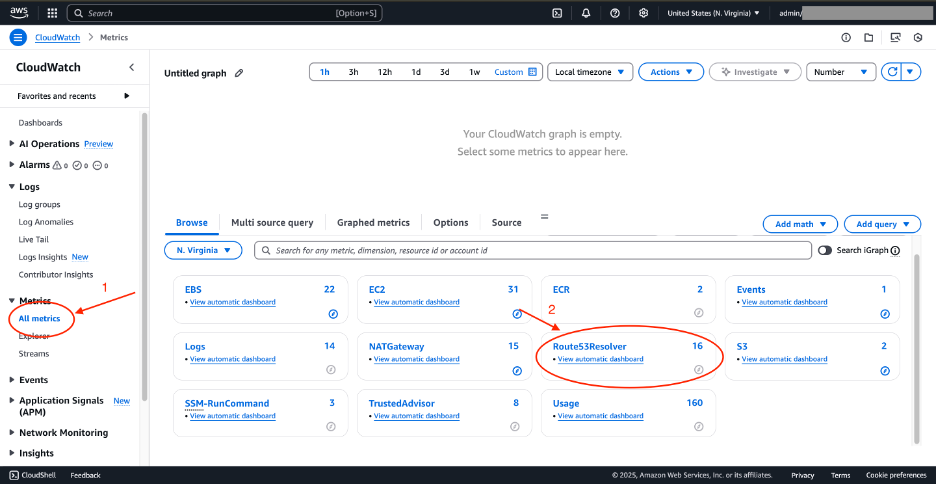
Figure 3: CloudWatch metrics for Route 53 Resolver
3. Choose Route53Resolver, then choose By Endpoint.
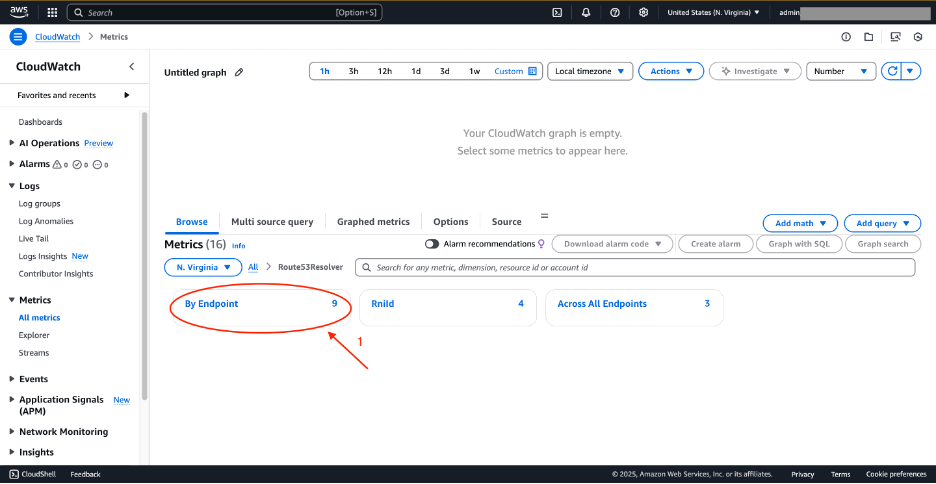
Figure 4: CloudWatch metrics for Route 53 Resolver—By Endpoint
4. Choose ResolverEndpointCapacityStatus metric for the rslvr-in-xxxx endpoint.
5. Under Metrics, choose the drop down called By Endpoint, then choose Route53Resolver.
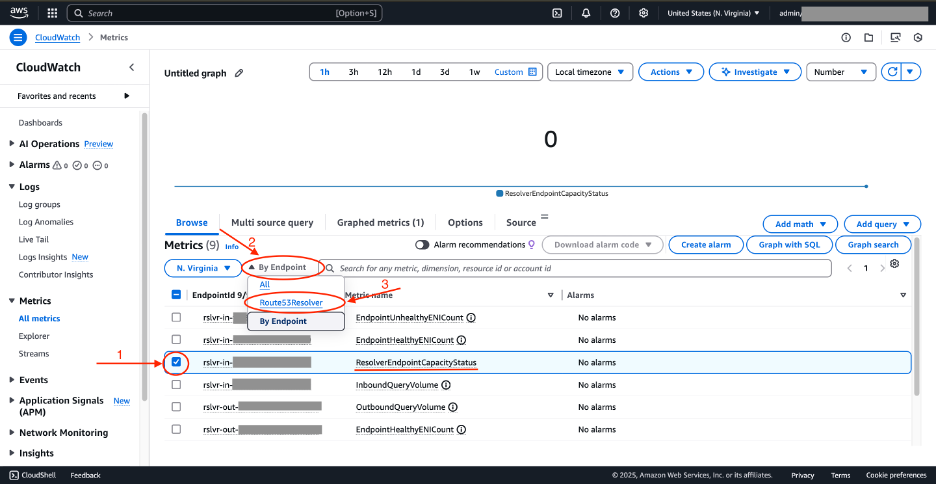
Figure 5: CloudWatch metrics for Route 53 Resolver—ResolverEndpointCapacityStatus
6. Choose Rnild, then choose InboundQueryVolume metric for both RNI.
7. Choose the Graphed metrics tab. On the top right, change Line to Number.
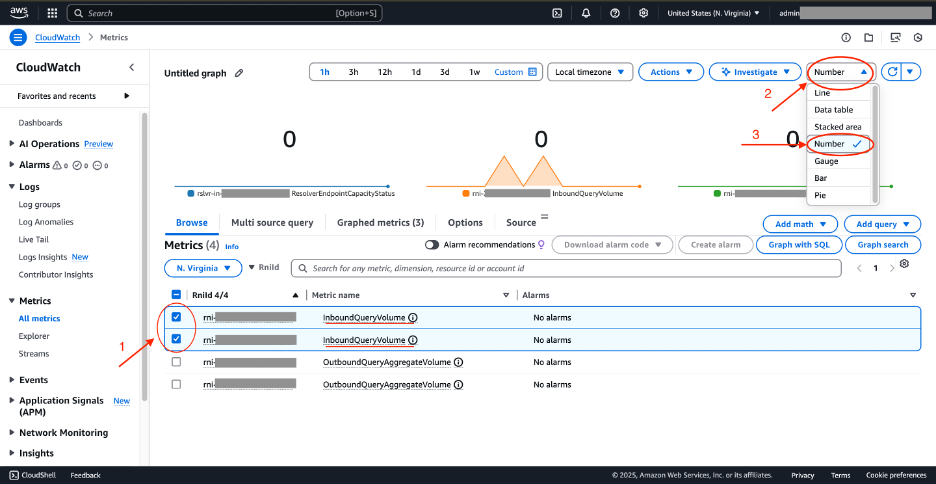
Figure 6: CloudWatch metrics for Route 53 Resolver—graphed metrics
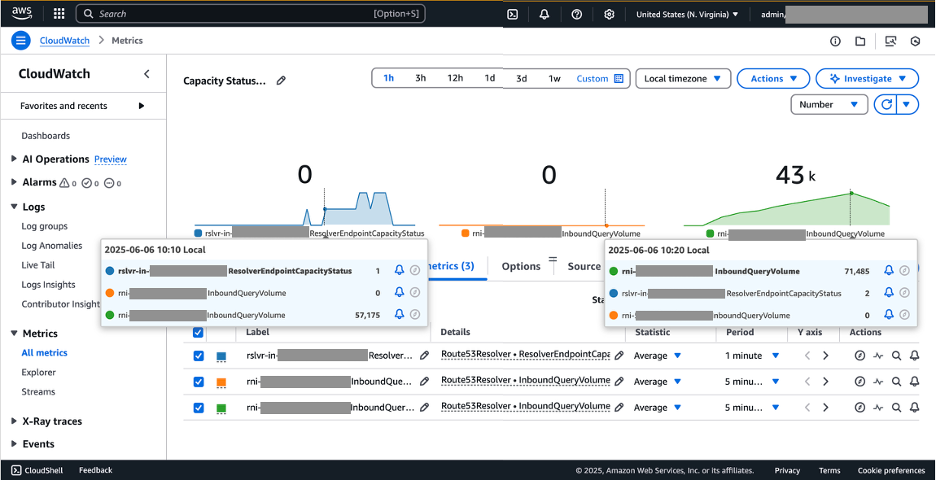
Figure 7: CloudWatch metrics ResolverEndpointCapacityStatus graph with increased DNS queries for inbound Route 53 Resolver endpoints
As you incrementally increased the query volume, the capacity status metric progressed through its three states: from 0 (Normal) to 1 (Warning) and finally 2 (Critical). The metric reached the warning threshold when one RNI processed approximately an average of 57,175 query volume and reached the critical threshold when one RNI processed approximately an average of 71,485 query volume. You can set up CloudWatch alarm to trigger when these thresholds of the ResolverEndpointCapacityStatus metric are breached. This can be used to notify network administrators or kickoff automated workflows to add more RNI to the endpoint.
The experiment also highlighted a critical consideration for inbound Route 53 Resolver endpoints: load balancing. Our results revealed a significant imbalance in query distribution, with one RNI handling an average 71,485 query volume while another remained unused. The ResolverEndpointCapacityStatus shows the status based on the highest used RNI from all RNIs under the endpoint. Therefore, you must monitor the InboundQueryVolume metric to make sure that DNS queries are load balancing effectively across all RNI.
The ResolverEndpointCapacityStatus metric significantly streamlines capacity management for Route 53 Resolver endpoints by providing clear, actionable signals for scaling decisions. Unlike the query volume metrics, which need administrators to understand complex relationships between query volumes, latency, service limits, and more, this new approach eliminates the guesswork of determining appropriate query volume thresholds. This streamlining is particularly valuable because these factors can fluctuate significantly across different environments, use cases, and over time. Administrators no longer need to analyze multiple metrics or understand the nuanced interplay between different performance indicators. Instead, they can confidently initiate scaling actions based on this single, comprehensive metric. AWS has engineered this metric to account for all relevant factors affecting endpoint performance, providing a streamlined solution for capacity management.
Although the ResolverEndpointCapacityStatus metric significantly streamlines capacity management, it’s just one part of a comprehensive DNS infrastructure strategy. For organizations looking to further optimize for high availability and performance, more considerations come into play. To delve deeper into further considerations for designing for high availability, go to this AWS Networking post.
Cleaning up
- Open the CloudFormation console.
- On the left side panel, choose Stacks, then choose test-capacity-usage.
- Choose delete, then choose delete.
- Open the Amazon ECR console.
- From the left side panel, choose Repositories, then choose the capacity-usage-blog/mock-traffic repository.
- Choose Delete in the top right, then choose Delete.
Conclusion
This post demonstrated how the new metric on CloudWatchResolverEndpointCapacityStatus streamlines capacity management for Amazon Route 53 Resolver endpoints in hybrid cloud environments. We explored how enterprises implementing hub-and-spoke DNS architectures can rely on a clear, three-state indicator (0 – Normal, 1 – Warning, 2 – Critical) to monitor their Route 53 Resolver endpoint capacity. Through our practical experiment, we showed how this metric provides early warnings when endpoints approach capacity limits, considering multiple factors such as query volumes, network latency, and protocol overhead. This streamlined approach eliminates the complexity of analyzing multiple metrics and understanding their interdependencies. Using the ResolverEndpointCapacityStatus metric allows enterprises to make confident, data-driven decisions about when to scale their Route 53 Resolver endpoints, making sure of reliable DNS resolution across their expanding hybrid environments. We also highlighted the importance of proper load balancing across RNIs to maximize endpoint capacity and maintain optimal performance. For more information, go to the Monitoring Route 53 Resolver endpoints with Amazon CloudWatch documentation. If you have questions about this post, then start a new thread on AWS re:Post or contact AWS Support.
About the authors

Keith Lee
Keith Lee is a Partners Solutions Architect at Amazon Web Services (AWS). He focuses on growing partnerships and enabling the adoption of new technologies. He works to expand strategic relationships, identify opportunities for partners to leverage AWS solutions, and facilitate the implementation of cutting-edge cloud technologies across various industries.

Anandprasanna Gaitonde
As an AWS Principal Solutions Architect, Anandprasanna Gaitonde is responsible for helping customers design and operate Well-Architected solutions to help them adopt the AWS cloud successfully. He focuses on AWS Networking and Serverless technologies to design and develop solutions in the cloud across industry verticals. He has Solutions Architect Professional and Advanced Networking certifications and holds a Master of Engineering degree in Computer Science and a postgraduate degree in Software Enterprise Management.