AWS Cloud Operations Blog
Observing Agentic AI workloads using Amazon CloudWatch agent
Introduction
As the adoption of agentic AI applications continues to grow, ensuring the reliability, performance, and overall observability of these systems becomes increasingly critical. Agentic AI applications, powered by large language models (LLM) and integrated with various data sources and APIs, can quickly become complex, making it challenging to gain visibility into their inner workings and overall health.
Agentic AI frameworks, like Strands Agents, Amazon Bedrock Agents, LangChain and others, provide developers with the tools to build and run these sophisticated AI-powered applications. These frameworks enable seamless integration between large language models and the necessary tools and data sources, allowing developers to automate multi-step tasks and focus on high-value work. However, to ensure these agentic AI applications are operating as expected and delivering a positive customer experience, comprehensive observability is a must.
This blog post will explore how you can leverage Amazon CloudWatch to observe and gain insights into your agentic AI applications. We’ll discuss the three key observability pillars, such as metrics, traces, and logs, that these frameworks typically provide, and demonstrate how to configure CloudWatch agent to ingest and analyze this telemetry data.
Solution Overview
To demonstrate the solution, we are going to develop a sample agentic AI application, Weather Forecaster, using the open source Strands Agents SDK.
The Weather Forecaster is a simple python-based agentic application that invokes the Claude Sonnet 3.7 model from Amazon Bedrock and executes a built-in http_request tool to fetch weather data from the National Weather Service API.
This application was instrumented with Strands traces using the OpenTelemetry standard, which allows it to capture the complete journey of a request through the agent, including interactions with the large language model, retrievers, tool usage, and event loop processing.
The Strands Agents SDK automatically tracks key metrics during the agent’s execution, such as:
- Token usage: Input tokens, output tokens, and total tokens consumed
- Performance metrics: Latency and execution time measurements
- Tool usage: Call counts, success rates, and execution times for each tool
- Event loop cycles: Number of reasoning cycles and their durations
To observe and gain insights into this agentic AI application, the solution leverages Amazon CloudWatch. The CloudWatch agent is installed and configured to collect the telemetry data generated by the Strands Agents SDK, including traces, metrics, and logs as shown in Figure 1.
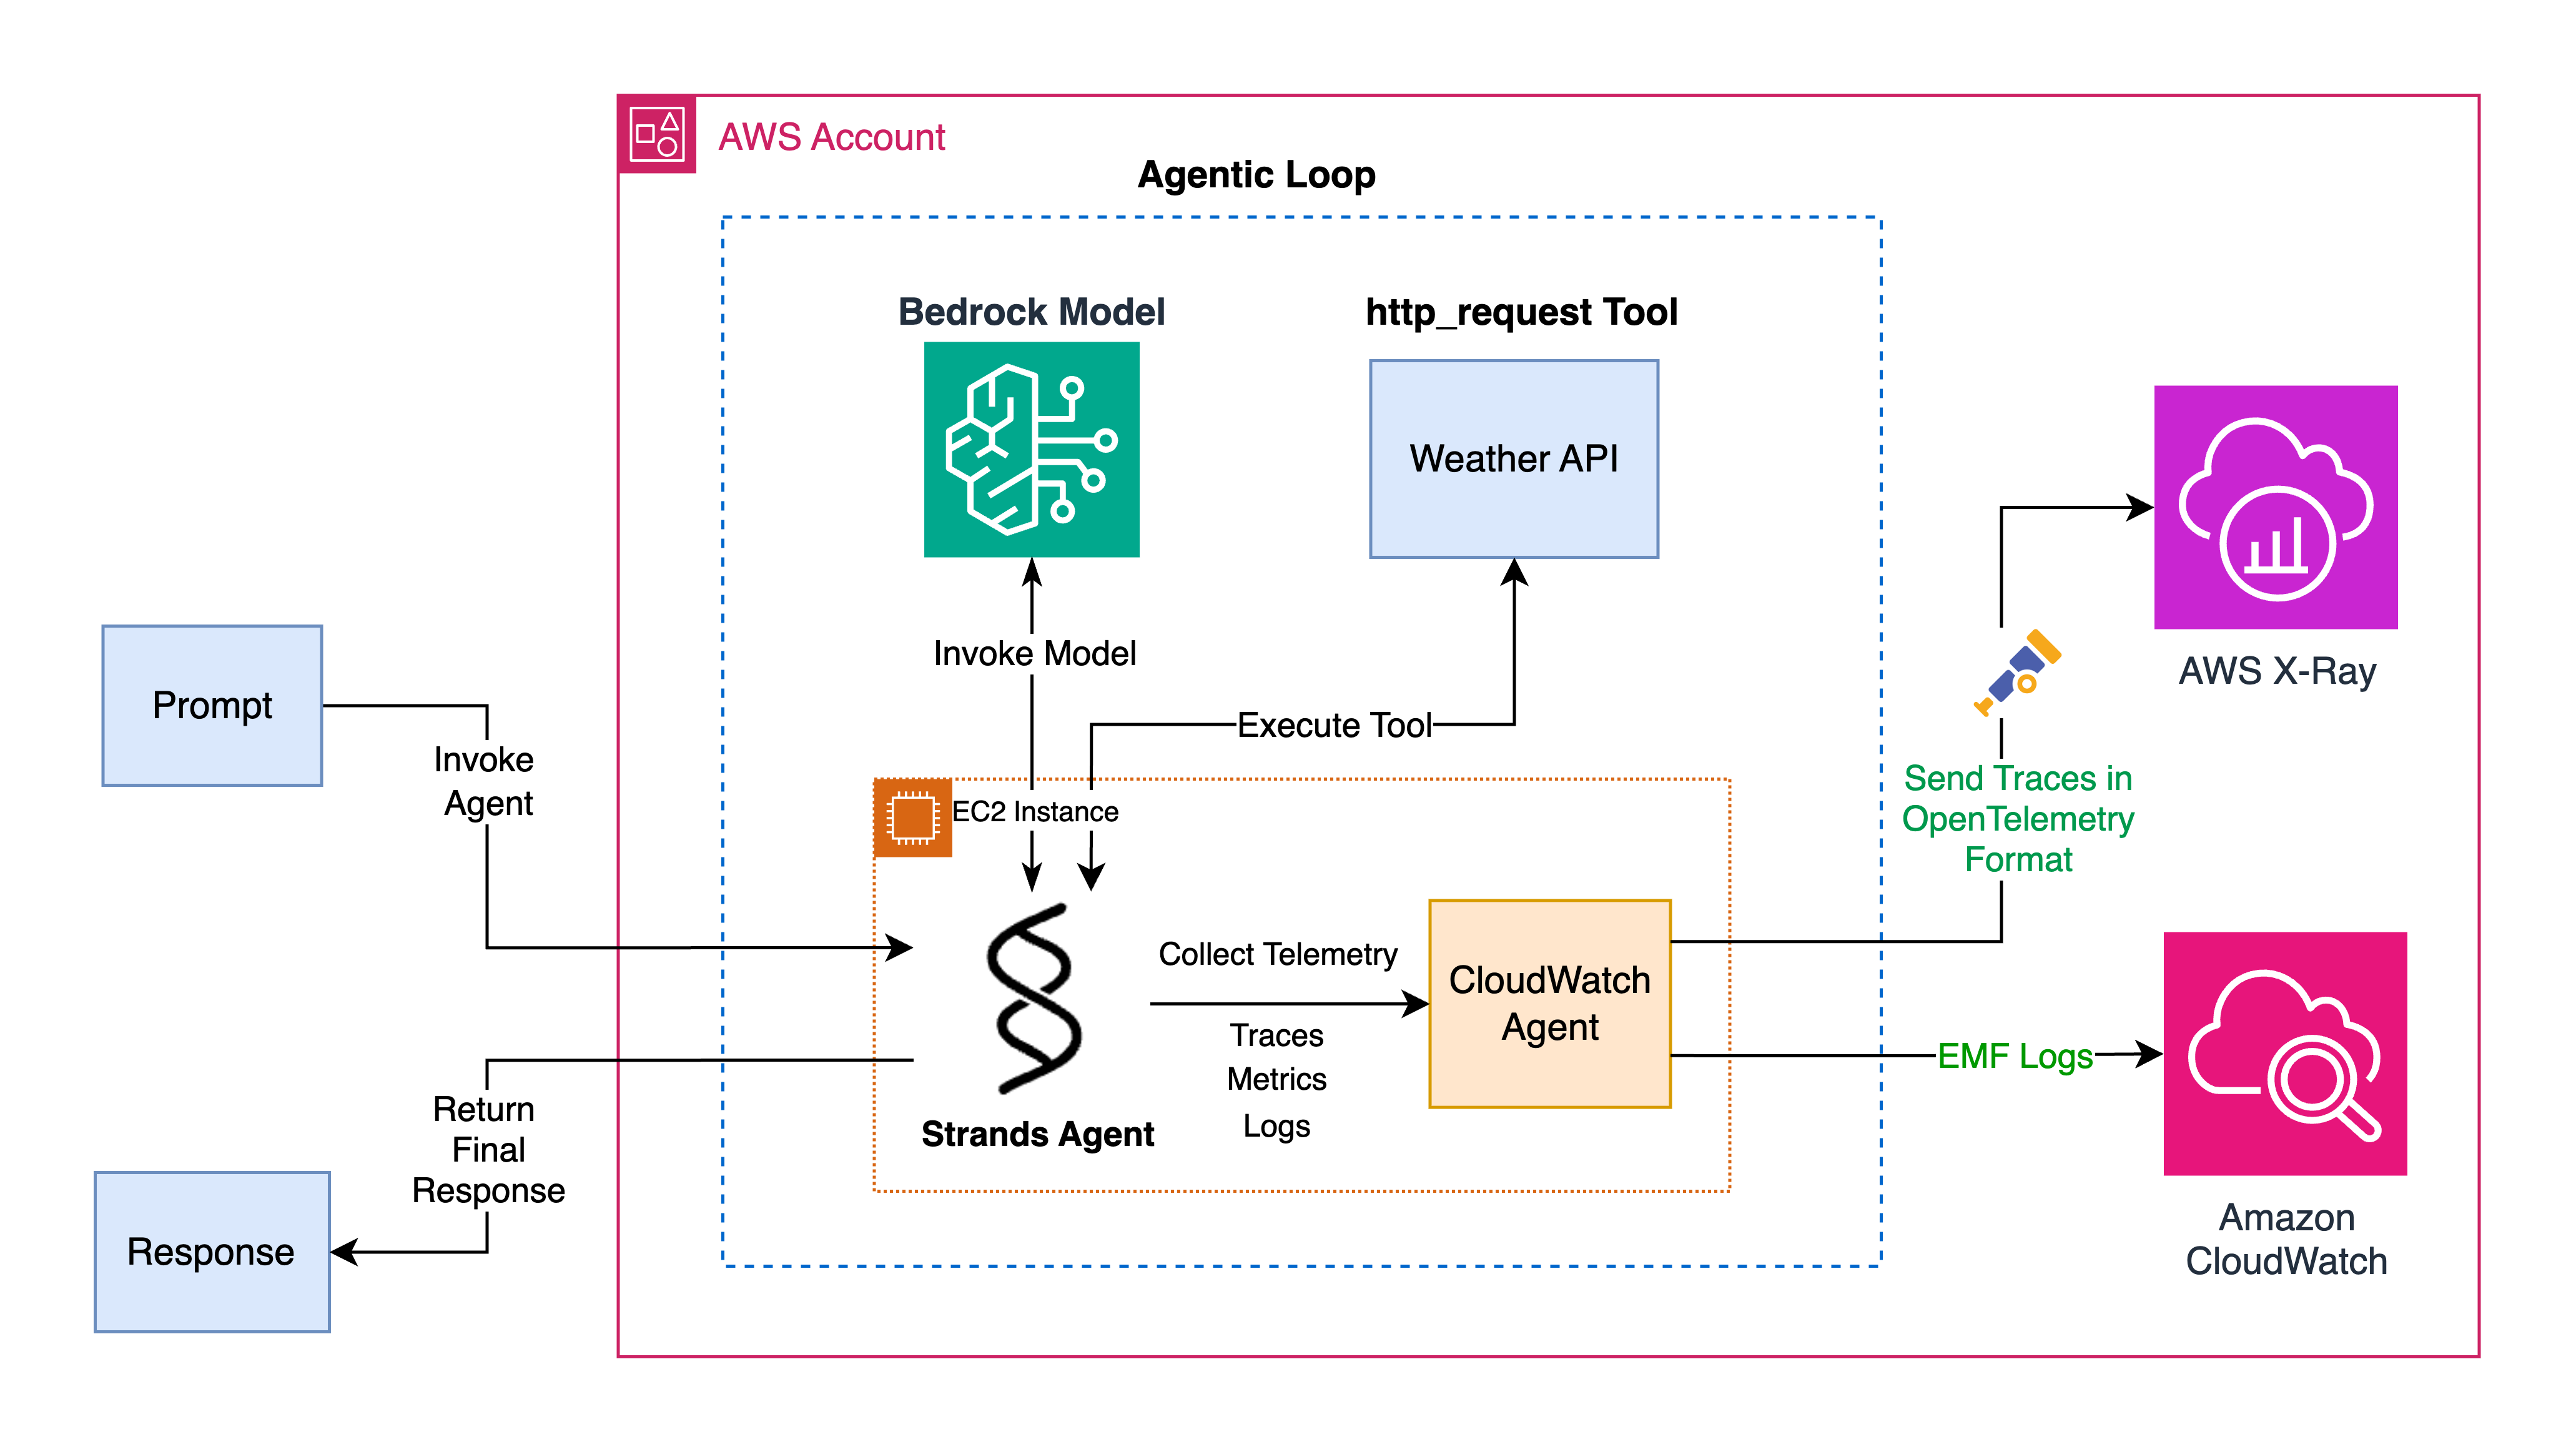 Figure 1 – Sample Python Agentic Application
The traces collected by the CloudWatch agent are sent to the AWS X-Ray backend, providing a visual timeline of the request’s journey through the application. The metrics are collected as Embedded Metric Format (EMF) logs, which are then sent to CloudWatch Logs and used to generate custom metrics in the backend. Additionally, the CloudWatch agent is configured to collect the application logs, enabling the use of CloudWatch Logs Insights to run advanced queries and extract valuable information.
Prerequisites
For this walkthrough, you need to have the following prerequisites:
- An AWS account.
- Switch to the AWS region where you would like to deploy the sample agentic application and enable the following
- Enable Bedrock model access for
Claude 3.7 Sonnetmodel. - Enable Transaction Search in the CloudWatch console. Set the X-Ray trace indexing to 100% to index all the spans as trace summaries for end-to-end transaction analysis.
- Enable Bedrock model access for
Solution Deployment
The application code, deployment template and CloudWatch agent configuration file are hosted in a GitHub repository.
To deploy the sample Python agentic application, we’ll use an AWS CloudFormation template that launches an Amazon Elastic Cloud Compute (EC2) instance and runs a setup script in the instance’s user data. This setup script installs all the required dependencies and configures the CloudWatch agent using the provided configuration file to collect telemetry generated by the application.
Note:- Deploying this solution will incur charges for the used AWS services, including EC2, CloudWatch, X-Ray, and Amazon Bedrock. Clean up the resources when done to avoid ongoing costs.
Deploy python application to EC2 instance
- Download the ec2-deployment.yaml CloudFormation.
- Navigate to CloudFormation console in AWS account and region where you would like to deploy the python agentic application.
- For Create Stack, choose with New resources (standard).
- For Template source, choose Upload a template file. Choose file and select the template you downloaded in step 1.
- Choose Next.
- For Stack Name, enter a stack name, such as
agentic-ai-python-app. - In the parameters area, enter the following parameters as shown in Figure 2,
- For EC2 InstanceType, we recommend selecting at least
t3.medium. - For LatestAmiId and GitHubRepoUrl, leave the default values.
- For VPC ID and Subnet ID, select the VPC and subnet ids respectively from the dropdown. Select a subnet that has outbound internet access to reach weather API.
- For EC2 InstanceType, we recommend selecting at least
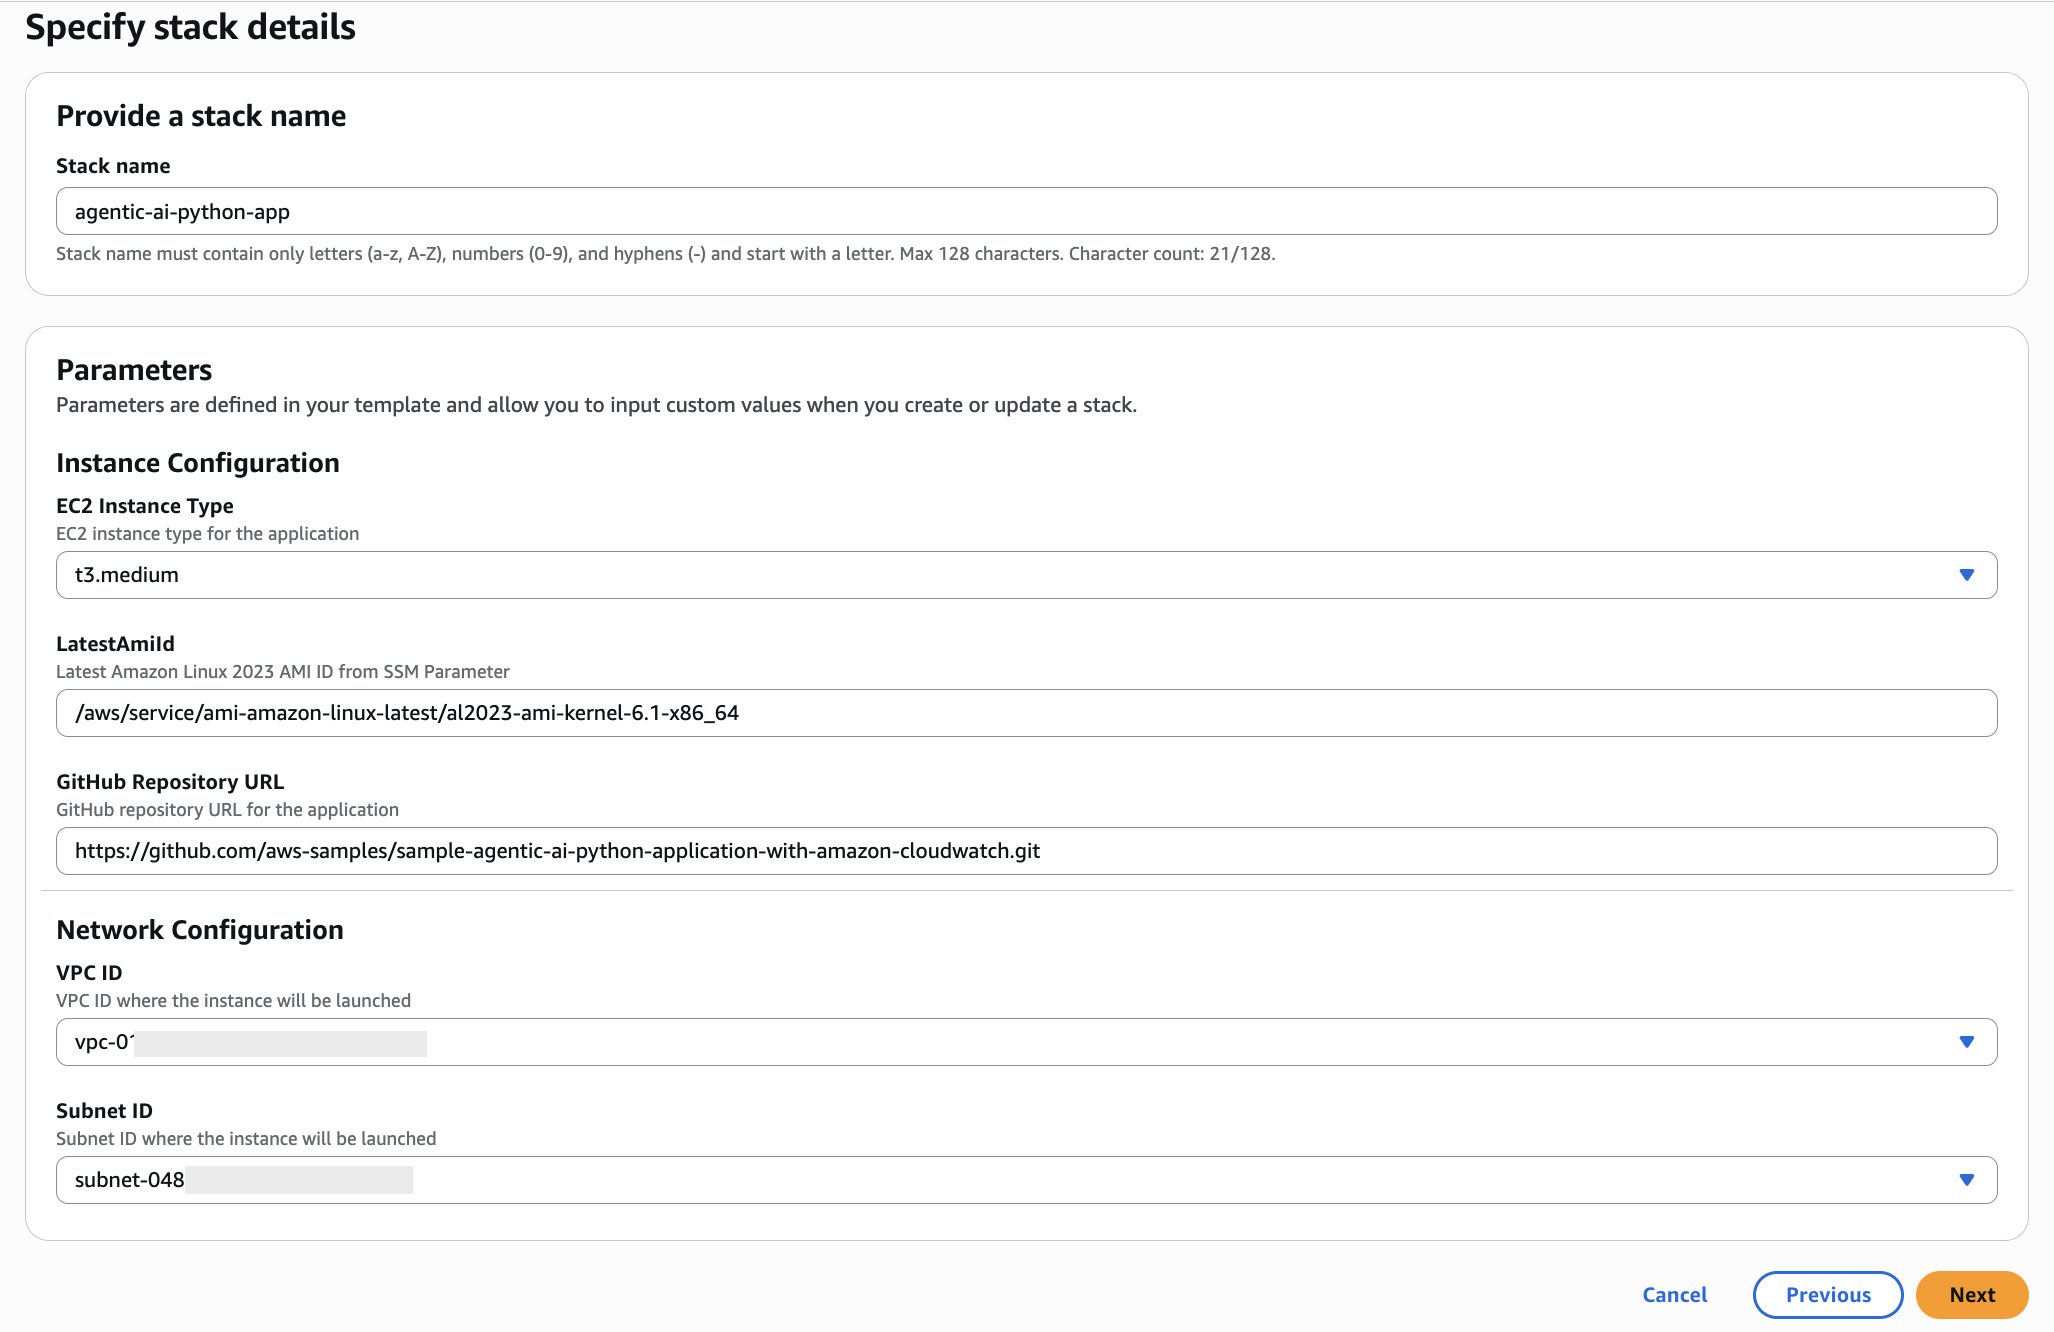
Figure 2: CloudFormation stack inputs
- Choose Next.
- On the Configure stack options page, choose Next.
- On the Review and create page, accept the option “I acknowledge that AWS CloudFormation might create IAM resources“.
- Choose Submit.
- After the template has deployed, choose Outputs and note the InstanceId.
Interacting with the Application
- Navigate to the EC2 console and connect to the Instance noted in the previous section using Session Manager, a capability of AWS Systems Manager as shown in Figure 3.
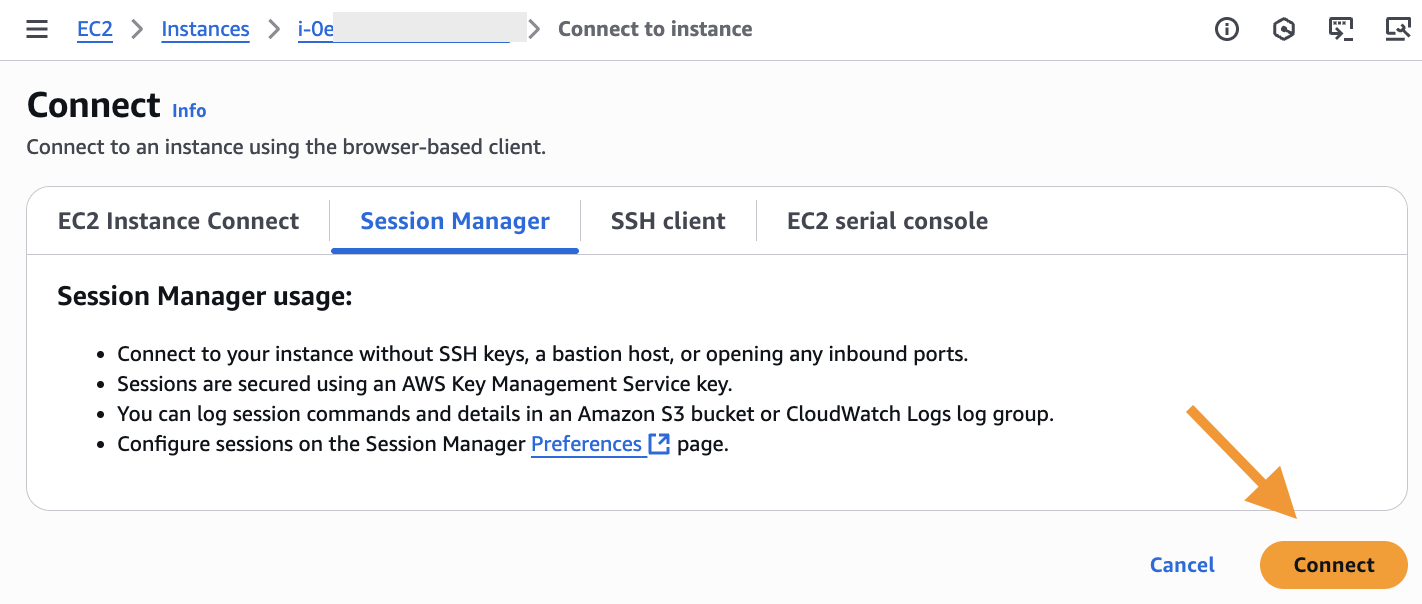
Figure 3: Connecting to EC2 instance via Session Manager
- Run the python application by executing the following command.
- Now, you can interact with the agent and ask questions to get information about weather as shown in Figure 4.
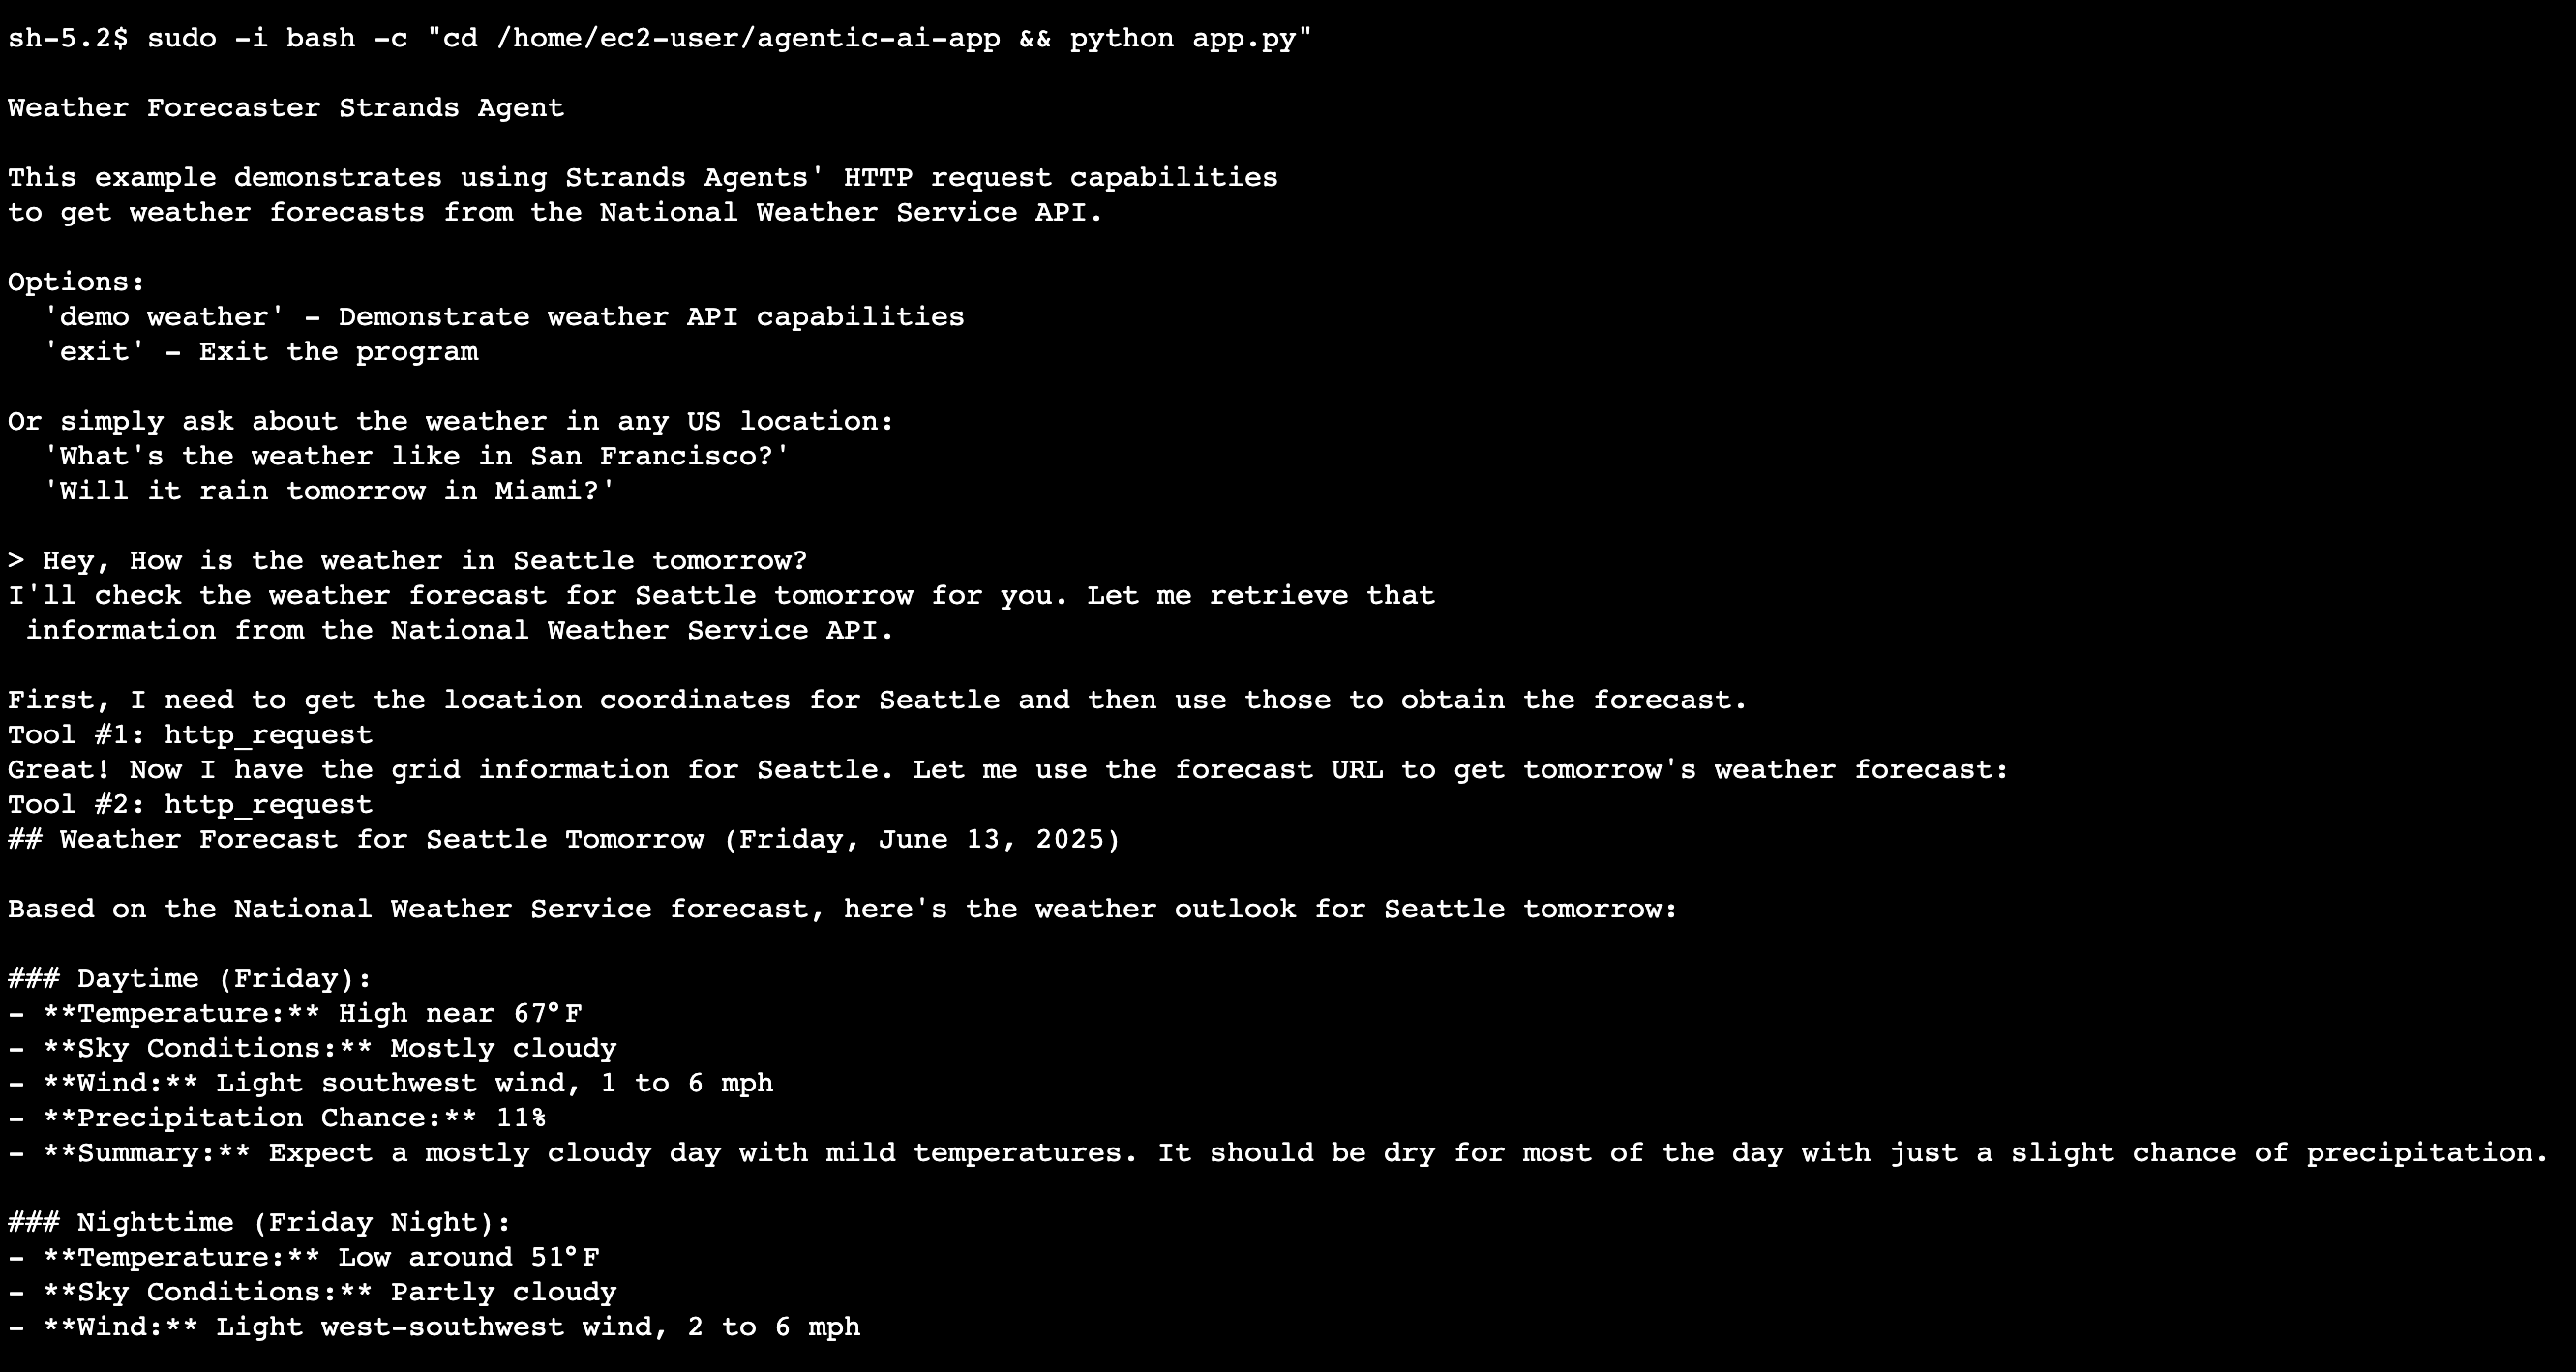
Figure 4: Conversation with weather forecaster agent
- The Strands agent interacted with the Bedrock Claude Sonnet 3.7 LLM in a loop, using the
http_requesttool to invoke a Weather API and generate the final response to our prompt.
In the next section, we’ll explore how to analyze the telemetry data generated by the application in the AWS CloudWatch console.
Analyzing the generated telemetry in the CloudWatch console
Trace analysis
- Navigate to the CloudWatch console in the AWS Management console.
- Now go to the Application Signals (APM) section and then select the Trace Map. The Strands Agent will be displayed within the Trace Map.
- Click on the Strands Agent in the Trace Map as shown in Figure 5 to view the traces generated by the agentic AI application.

Figure 5 – Trace Map
- The traces in Figure 6 will provide you with detailed information about the requests, including the response time, duration, and status of each trace.

Figure 6 – View Traces in CloudWatch console
- To dive deeper into a specific trace, click on the trace to see the full timeline of the request as shown in Figure 7 .
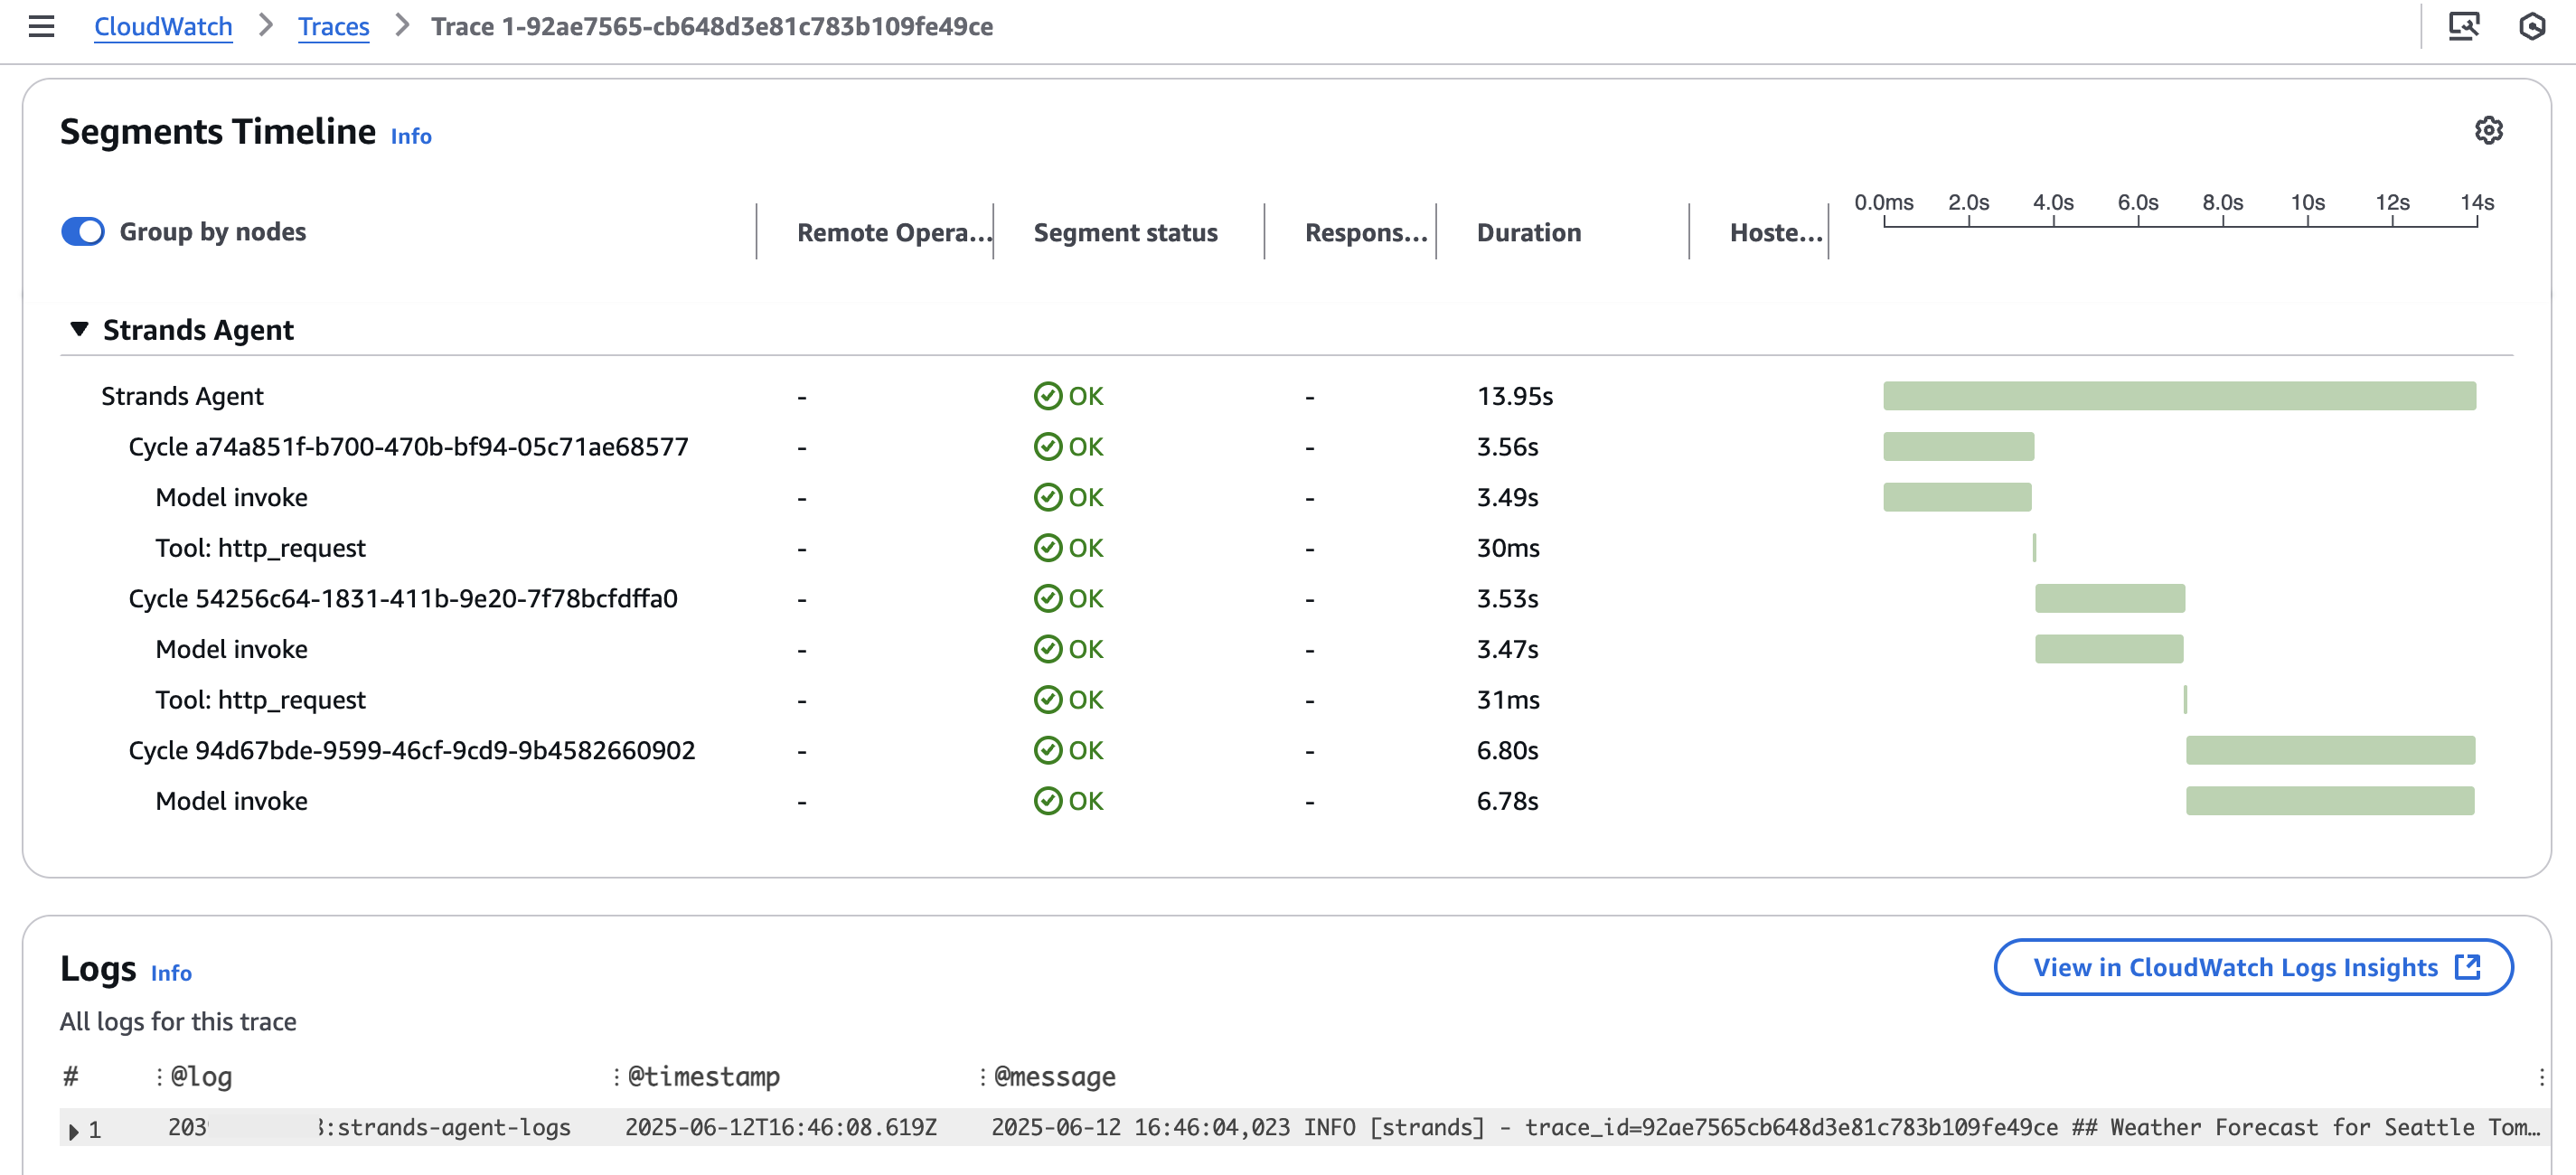
Figure 7 – Spans timeline and correlated logs
- The trace timeline will reveal all the details about the agent’s execution, including the cycles, invoked models, and the tools that were executed. Additionally, you can correlate the application logs with the data captured in the execution trace.
- To view the metadata for a specific step or span in the trace, click on the span to see the full details about the prompt, completion, and result as shown in Figure 8.
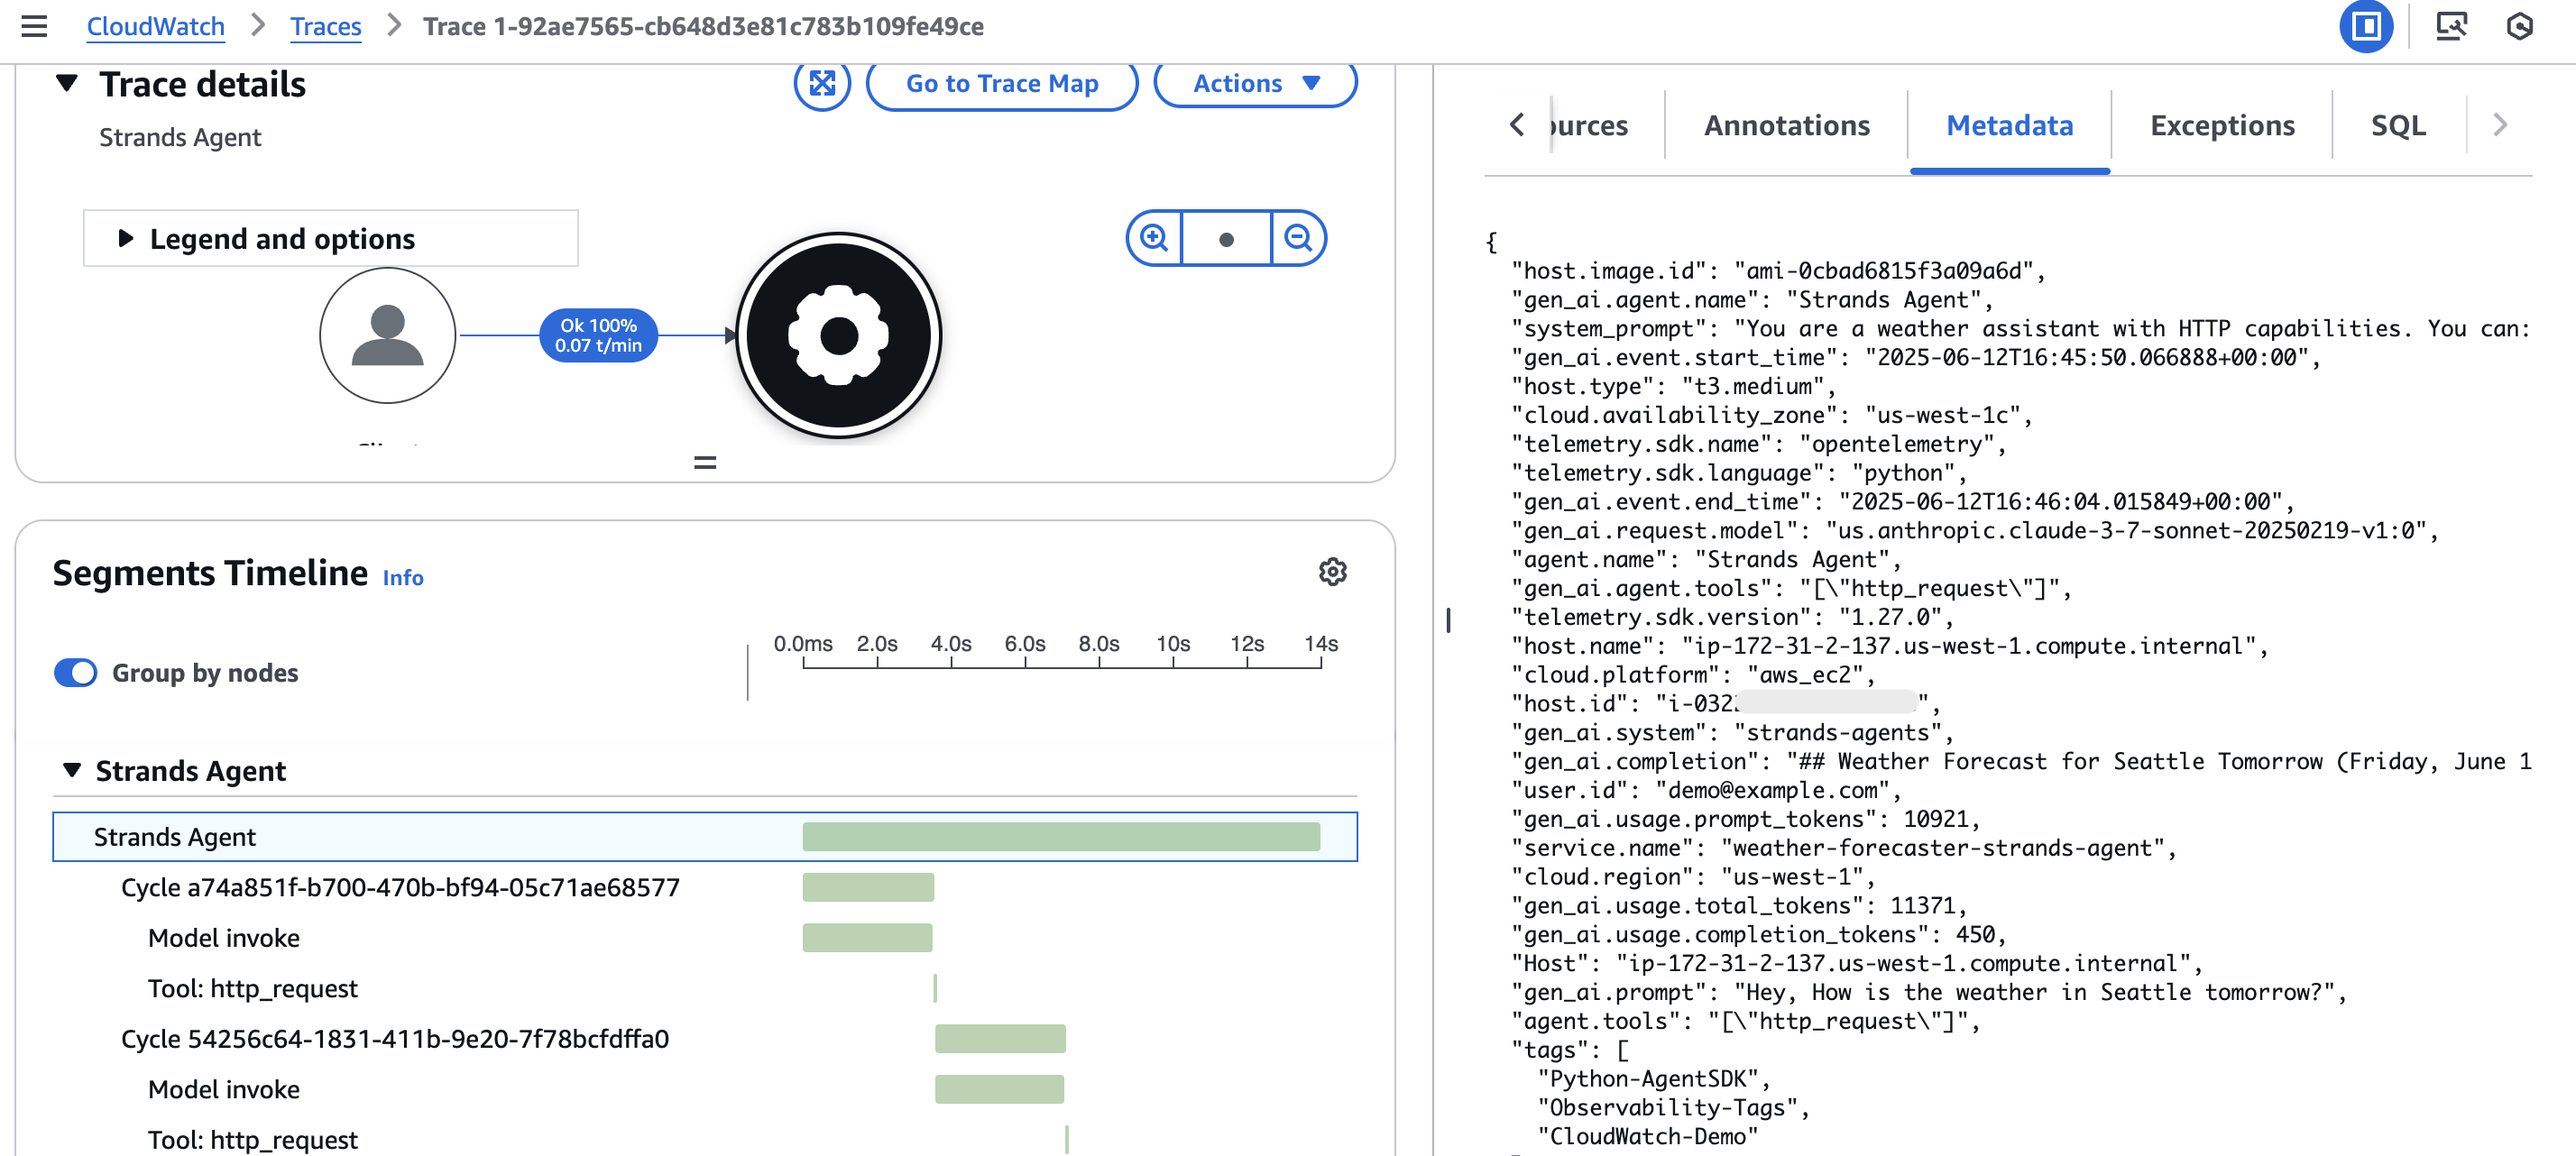
Figure 8 – Span Metadata
Transaction Search
To analyze your spans using the Transaction Search feature in the Application Signals console, follow these steps.
- Navigate to the Transaction Search section within the Application Signals console.
- Add a filter
attributes.user.id = demo@example.comto display all the requests made by the user with that Id as shown in Figure 9.
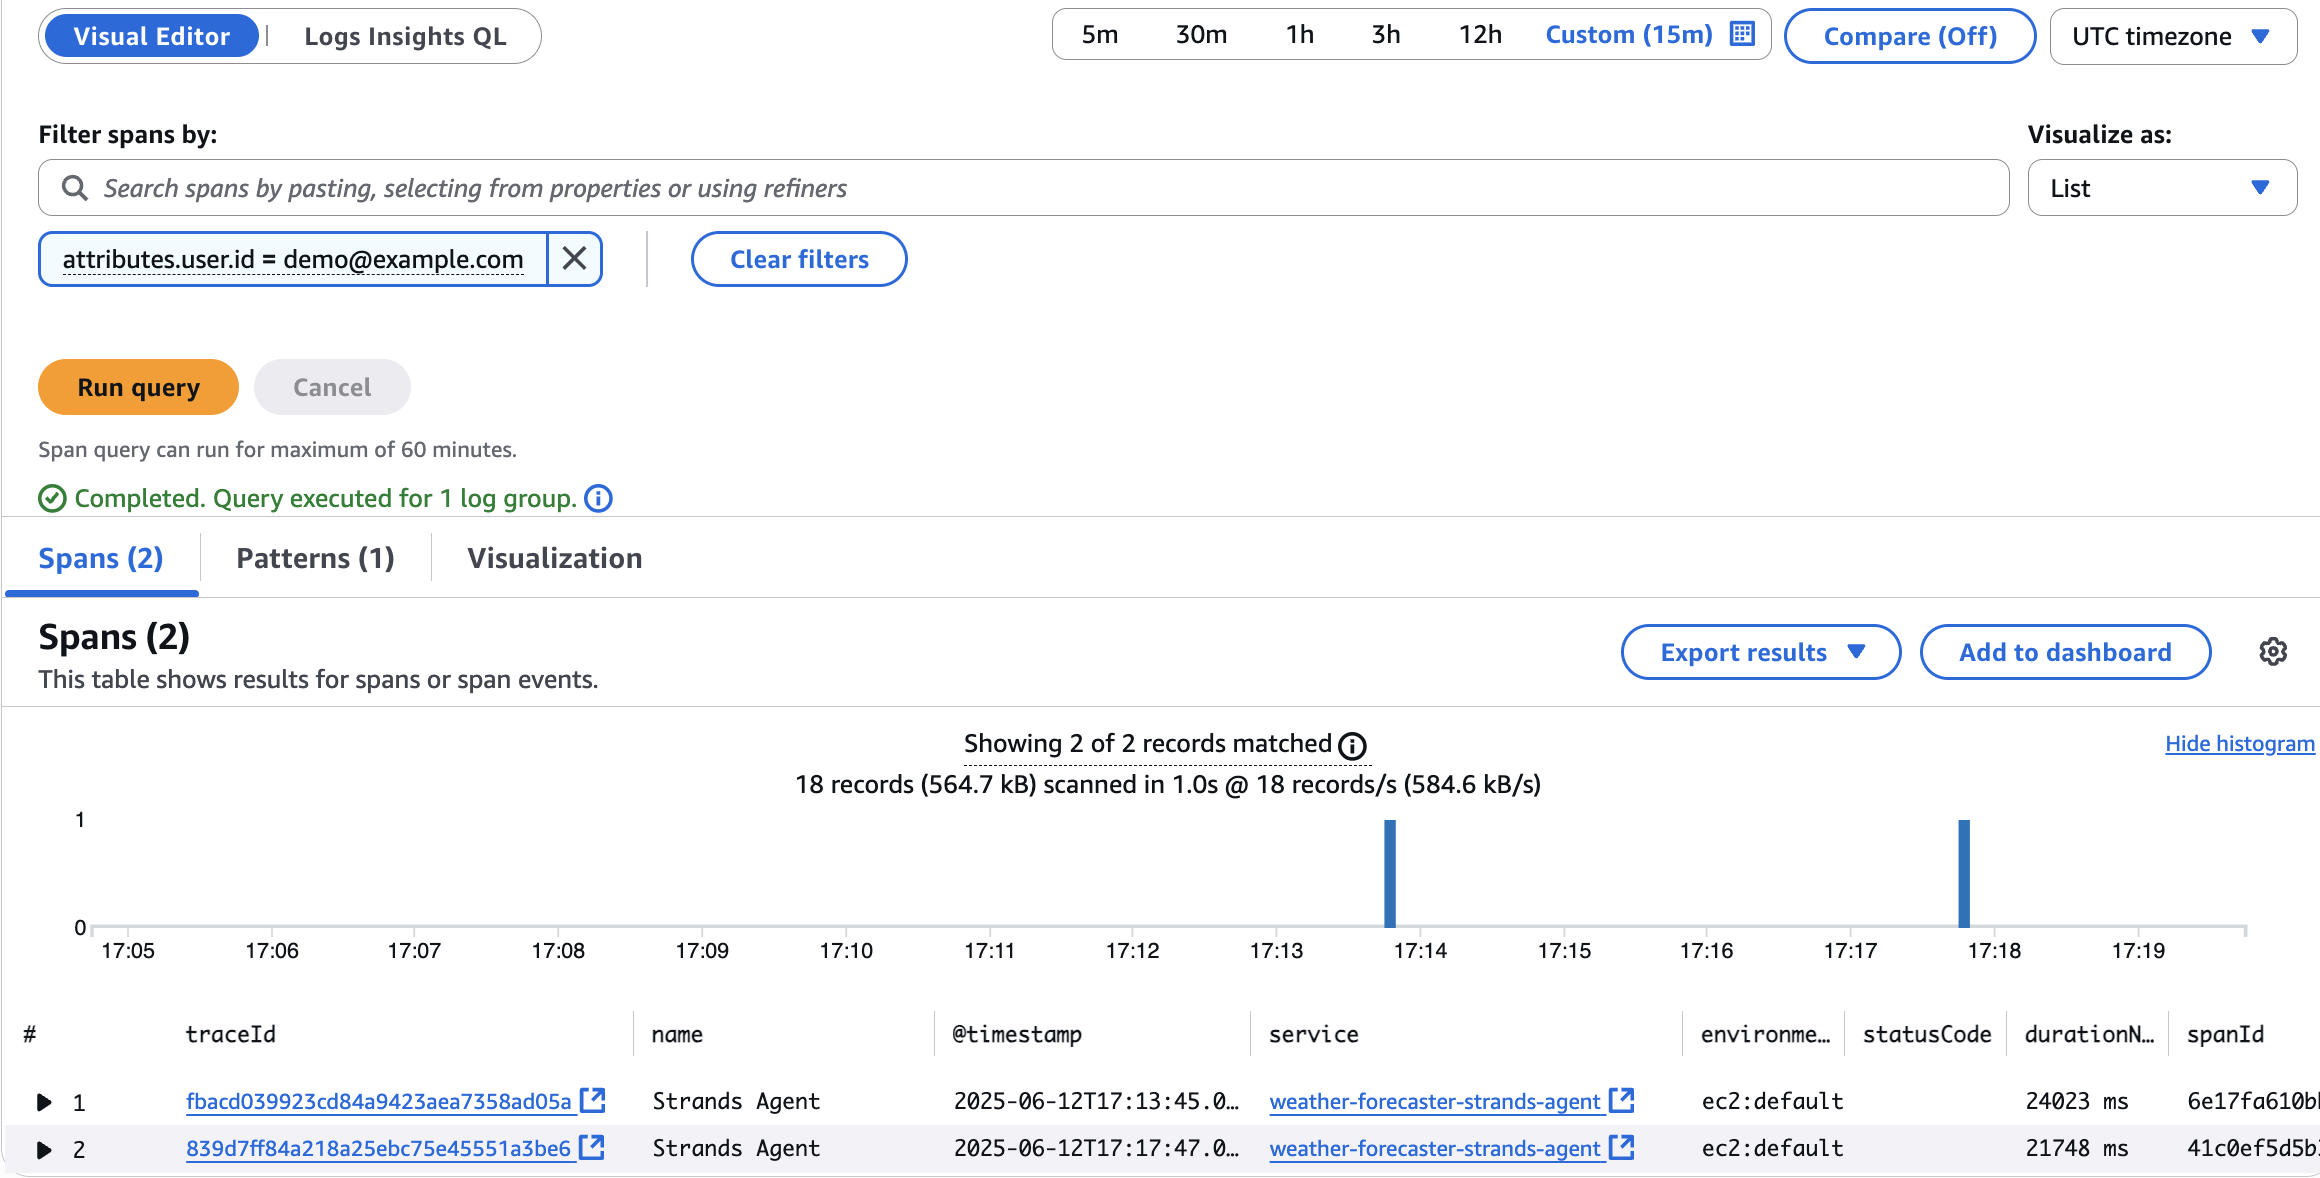
Figure 9 – Filter spans in Transaction Search dashboard
- You can then click on each traceId to dive deeper and analyze the details of that specific request, such as the prompts, completions, and other metadata captured in the spans. This allows you to easily track and investigate the activity of individual users interacting with your agentic AI application.
- In addition to the visual editor, you can also use Logs Insights QL to run advanced queries against the
aws/spanslog group to extract detailed information. For example, you can run a query to retrieve all the prompts where the total token usage was greater than10,000 tokensas shown in Figure 10.
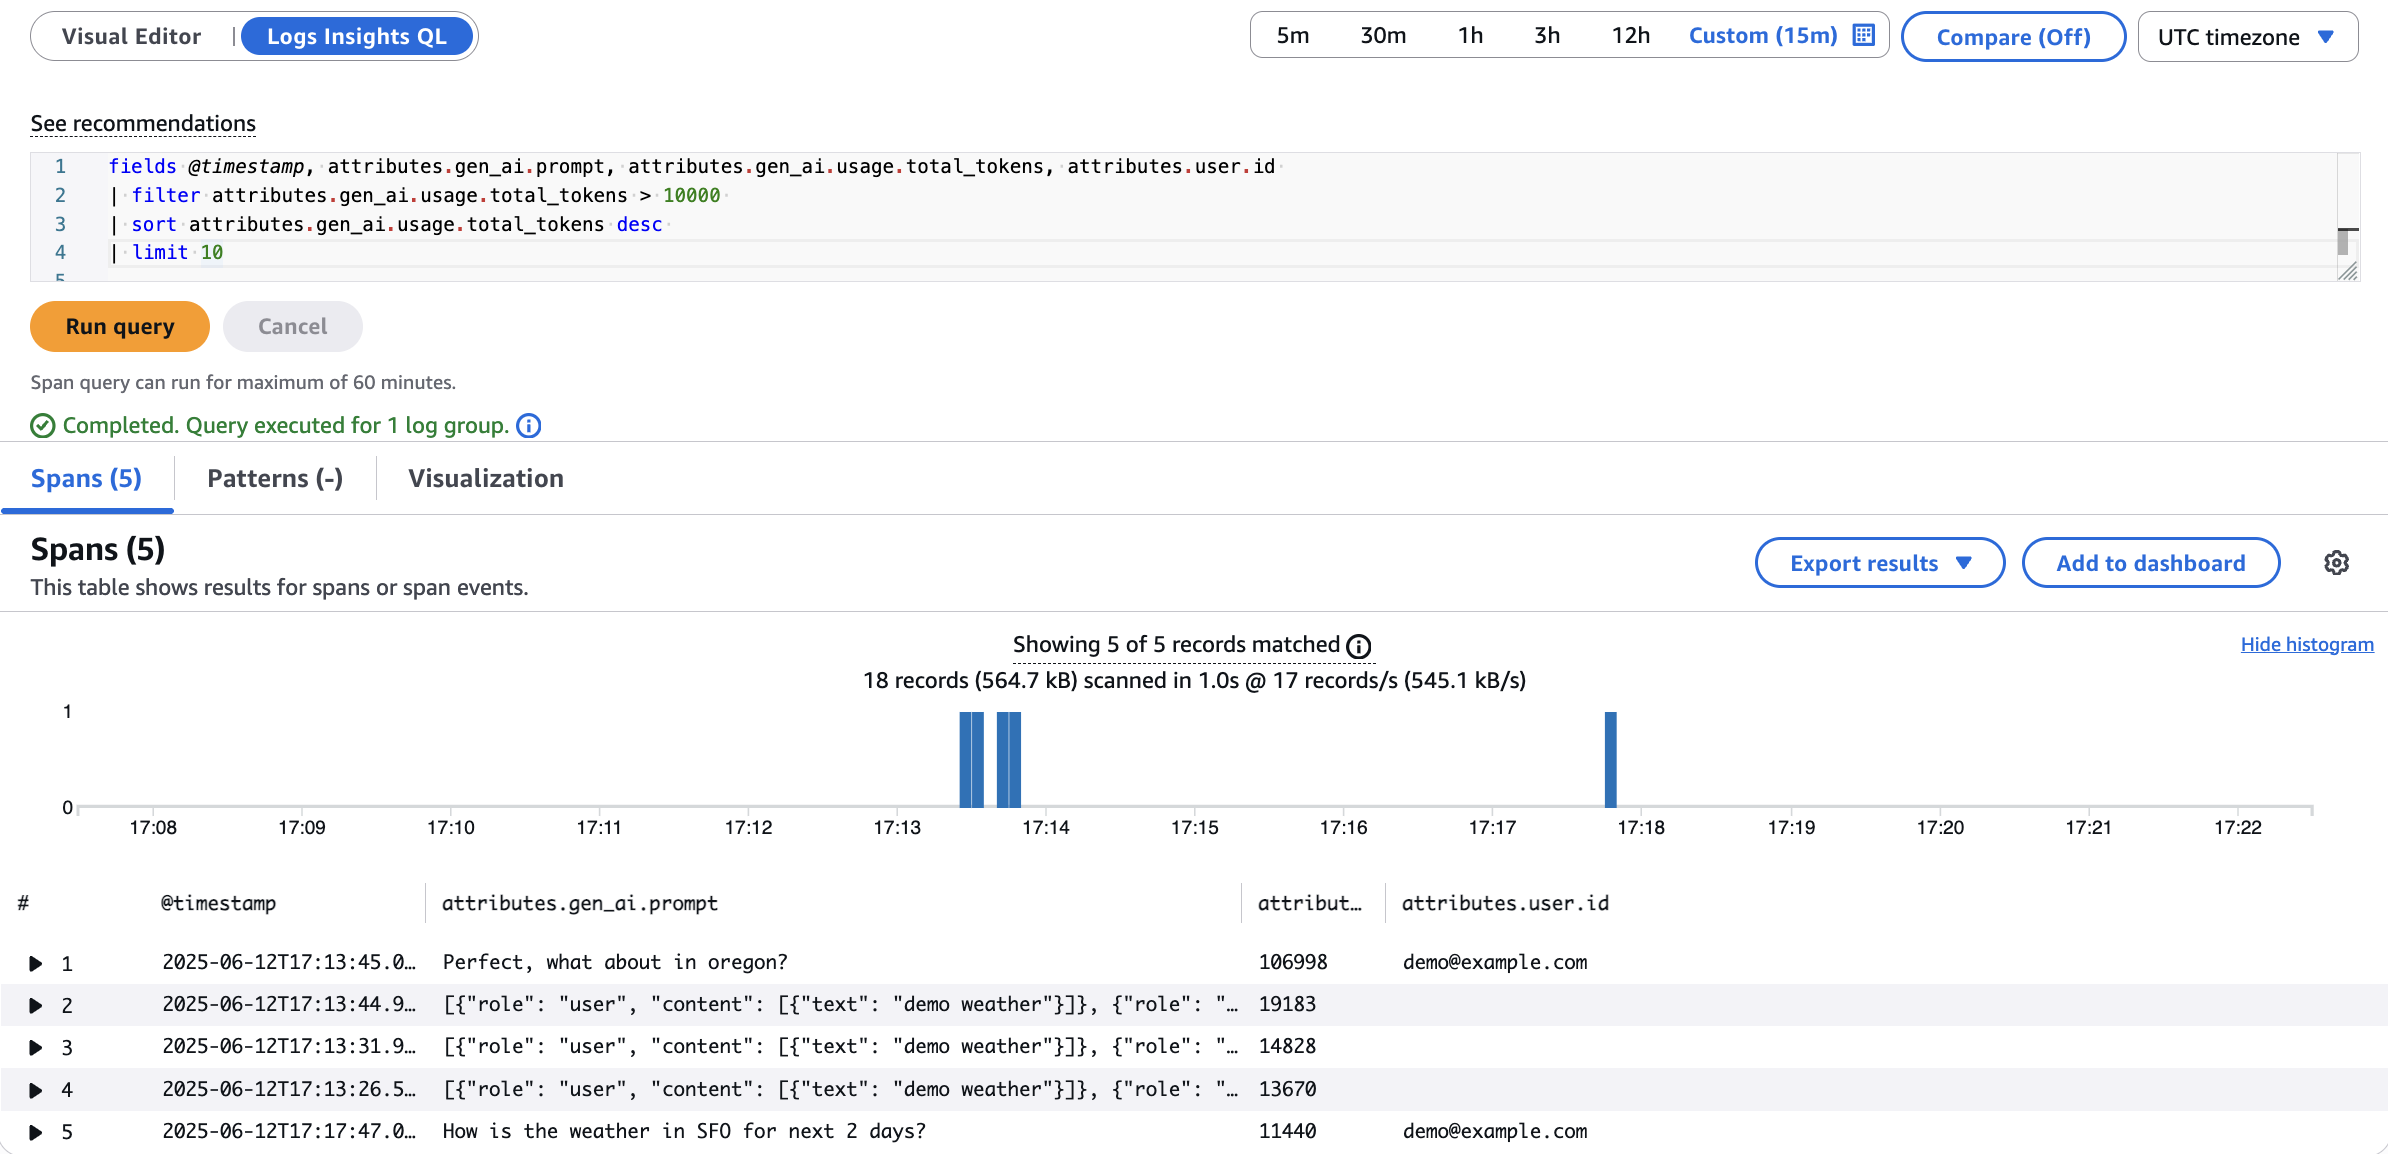
Figure 10 – Run queries using CloudWatch Logs Insights
Application Logs and Metrics
- To access the application logs, navigate to the strands-agents-logs log group in the CloudWatch Log groups.
- Select the latest log stream to view the logs generated by the python agentic application as shown in Figure 11.
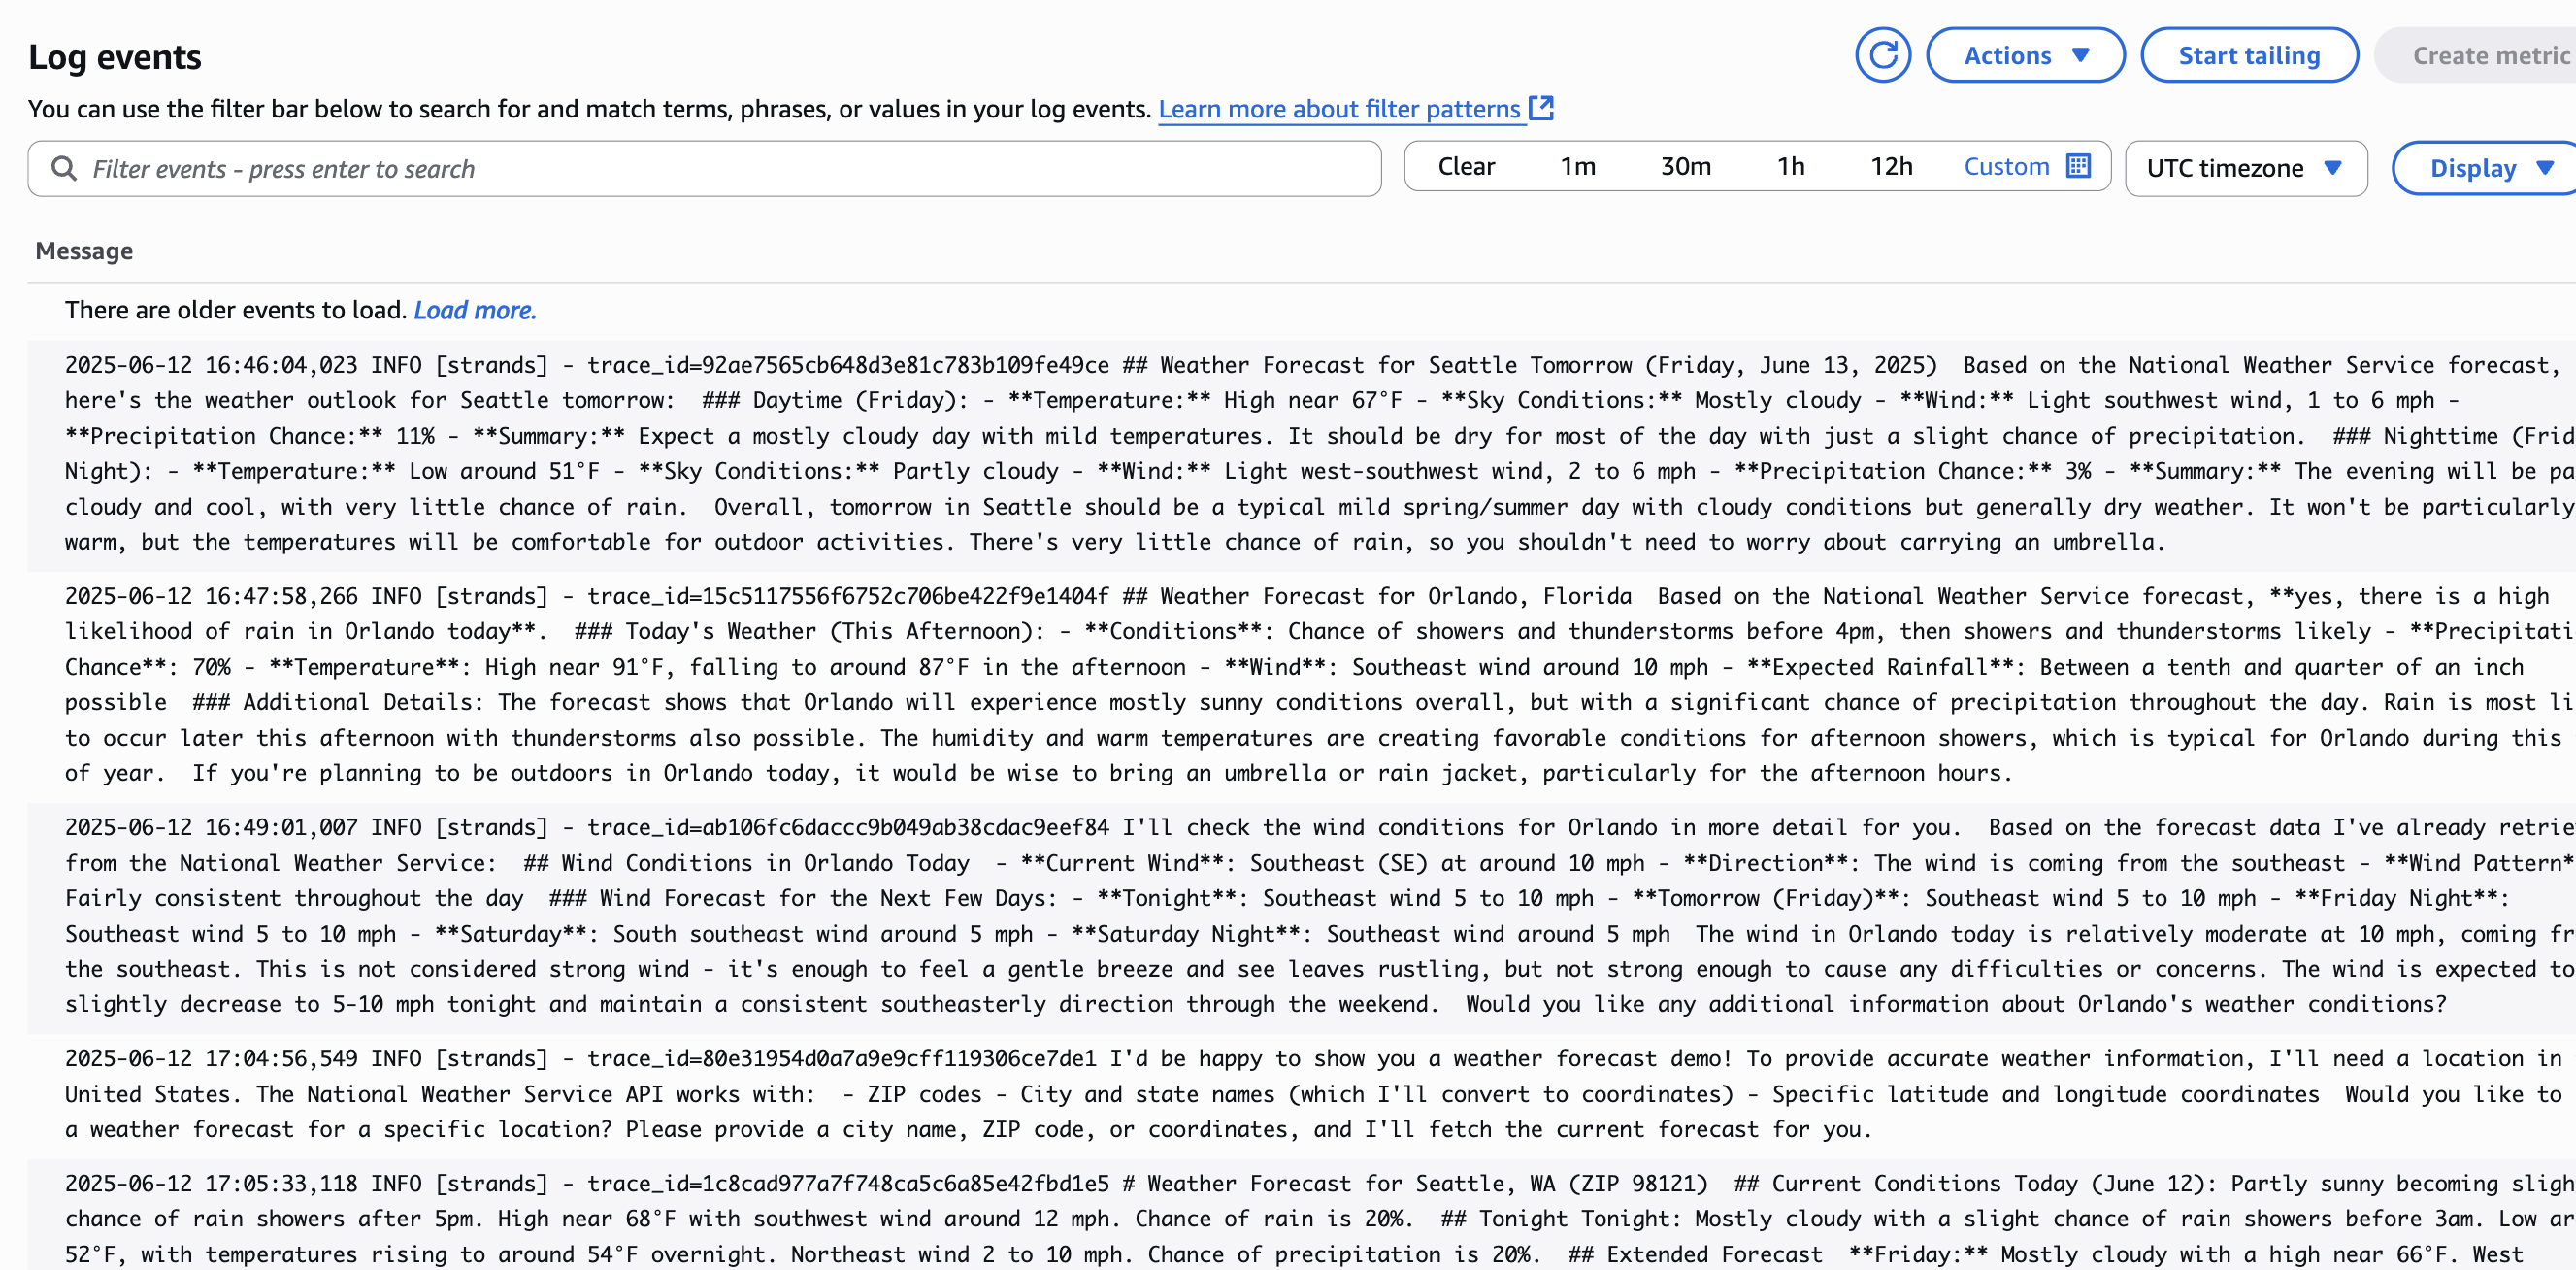
Figure 11 – Application Logs in CloudWatch Logs
- The application-specific metrics, such as Latency, Input and Output tokens, ToolCallCount, ErrorCount, SuccessRate, and TotalCycles, are sent to CloudWatch as Embedded Metric Format (EMF) logs in a separate log group strands-agent-metrics.
- In the CloudWatch console, navigate to the Metrics section and you should see a new namespace StrandsAgentMetrics populated with the custom metrics from the strands-agent-metrics log group as shown in Figure 12.
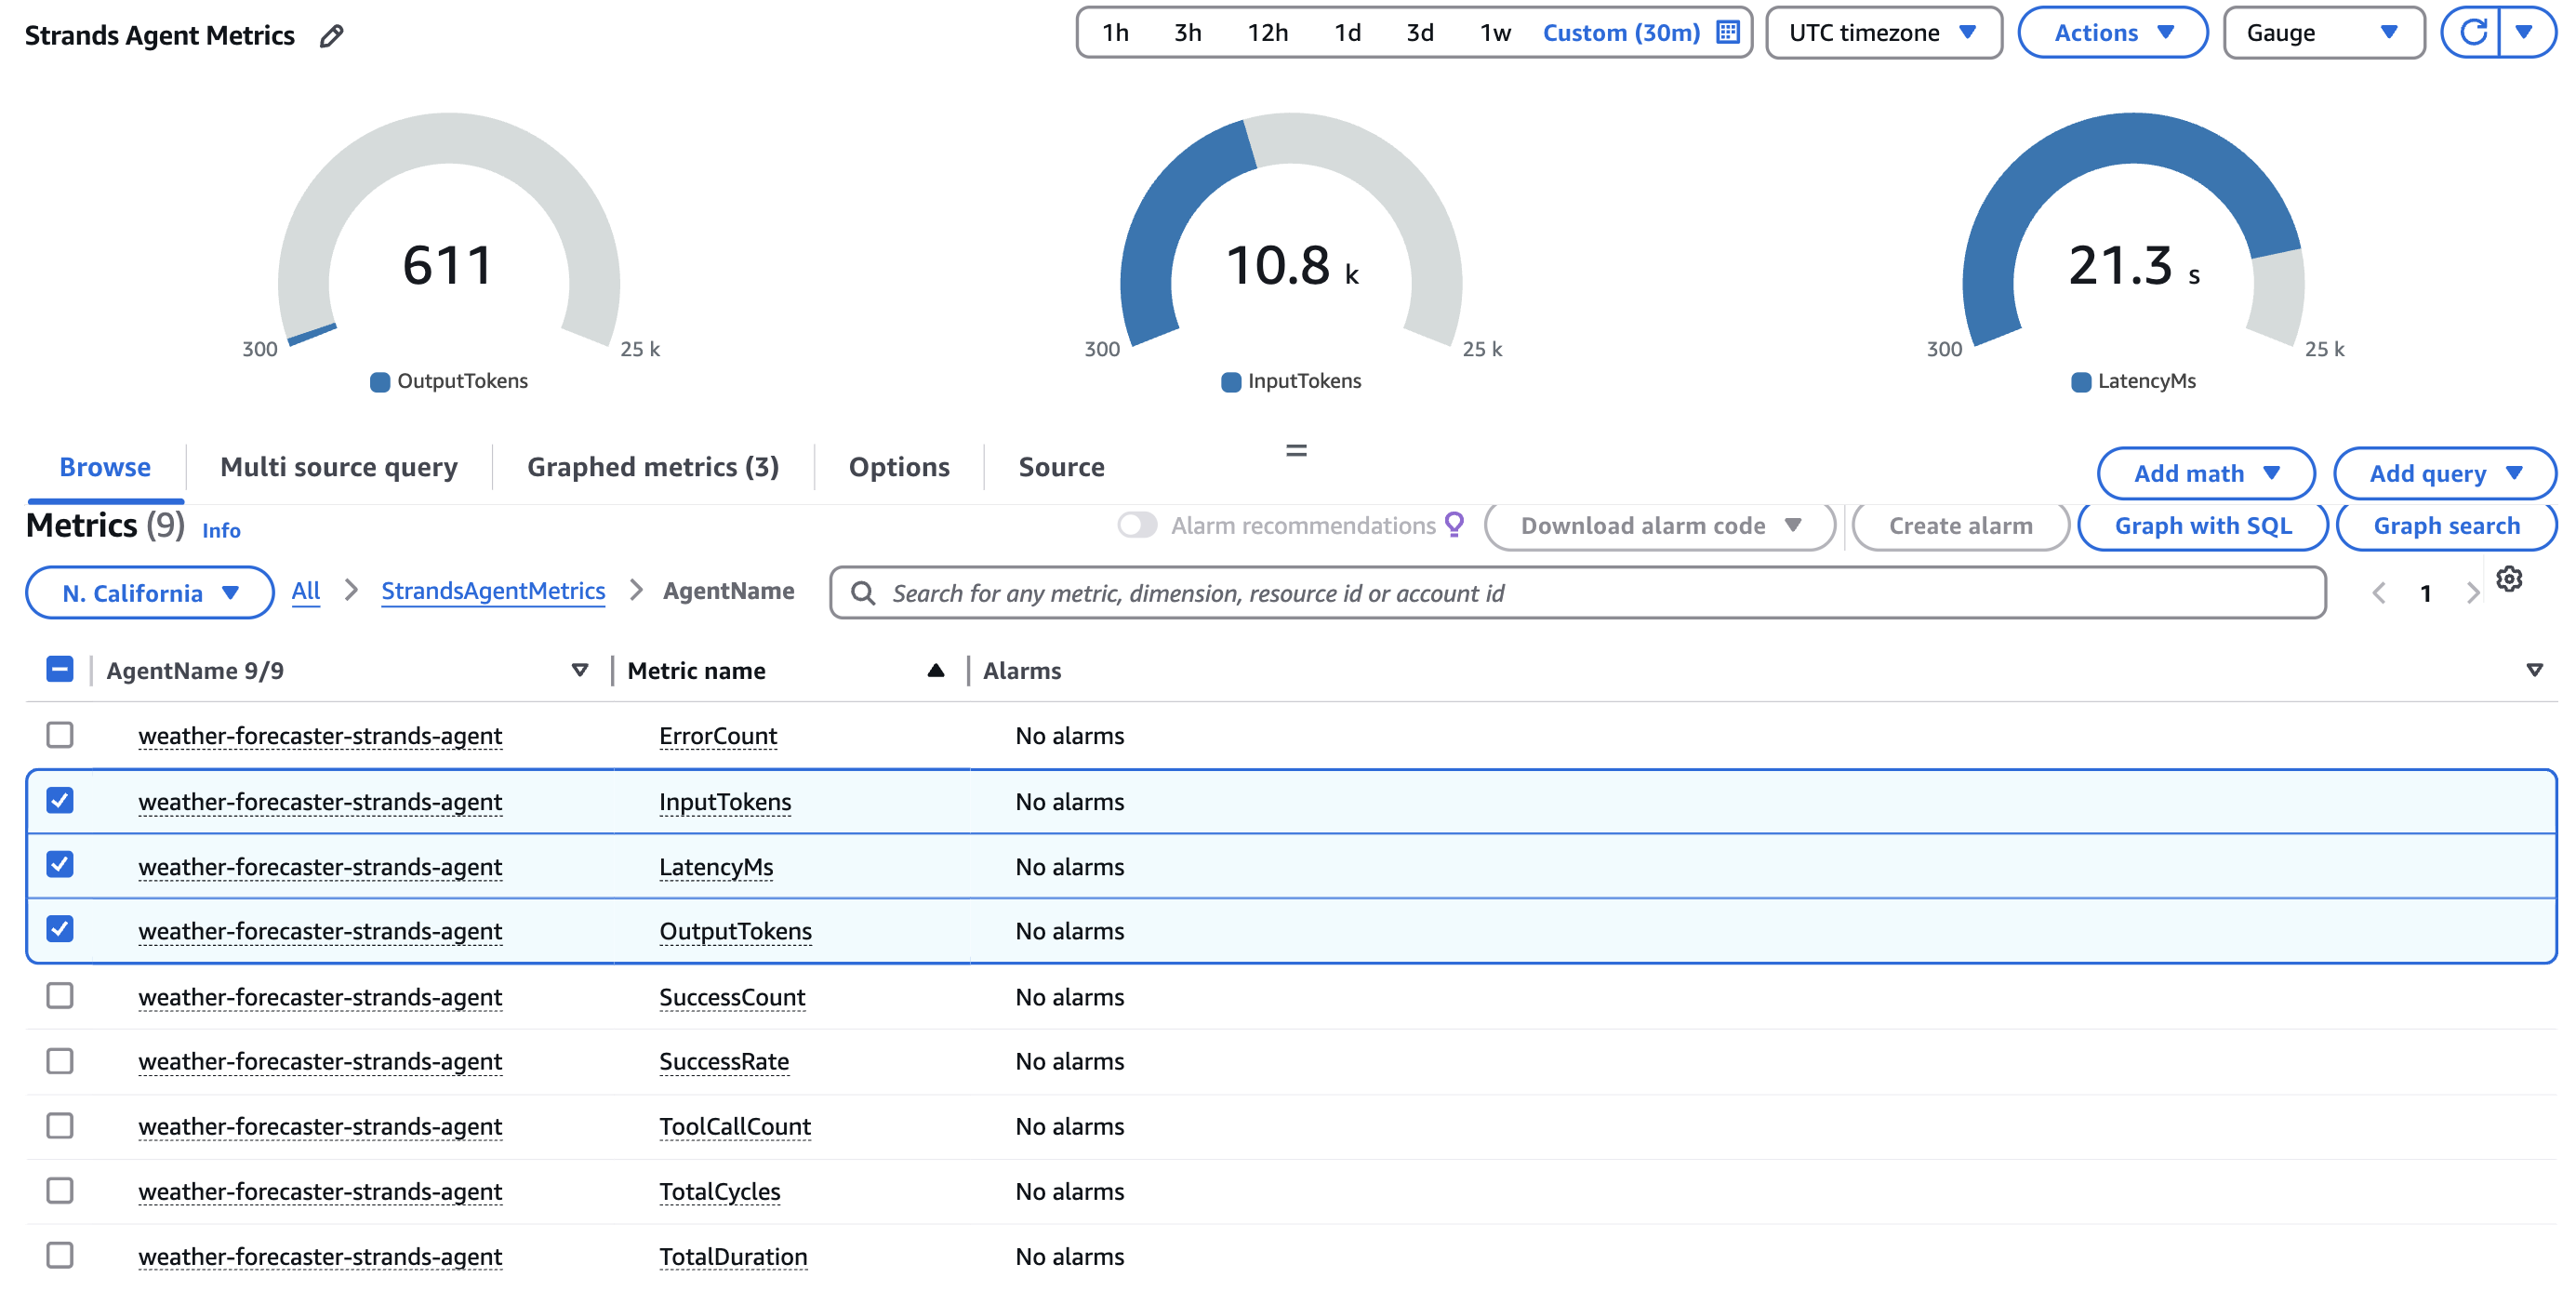
Figure 12 – Application Metrics in CloudWatch Metrics console
- Finally, you can create custom dashboards and alarms in the CloudWatch console to monitor the health and performance of your agentic AI application using the StrandsAgentMetrics custom metrics.
Clean up
- Delete the CloudFormation Stack
- Open the AWS CloudFormation console and in the navigation pane, choose Stacks.
- Choose the CloudFormation stack that you created earlier, select Delete, and Delete stack.
- Disable Transaction Search
- Navigate to Settings in the CloudWatch console.
- Select the X-ray traces followed by Transaction Search.
- Click View Settings and then Edit.
- Remove the checkbox to disable the transaction search feature
- Click Save.
Conclusion
In this blog post, we explored how you can leverage Amazon CloudWatch to observe and gain insights into your agentic AI applications. We demonstrated how the Strands Agents SDK built on the OpenTelemetry standard, can be used to instrument your agentic AI applications to generate valuable telemetry data covering metrics, traces, and logs.
By configuring the CloudWatch agent to collect this telemetry data, we showed how you can ingest and analyze the performance, usage, and execution details of your agentic AI workloads within the CloudWatch console. This allows you to monitor the health and reliability of your applications, troubleshoot any issues that arise, and optimize the performance of your AI-powered workflows.
The key takeaway is that while the specific agentic AI framework you use may vary, the principles of observability remain the same. As long as your application generates telemetry data in an open standard like OpenTelemetry, you can leverage CloudWatch to gain visibility – whether your application runs on EC2, Lambda, ECS, EKS, or any other environment. Simply configure the CloudWatch agent to collect the relevant observability data from your agentic AI workloads.ent