AWS Cloud Operations Blog
Launching Amazon CloudWatch generative AI observability (Preview)
As organizations rapidly deploy large language models (LLMs) and generative AI agents to power increasingly intelligent workloads, they struggle to monitor and troubleshoot the complex interactions within their AI applications. Traditional monitoring tools fall short in providing the visibility across components, leading to developers and AI/ML engineers to manually correlate interaction logs or building custom instrumentation. Engineers face a difficult trade-off between comprehensive monitoring and operational efficiency, as custom solutions prove complex to maintain and scale, while existing tools lack the specialized AI monitoring capabilities.
We are introducing Amazon CloudWatch generative AI observability (Preview), a purpose-built solution for monitoring generative AI applications, regardless of where they run – Amazon Bedrock AgentCore (Preview), Amazon Elastic Kubernetes Service (EKS), Amazon Elastic Container Service (ECS), or on-premises infrastructure. This new capability provides out-of-the-box views and end-to-end tracing across LLMs, agents, knowledge bases, and tools. Within CloudWatch, developers can gain deep insights into the performance, health, and accuracy of their applications and agents, investigate specific traces, and troubleshoot issues across their entire AI stack – from managing a fleet of agents, to analyzing individual model invocations, and down to the underlying infrastructure metrics. This comprehensive visibility helps developers keep their AI agents running smoothly by monitoring and assessing the entire fleet in one centralized location.
Overview
CloudWatch generative AI observability works with open-source agentic frameworks including Strands Agents, LangGraph, and CrewAI that emit telemetry data in a standardized OpenTelemetry (OTEL)-compatible format, offering flexibility in your development choices. The agent-curated view is available in the Bedrock AgentCore tab in the CloudWatch console for genAI observability. The AWS Distro for OpenTelemetry (ADOT) SDK automatically instruments your AI Agents to capture telemetry data without requiring code changes. No additional collectors are needed as all telemetry data is sent directly to CloudWatch OTLP endpoints from the ADOT SDK.
The solution also integrates with existing CloudWatch features such as Application Signals, Alarms, Dashboards, and Logs Insights, providing comprehensive monitoring of both AI applications and underlying infrastructure. This unified approach helps organizations progress confidently from experimentation to production while maintaining high standards of quality, performance, and reliability.
Solution Walkthrough
In this walkthrough, we’ll demonstrate how to implement CloudWatch generative AI observability in two scenarios: for agents hosted on AgentCore runtime and for those running outside of the AgentCore runtime. We’ll use a sample Strands Agent to illustrate both implementations. For implementations with other agentic frameworks, visit AgentCore Observability on Amazon CloudWatch GitHub repository.
Prerequisites
- An AWS account with appropriate permissions to deploy the app
- Python 3.10 or later
- Container runtime (Docker/Finch/Podman) for agent deployment
- Enable Amazon Bedrock model access for
Claude Sonnet 4 - Enable Transaction Search in the CloudWatch console.
Scenario 1: Configure observability for agents hosted on Amazon Bedrock AgentCore runtime
In this scenario, we’ll use the Bedrock AgentCore runtime starter toolkit to quickly prototype and deploy a Strands agent. We will enable observability in the agent code using the AWS Distro for OpenTelemetry (ADOT) SDK as shown in Figure 1
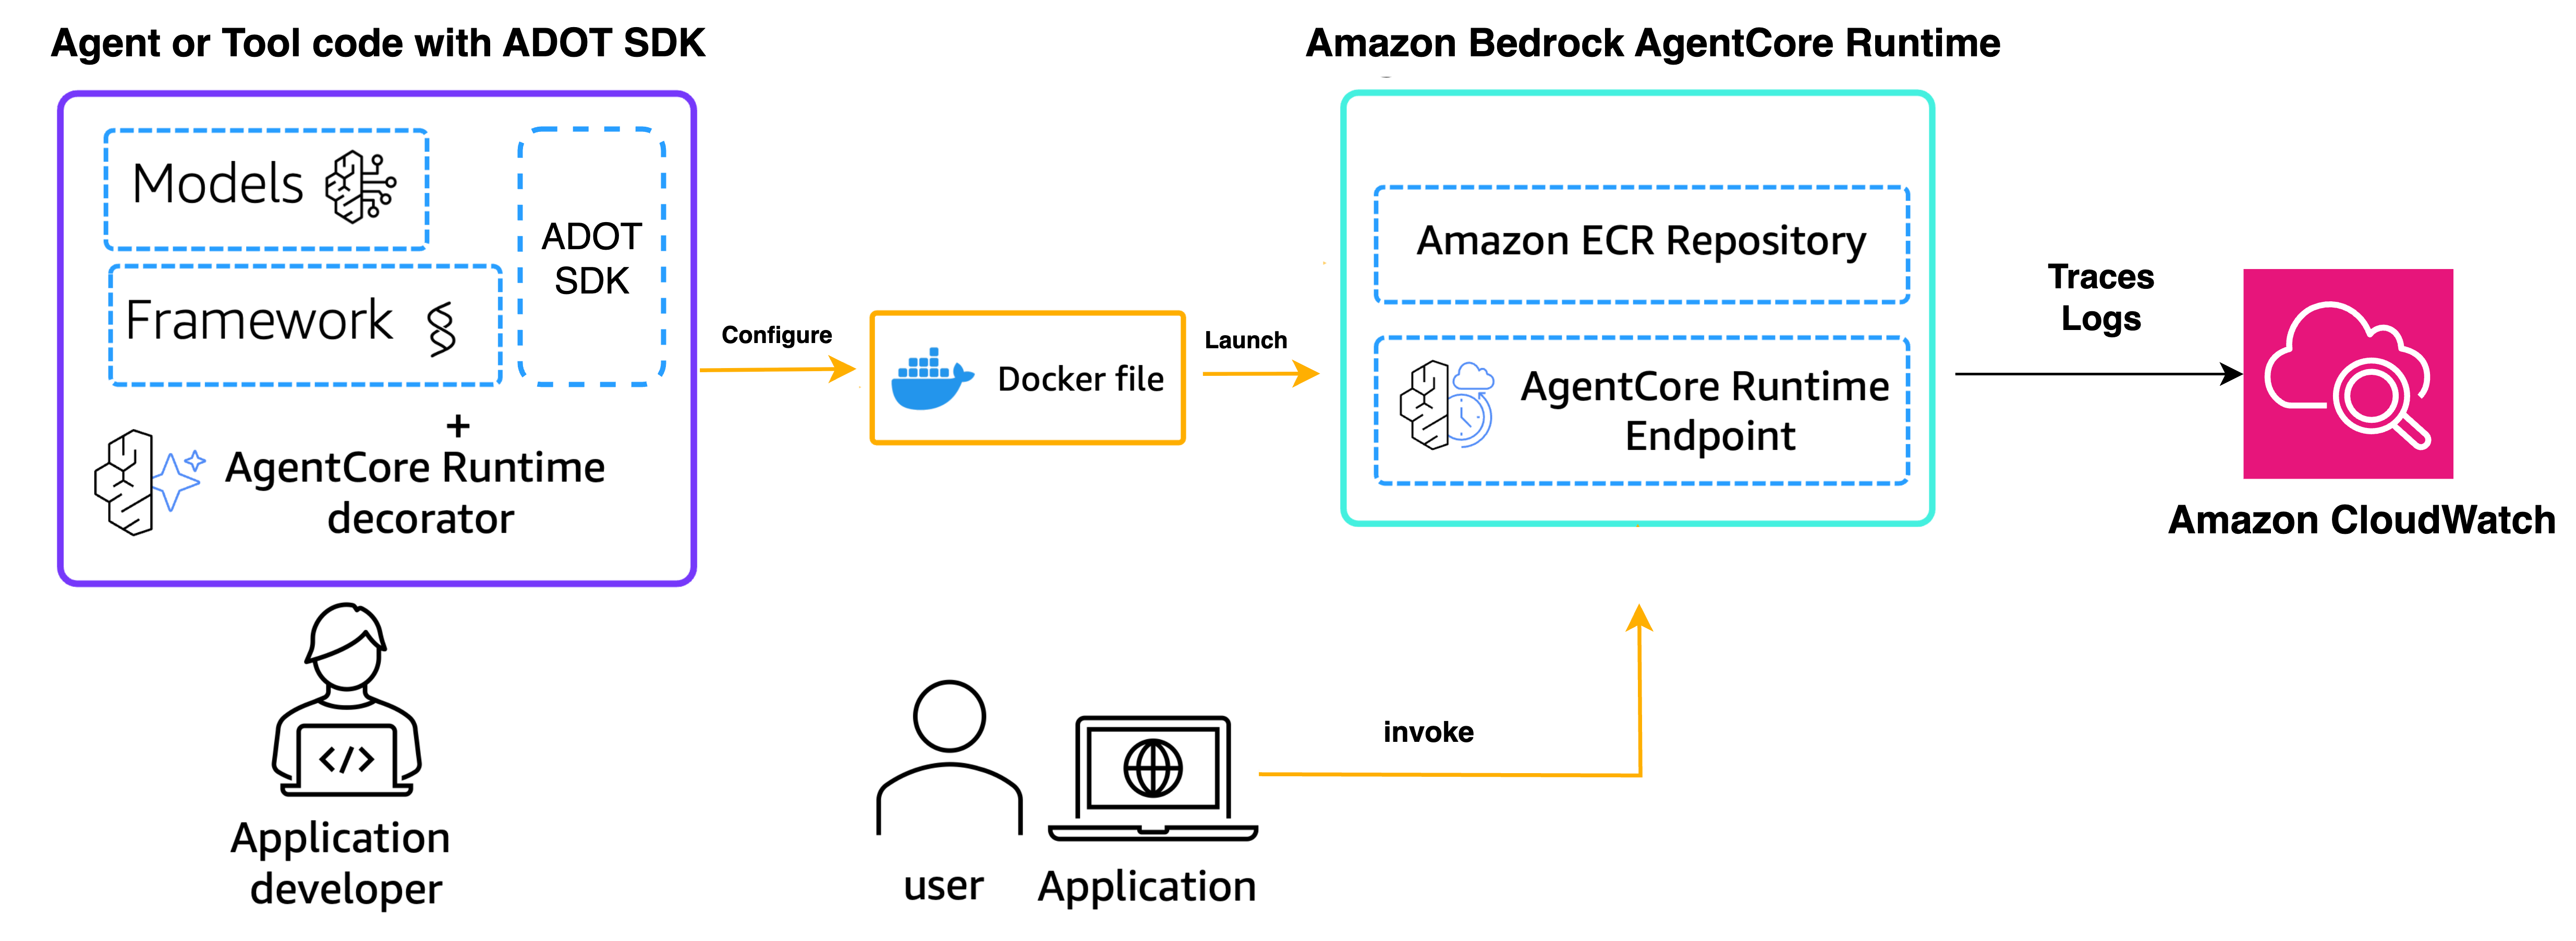 Figure 1: Strands agent hosted in AgentCore with Observability enabled using ADOT SDK
Note: Bedrock AgentCore requires Linux/arm64 – you’ll need either an ARM-based machine or perform the agent deployment from a T4g/M6g ARM based EC2 instance. For non-ARM setups, refer to the custom setup guide.
Step 1: Set up the project structure
- Create a new project directory, e.g., my-strands-agent using below commands.
mkdir my-strands-agent && cd my-strands-agent
touch agent.py
touch requirements.txt
touch __init__.py
Step 2: Prepare agent code and dependencies
- Edit the
agent.pyand copy the below code. Updateregion_namewith the AWS region where you have Claude Sonnet 4 model access enabled.
from strands import Agent, tool
from strands_tools import calculator # Import the calculator tool
import argparse
import json
from bedrock_agentcore.runtime import BedrockAgentCoreApp
from strands.models import BedrockModel

app = BedrockAgentCoreApp()

# Create a custom tool
@tool
def weather():
    """ Get weather """ # Dummy implementation
    return "sunny"

model_id = "us.anthropic.claude-sonnet-4-20250514-v1:0"
model = BedrockModel(
    model_id=model_id,
    region_name="us-east-1" #Specify your AWS region here. Default is us-east-1
)
agent = Agent(
    model=model,
    tools=[calculator, weather],
    system_prompt="You're a helpful assistant. You can do simple math calculation, and tell the weather.",
    trace_attributes={
        "user.id": "demo@example.com",
        "tags": [
            "Python-AgentSDK",
            "Observability-Tags",
            "CloudWatch-Demo"
        ]
    }
)

@app.entrypoint
def strands_agent_bedrock(payload):
    """
    Invoke the agent with a payload
    """
    user_input = payload.get("prompt")
    print("User input:", user_input)
    response = agent(user_input)
    return response.message['content'][0]['text']

if __name__ == "__main__":
app.run()- Edit the
requirements.txtfile and copy the below code
bedrock-agentcore
bedrock-agentcore-starter-toolkit
strands-agents[otel]
strands-agents-tools
aws-opentelemetry-distro>=0.10.0
boto3
Step 3: Configure and deploy the agent
1. Create a virtual python environment and install AgentCore Starter toolkit
# Create and activate virtual environment
python -m venv myenv
source myenv/bin/activate

# Install starter toolkit in virtual environment
pip install bedrock-agentcore-starter-toolkit
2. Create the AgentCore Runtime Execution Role and note down the ARN. We will use it in the next step for deployment.
3. Configure and deploy to AWS.
# Configure your agent
agentcore configure --entrypoint agent.py -n strands_agentcore -r <AWS_REGION> -er <YOUR_IAM_ROLE_ARN>

# Deploy to AWS
agentcore launch
Replace <AWS_REGION> with region name (e.g., us-east-1) and <YOUR_IAM_ROLE_ARN> with the ARN of the IAM role you created earlier.
Step 4: Invoke your agent
# Test your deployment
agentcore invoke '{"prompt": "What is 2+2?"}'
After completing these steps, your Strands agent will be deployed to the Amazon Bedrock AgentCore runtime, and you can observe its performance in the CloudWatch GenAI Observability dashboard.
Scenario 2:- Configure Observability for agents hosted outside of the Amazon Bedrock AgentCore runtime
In this scenario, we’ll walk through the steps to enable observability for agents that are hosted outside the Amazon Bedrock AgentCore runtime. This approach is useful if you have existing agents that you want to monitor using the Bedrock AgentCore observability features. For this demo, we will add the ADOT SDK to the code and invoke the agent in an interactive mode locally.
Step1: Prepare your agent code
- Create a new project directory for local testing.
mkdir strands-agent-local && cd strands-agent-local
python -m venv localenv
source localenv/bin/activate
touch agent-local.py
2. Edit the agent-local.py and copy the below code. Update region_name with the AWS region where you have Claude Sonnet 4 model access enabled.
#!/usr/bin/env python3

from strands import Agent, tool
from strands_tools import calculator
from strands.models import BedrockModel
import logging

# Configure logging
logging.basicConfig(level=logging.INFO)
logger = logging.getLogger(__name__)

# Create a custom tool
@tool
def weather():
    """ Get weather """ # Dummy implementation
    return "sunny"

# Create a Bedrock model
model = BedrockModel(
    model_id="us.anthropic.claude-sonnet-4-20250514-v1:0",
    region_name="us-east-1" #Specify your AWS region here. Default is us-east-1
)

# Create the agent
agent = Agent(
    model=model,
    tools=[calculator, weather],
    system_prompt="You're a helpful assistant. You can do simple math calculation, and tell the weather.",
    trace_attributes={
        "session.id": "abc-1234",
        "user.id": "demo@example.com",
        "tags": [
            "Python-AgentSDK",
            "Observability-Tags",
            "CloudWatch-Demo"
        ]
    }
)

# Example usage
if __name__ == "__main__":
    print("\nStrands Agent with Calculator and Weather\n")
    print("This example demonstrates using Strands Agents with calculator and weather tools.")
    print("\nOptions:")
    print("  'exit' - Exit the program")
    print("\nAsk me to calculate something or check the weather:")
    print("  'What is 25 * 16?'")
    print("  'How's the weather today?'")

    # Interactive loop
    while True:
        try:
            user_input = input("\n> ")

            if user_input.lower() == "exit":
                print("\nGoodbye! ?")
                break

            # Call the agent
            response = agent(user_input)

            # Log the response
            logger.info(str(response))

        except KeyboardInterrupt:
            print("\n\nExecution interrupted. Exiting...")
            break
        except Exception as e:
            print(f"\nAn error occurred: {str(e)}")
            print("Please try a different request.")
Step 2: Install the dependencies
pip install "aws-opentelemetry-distro>=0.10.0" "boto3" "strands-agents[otel]" "strands-agents-tools"Step 3: Setup AWS environment variables
- Replace <placeholders> with your AWS credentials
export AWS_ACCOUNT_ID=<account id>
export AWS_DEFAULT_REGION=<default region>
export AWS_REGION=<region>
export AWS_ACCESS_KEY_ID=<access key id>
export AWS_SECRET_ACCESS_KEY=<secret key>
These environment variables are required for the AWS SDK to interact with the necessary AWS services, such as CloudWatch and X-Ray.
Step 4: Setup OTEL environment variables
- Create an agent log group in CloudWatch (e.g., /aws/bedrock-agentcore/runtimes/strands-agent-local) and log stream (e.g., runtime-logs) which you include in below environment variables.
export AGENT_OBSERVABILITY_ENABLED="true"
export OTEL_PYTHON_DISTRO=aws_distro
export OTEL_PYTHON_CONFIGURATOR=aws_configurator
export OTEL_EXPORTER_OTLP_LOGS_HEADERS="x-aws-log-group=/aws/bedrock-agentcore/runtimes/strands-agent-local,x-aws-log-stream=runtime-logs,x-aws-metric-namespace=bedrock-agentcore"
export OTEL_RESOURCE_ATTRIBUTES="service.name=strands_agent_local,aws.log.group.names=/aws/bedrock-agentcore/runtimes/strands-agent-local"
export OTEL_EXPORTER_OTLP_PROTOCOL="http/protobuf"
export OTEL_TRACES_EXPORTER="otlp"
These environment variables configure the ADOT instrumentation to send telemetry to CloudWatch for observability.
Step 5: Invoke your agent locally
opentelemetry-instrument python agent-local.pyAfter completing these steps, your agent running outside the AgentCore runtime will have observability enabled. You can view the generated metrics, traces, and logs in the CloudWatch GenAI Observability dashboard.
Exploring Generative AI Observability Console
- Navigate to the CloudWatch console and select the GenAI Observability (Preview) section. You’ll find two main dashboards: Model Invocations and Bedrock AgentCore.
- Model Invocations dashboard provides out-of-the-box views to track key metrics related to your generative AI model usage, such as invocation count, token usage, and error rates as shown in Figure 2.
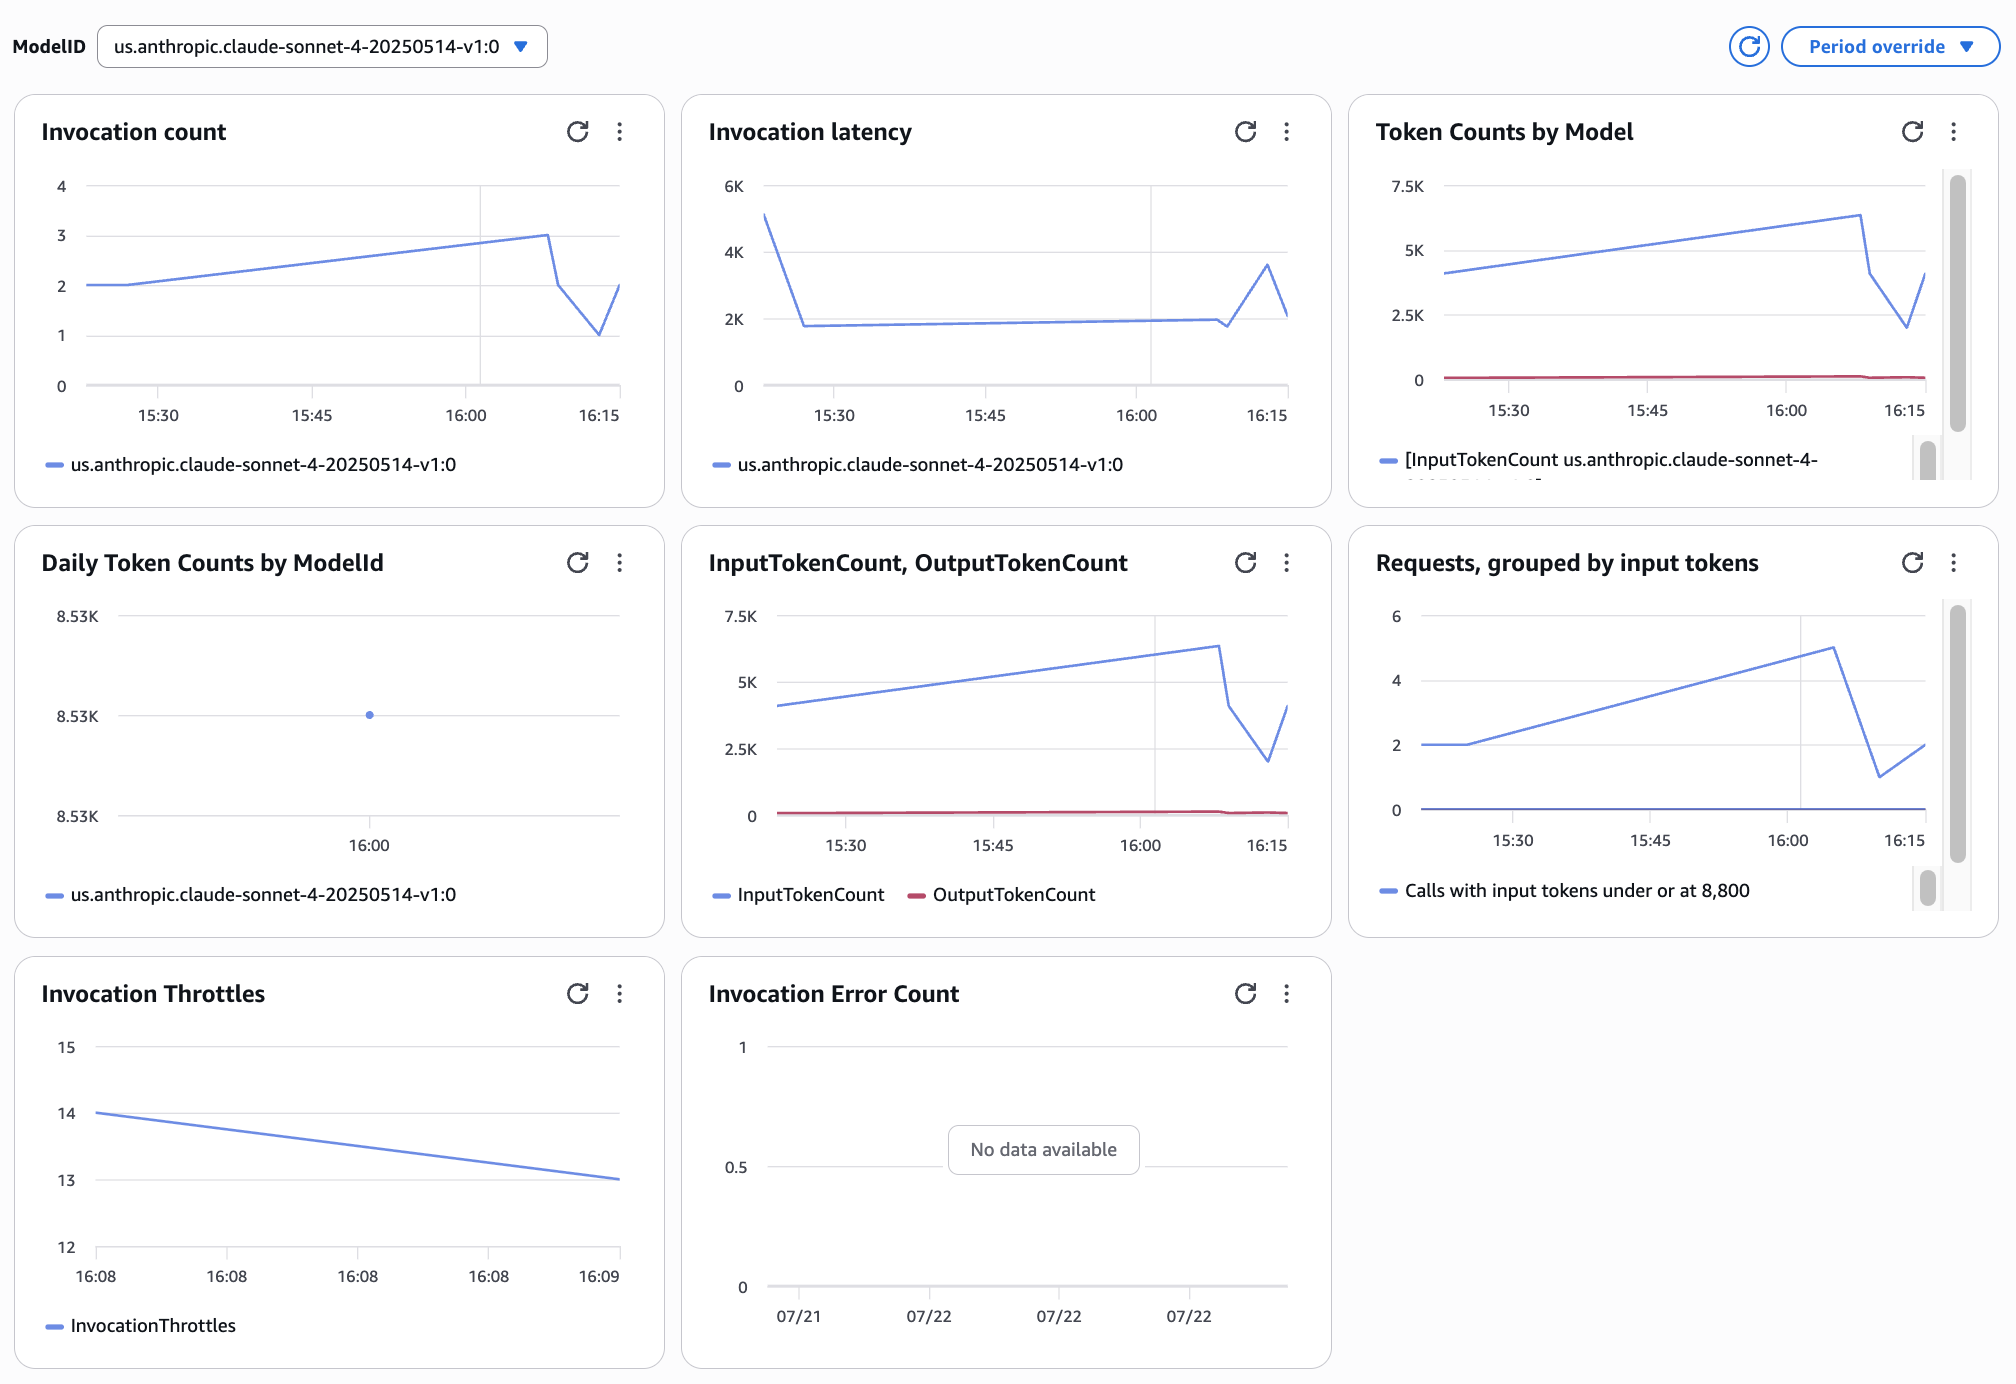
Figure 2: Model Invocation Metrics
To gain more detailed visibility into the model invocation content, including inputs and outputs, you’ll need to enable Model Invocation logging and send the logs to CloudWatch.
- Under Invocations, you can drill down into individual requests by clicking on the Request ID link. This will open a detailed view of the model invocation, showing the input prompt and the model’s response as shown in Figure 3.
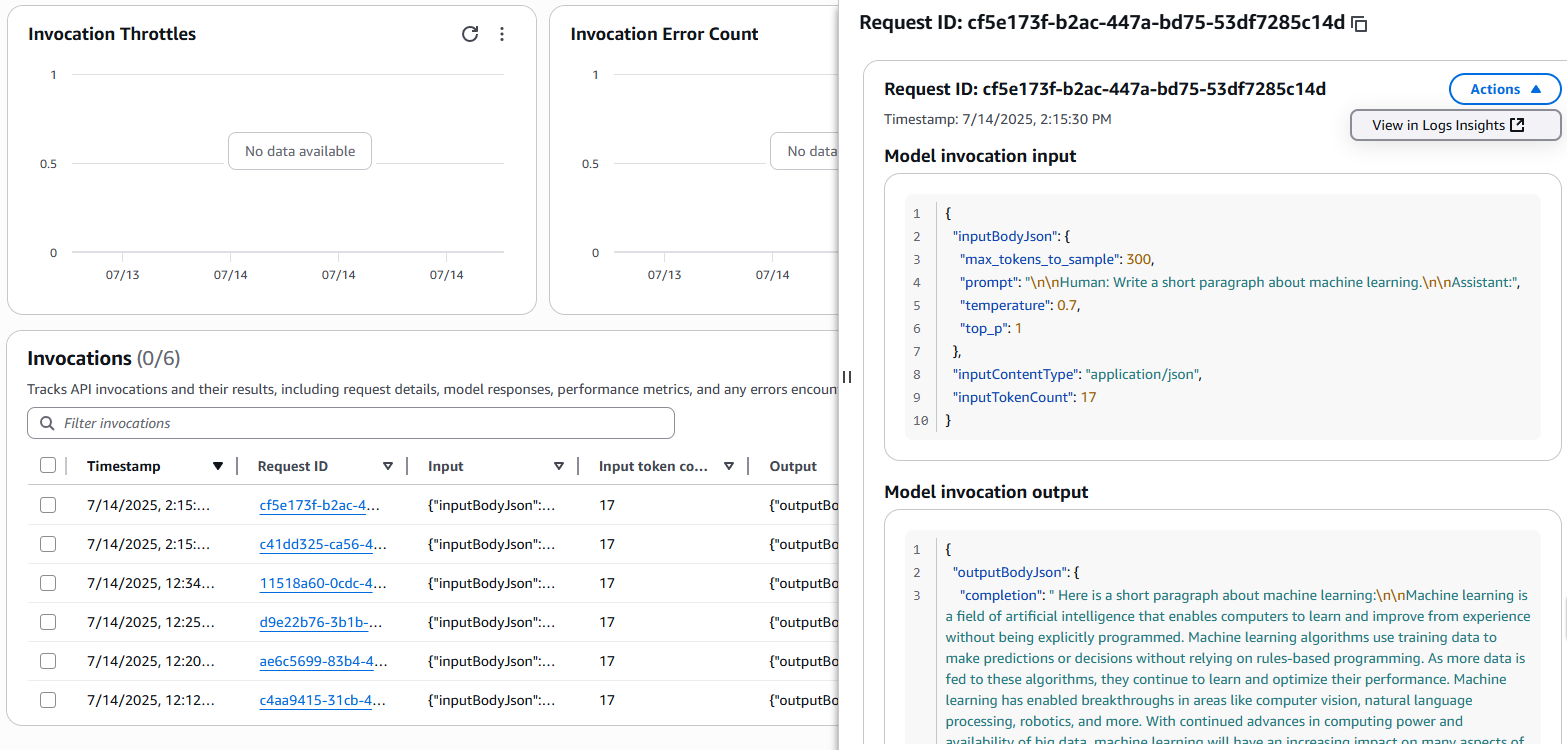
Figure 3: Model Invocation Input and Outputs
- Bedrock AgentCore Agents dashboard allows you to view all your agents with observability enabled. You can filter the data by time frame to analyze agent performance and behavior. Runtime Metrics section displays key metrics related to the AgentCore runtime, such as sessions, invocations, errors, and throttles as shown in Figure 4.
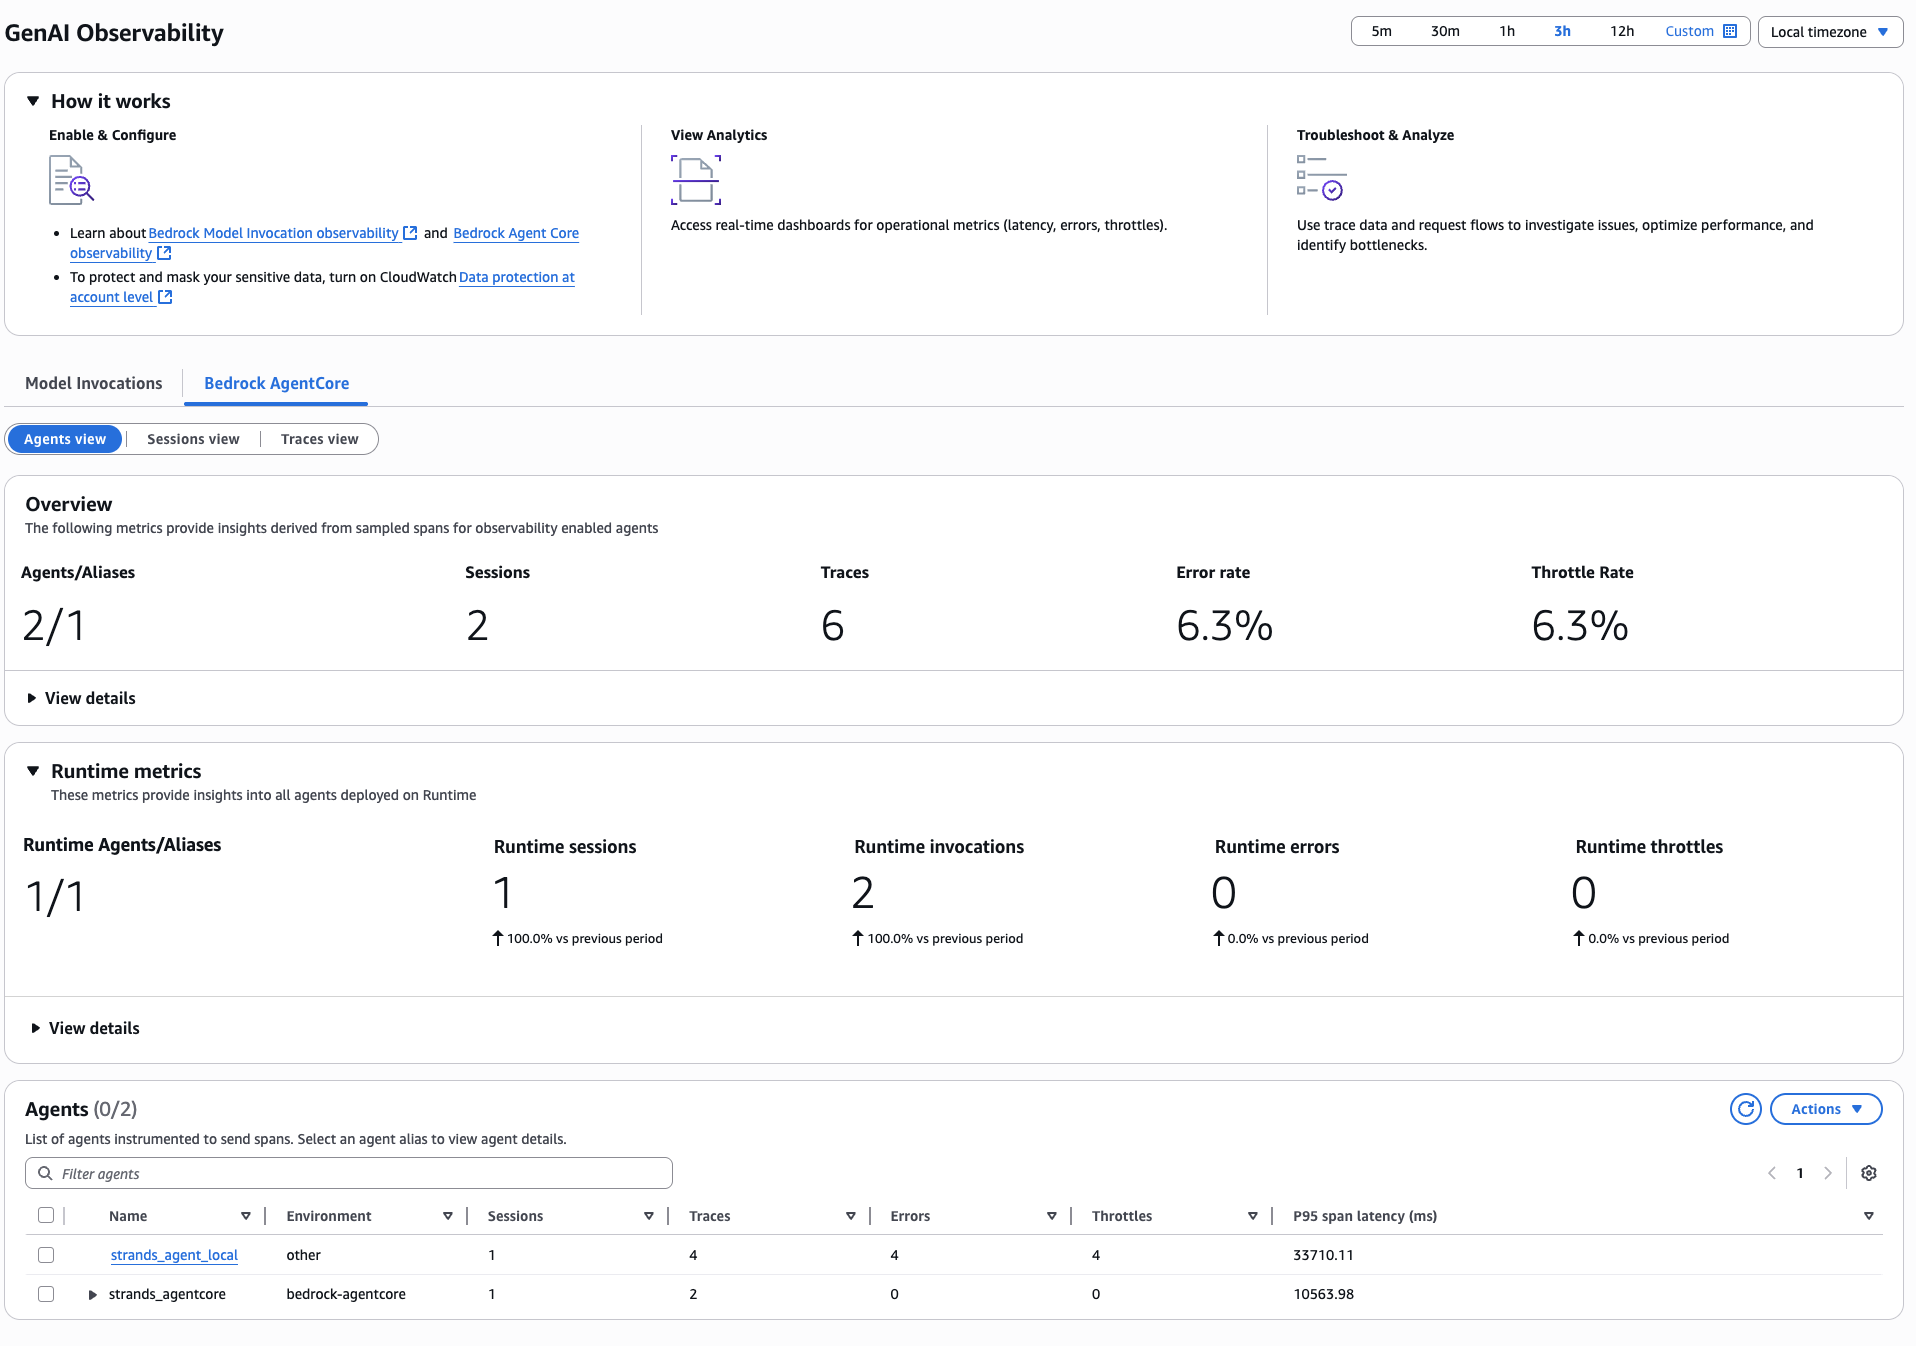
Figure 4: Generative AI Observability dashboard
- Agents view lists all the registered agents, along with their associated metadata and performance metrics. It offers visibility into key metrics like the number of active agents, sessions, traces, errors, and throttles as shown in Figure 5.
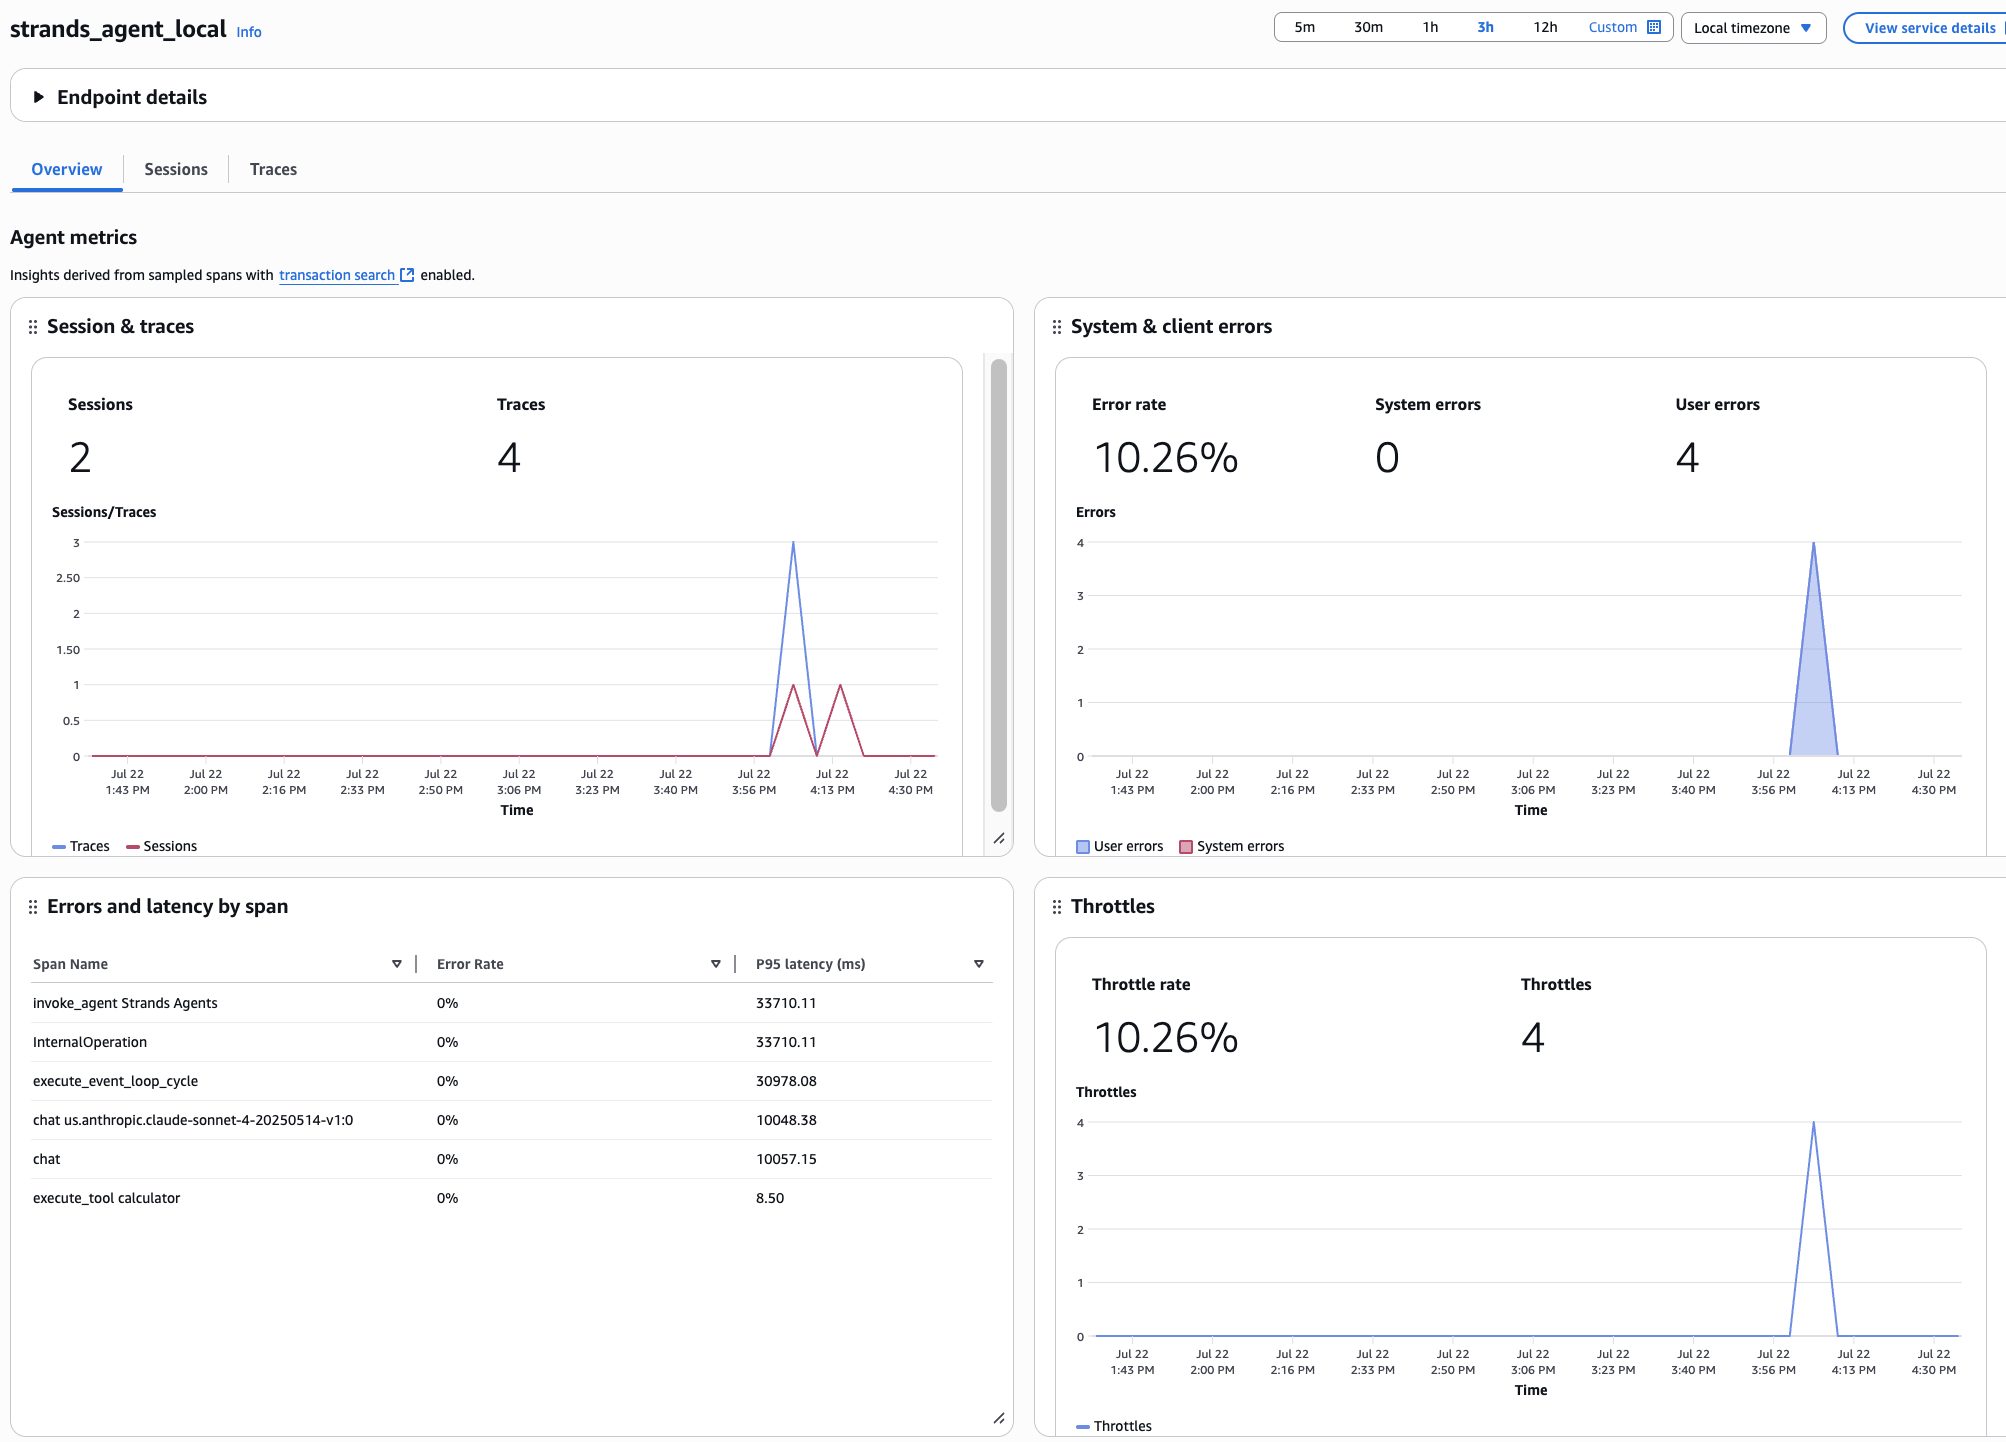
Figure 5: Agents view
- Sessions view provides a view of all the sessions associated with the agents, allowing you to analyze the flow of user interactions and the agent’s responses over time as shown in Figure 6.
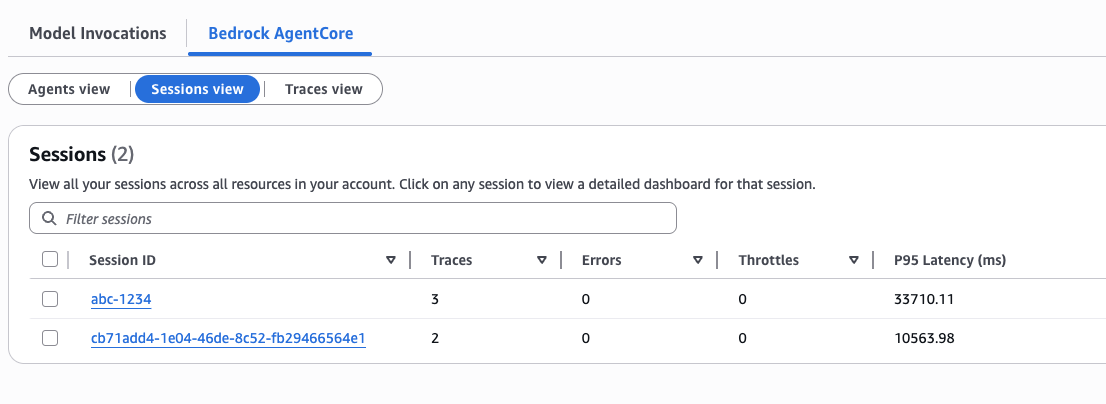
Figure 6: Sessions view
- Traces view presents a comprehensive view of the distributed traces captured for your agent interactions. You can filter and sort the traces to identify performance bottlenecks or understand the end-to-end flow of your agent’s execution as shown in Figure 7.
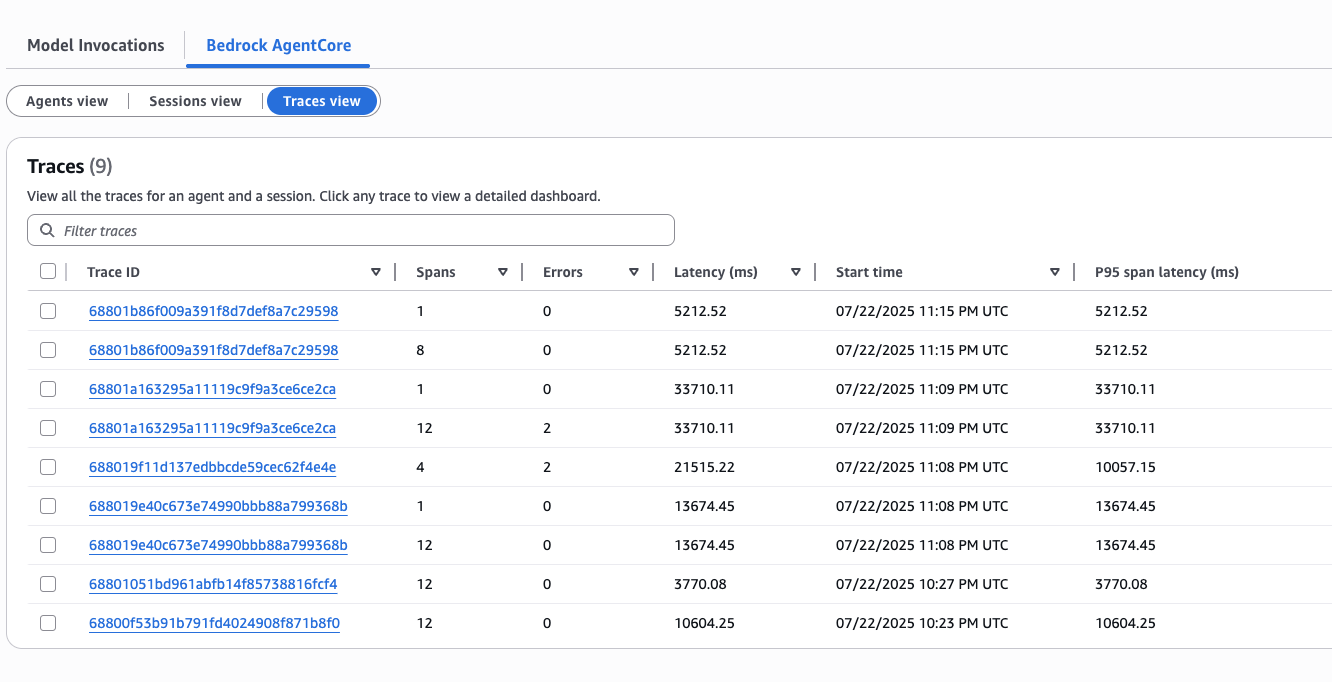
Figure 7: Traces view
You can click on the trace to view the details about each trace and analyze the spans and metadata, and find errors easily from the span timeline as shown in Figure 8.
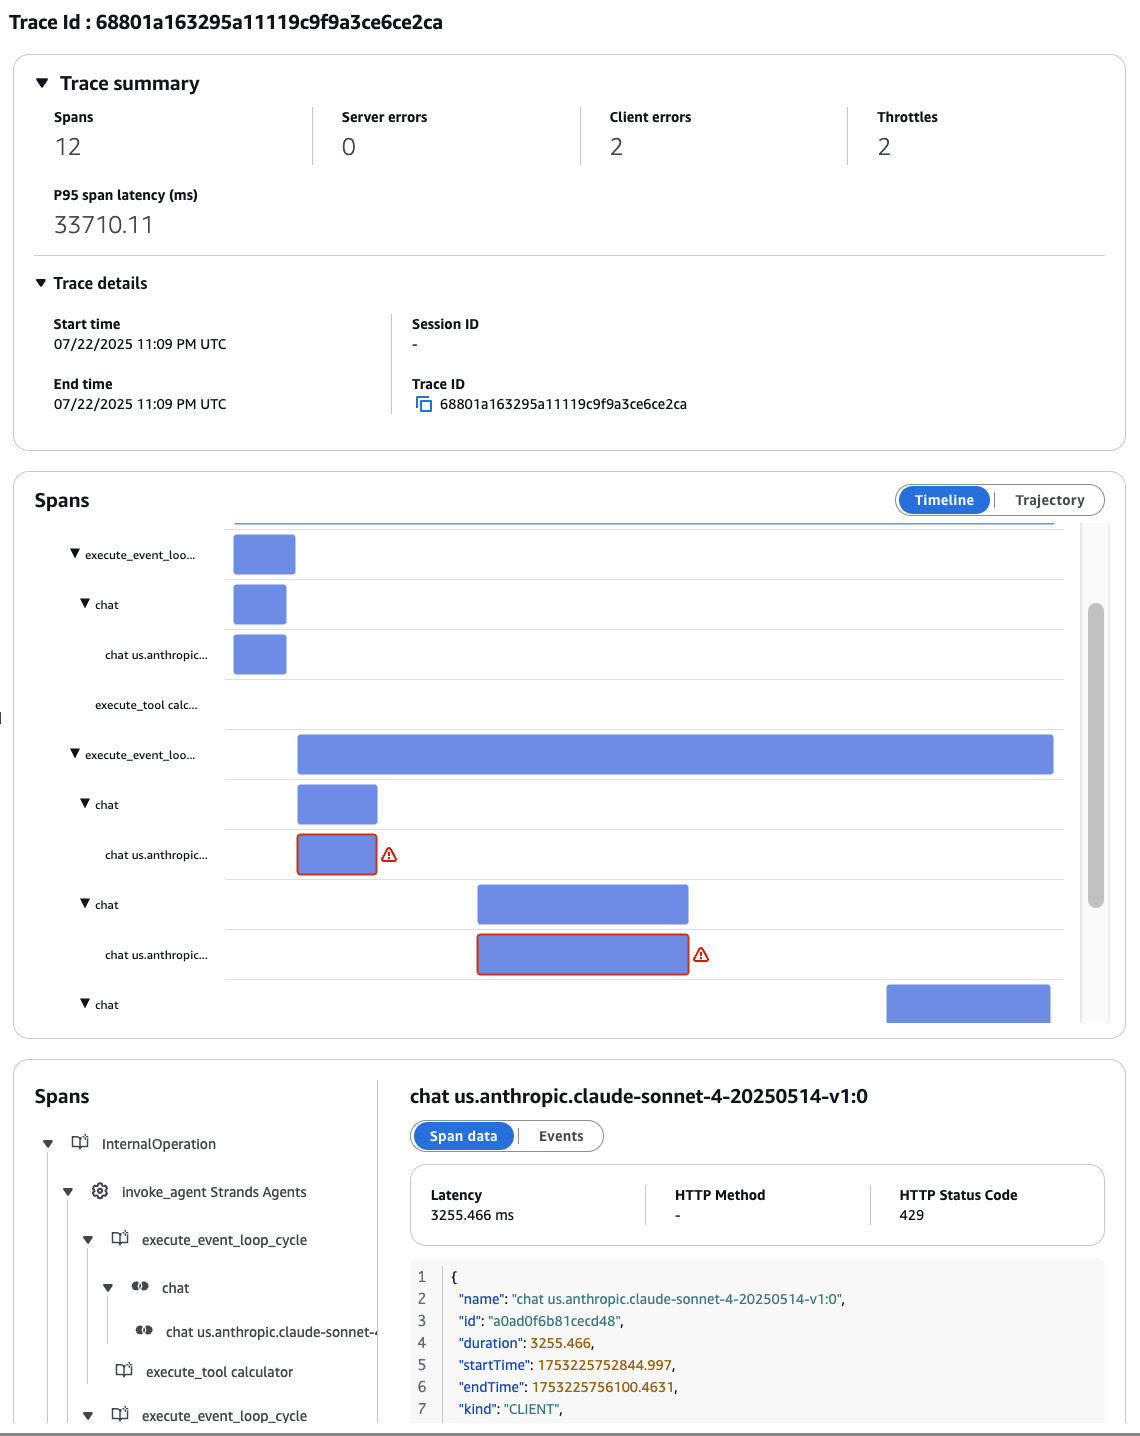
Figure 8: Trace summary and Spans view
- From the Bedrock AgentCore Agents dashboard, you can navigate to the “Application Signals” page in CloudWatch as shown in Figure 9.
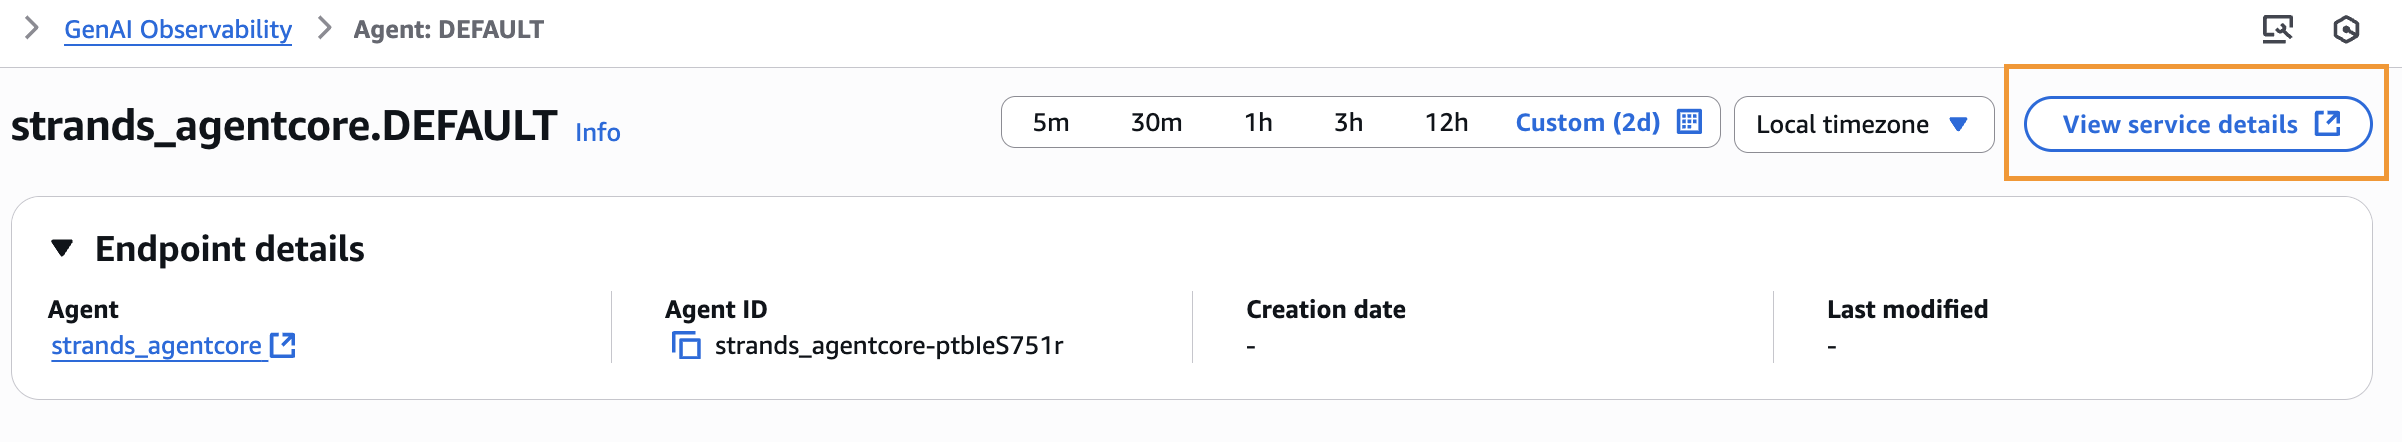
Figure 9: Navigating to service details
10. The Application Signals dashboard offers enhanced observability capabilities. It provides the ability to view call volume, availability, latency, faults, and errors, which give insights into the performance and health of your application.
Additionally, the dashboard displays related service operations and dependencies, providing a comprehensive view of your application’s architecture. Furthermore, the dashboard correlates the observed spans with the corresponding timestamps, allowing you to easily pinpoint and analyze performance issues as shown in Figure 10.
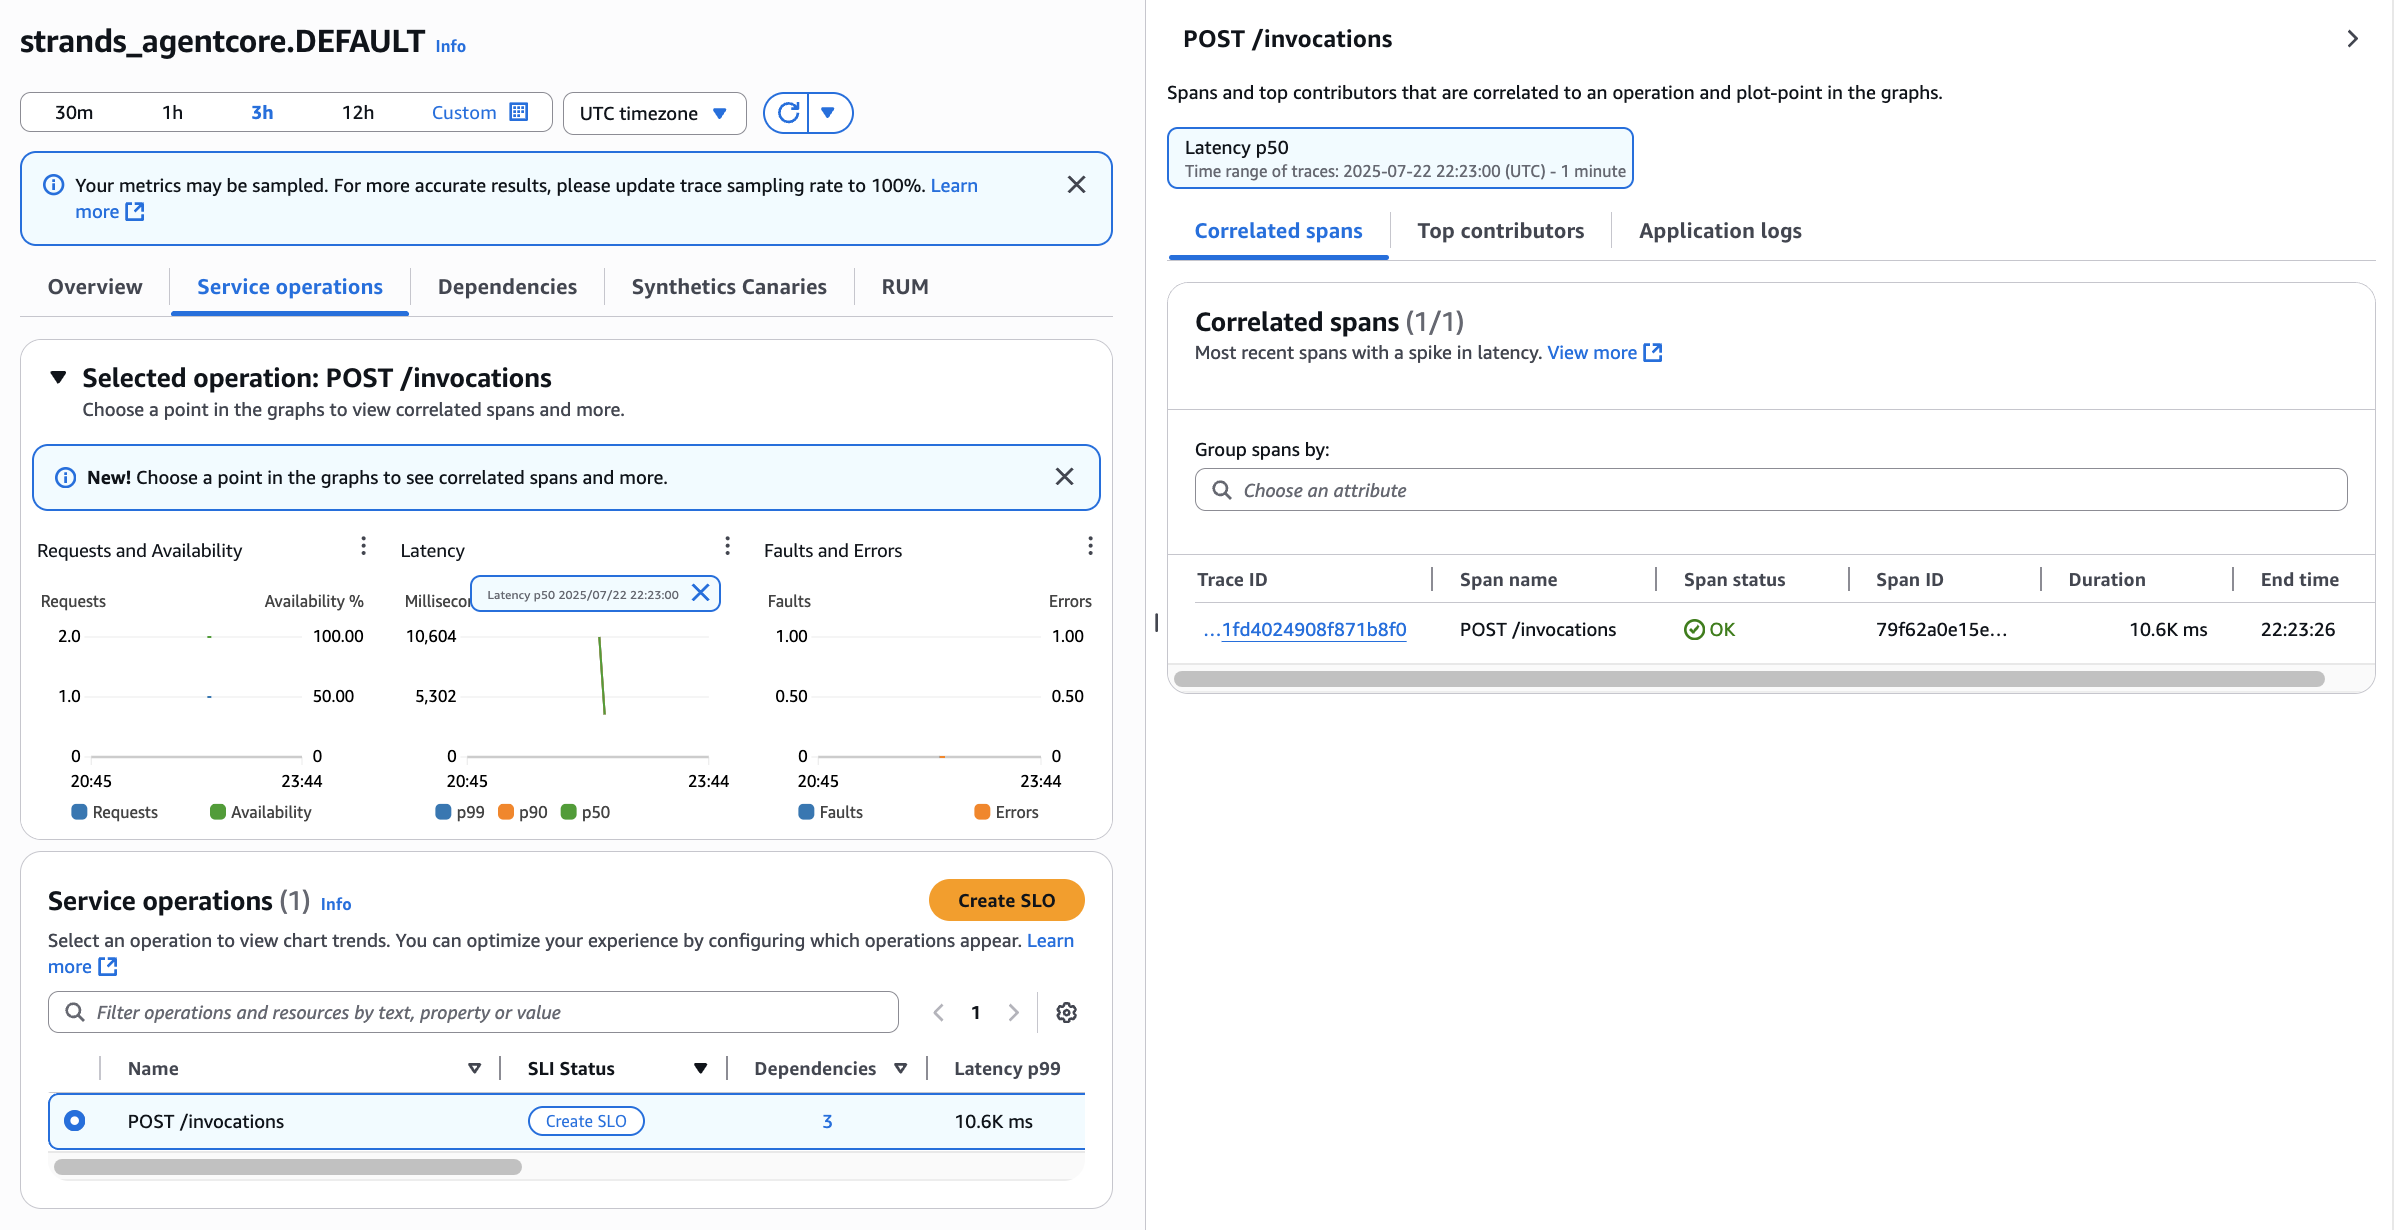
Figure 10: CloudWatch Application Signals dashboard
11. Within the CloudWatch Logs Insights service, you can query the trace data to perform advanced analytics, such as identifying common patterns, detecting anomalies, or troubleshooting complex issues. You can run below sample Logs Insights query on aws/spans log group to analyze traces from a gen_ai_agent service, calculate metrics like errors, latency, and trace duration, grouped by traceId, sessionId, and userId.
Cleanup
- Delete the Strands agent hosted in Bedrock AgentCore Runtime
- Navigate to Amazon Bedrock AgentCore console.
- Under Build and Deploy, select Agent Runtime.
- Select
strands_agentcoreand click Delete.
- Delete the ECR repository (bedrock-agentcore-strands_agentcore).
Conclusion
In this blog we showed you how you can make use of Amazon CloudWatch generative AI observability to easily monitor agentic applications to get detailed visibility into various components and their interaction with other systems. Allowing you to keep agents running smoothly by monitoring and assessing the fleet of agents in one place. To learn more on features for Amazon CloudWatch generative AI, visit Amazon CloudWatch generative Ai Observability/. For more information on deploying Amazon Bedrock agent core, visit Introducing Amazon Bedrock AgentCore: Securely deploy and operate AI agents at any scale (preview).