AWS Cloud Operations Blog
Alarming on SLOs in Amazon Search with CloudWatch Application Signals – Part 2
In practice: SLO monitoring with CloudWatch Application Signals
In the previous post, we’ve shared the basic concepts and benefits of burn rate monitoring.
In this post, we, the Amazon Product Search team, will share anecdotes from our migration from an in-house solution to CloudWatch Application Signals, and introduce how we actually implement monitoring and dashboards.
Migrate from our in-house solution to Application Signals
Several years ago, we started experimenting with SLO and burn rate monitoring capabilities that weren’t yet available in AWS services or our internal systems. Our initial response — building an in-house solution — solved immediate needs but introduced significant operational complexity due to the high resilience and performance requirements.
Our partnership with AWS evolved at the perfect moment. Working closely with the Application Signals team, we collaborated on migrating our monitoring system to CloudWatch. This migration yielded many benefits while allowing us to focus on our core business objectives.
Reduced Operational Burden
- Eliminated Infrastructure Management
- No need to maintain instances, S3 buckets, SQS queues, batch jobs, and other coordination mechanisms for our in-house calculation engine
- Removed System Monitoring Responsibilities
- Freed from monitoring system metrics, SLOs for the engine itself, and infrastructure issues
- Eliminated on-call responsibilities and ticket management for the engine and infrastructure issues
- Resolved Resource Constraints
- Overcame AWS API call rate limitations that previously required manual intervention
- No more capacity planning for API calls when onboarding new SLOs
Enhanced Development Efficiency
- Simplified Development Scope
- Eliminated maintenance of the in-house calculation engine
- No longer handling non-functional updates (software bugs, security patches, dependency updates)
- Development now focused on system infrastructure
Significant Cost Optimization
- Achieved over 90% cost reduction
- Operating costs reduced to less than one-tenth of our in-house solution
- Reduced engineering hours spent on system maintenance
Application Signals SLOs can be created immediately without any special configuration. As long as metric access is available, SLO and burn rate measurements can be performed, allowing us to non-invasively verify usefulness and start Proof of Concept without making changes to the system.
In Amazon Search, we provide centralized monitoring across services operated by multiple teams, including various platforms and execution environments. Being able to use SLO and burn rate just by specifying metrics reduced our initial setup cost to nearly zero.
How Amazon Search monitors our system with Application Signals
In this section, we will show you how Amazon Search implemented the SLO monitoring concepts discussed in part 1 using Application Signals.
SLO Configuration as Code
We’ve found that managing SLOs through configuration files in CDK provides a robust and maintainable approach. Let’s explore how we handle this in Amazon Search using YAML-formatted configuration files.
Our experience has shown several key benefits to this approach:
- Ensuring transparency and accountability
- All SLO changes go through code review, creating a clear approval trail
- Changes are documented with context and timestamps for future reference
- Enabling team autonomy
- Centralized configuration package promotes efficient DevOps collaboration
- SLO owners can manage their SLOs through a standardized self-service process
- SLO owners do not need to implement a logic to turn human readable config files into Application Signals SLOs
- Maintaining clarity and validation
- YAML format provides easy-to-read and maintainable configurations
- YAML schema validation ensures configurations meet required standards before deployment
Here is an example of an availability SLO config YAML file for a service:
childSlos:
  availability:
    sliMetric: fault
    sliMetricShouldBe: <=
    sliThreshold: 0
    sloAttainmentGoal: 99.99%
window: 28d
lastRevisionDate: 2025-01-01 00:00:00+0000
severityToBurnRateConfiguration:
   High:
     windowSize: 1h
     maxConsumption: 2%
   Med:
     windowSize: 6h
     maxConsumption: 5%
   Low:
     windowSize: 3d
     maxConsumption: 10%
metricDefinitions:
  fault:
    resultId: result
    awsRegionName: us-east-1
    queries:
      - Id: result
        AccountId: 123456789012
        MetricStat:
          Period: 60
          Metric:
            Namespace: MyService
            MetricName: hasFault
This example serves as a foundation for your SLO configuration. You can customize the fields and format according to your team’s specific requirements.
Note that we use request-based SLO to monitor our system. So we use the Trimmed Count statistics to count the number of good requests, and use the Sample Count statistics for the total requests.
Please also refer to CloudWatch Application Signals documentation to check how to create request-based SLOs and the details for the statistics.
Turning SLOs into CloudWatch Alarms
For each SLO, we implement several types of alarms that work together to give us comprehensive monitoring coverage:
SLO Attainment Alarm
In our implementation, we use a 28-day interval as default for SLO attainment monitoring. This longer window helps us track our overall service health, measure SLO performance, and generate monthly reports that give us insights into our service reliability.
Burn Rate Alarms
We primarily use 1-hour and 5-minute burn rates with thresholds set at 2% of the total error budget as default. This approach helps us catch issues quickly while avoiding false alarms.
For some of our more critical SLOs, we also implement additional burn rate windows as recommended in The Site Reliability Workbook:
- 6-hour and 30-minute windows (with 5% error budget threshold)
- 3-day and 6-hour windows (with 10% error budget threshold)
Missing Metric Alarm
We’ve learned that it’s crucial to know when our metrics aren’t being published correctly. This alarm helps us catch configuration issues or infrastructure problems that might prevent Application Signals from publishing data properly.
Low Traffic Alarm
We discovered that burn rates can be misleading during low-traffic periods. Since burn rate is calculated based on bad request rates, even a small number of errors during low-traffic periods can trigger alerts. For example, a service typically experiences daily traffic dips in early mornings when almost no requests are coming in. Without the Low Traffic Alarm, you might get paged because of a couple of consecutive errors out of just a handful of requests, even though this represents minimal customer impact. Low Traffic Alarm ensures we only trigger burn rate alarms when we’re receiving meaningful amounts of traffic.
Aggregating SLO monitors
Sometimes, you need to monitor multiple aspects of a service but want to avoid getting multiple tickets or pages for effectively the same incident or cause. That’s where our “Child SLO” concept comes in handy.
Imagine you have a service with two main functionalities – you want to monitor both, but you don’t want separate alerts flooding your systems when there’s an issue affecting the whole service. Instead of treating them as completely separate SLOs, we aggregate them using what we call Child SLOs.
You can still create separate SLOs when you need truly independent monitoring, but the Child SLO pattern has proven valuable when we want to group related functionality under a single monitoring umbrella.
Here is how it’s configured in YAML format. In the example below, there are two child SLOs: tier1TrafficLatency and tier2TrafficLatency.
childSlos:
  tier1TrafficLatency:
    sliMetric: tier1Latency
    sliMetricShouldBe: <=
    sliThreshold: 1500
    sloAttainmentGoal: 99%
  tier2TrafficLatency:
    sliMetric: tier2Latency
    sliMetricShouldBe: <=
    sliThreshold: 2000
    sloAttainmentGoal: 99%
window: 28d
...
The implementation is straightforward – we connect the relevant alarms using OR operators. Since we’re already using CDK and SLO config files for management, this pattern fits naturally into our infrastructure and provides a simple but effective way to aggregate related SLOs.
Here’s the tree structure of the alarm for this example:
MyService-TopLevel-SloAttainment
├── MyService-tier1TrafficLatency-SloAttainment
└── MyService-tier2TrafficLatency-SloAttainment
Alarms are aggregated into a CloudWatch composite alarm. This means you can create the alarm tree manually if you prefer to start small.
Custom Dashboard
Lastly, we will share our custom dashboards, which we implemented using Amazon CloudWatch Dashboards. Our custom solution provides aggregated views of SLOs by service, region, and child SLO hierarchy, and organizes multi-window burn rate metrics.
We use a three-tiered dashboard approach to provide different levels of visibility:
- Dashboard Landing Page
- Service Level Dashboard
- Drilldown Dashboard
To better illustrate the dashboard structure, let us use a hypothetical setting as it’s convenient to explain how different components work together in a practical context. Let’s explore our custom dashboard solution using a hypothetical e-commerce website that:
- Operates in US, UK, and Japan (referred to as COUNTRY)
- Consists of Front-end, Back-end, and Storage services
- Monitors both Availability and Latency SLOs for each COUNTRY
Dashboard Landing Page
Dashboard Landing Page provides a list of services and links to Service Level Dashboards and Drilldown dashboards. This is the landing page for the dashboards.
Here is how Dashboard Landing Page looks.
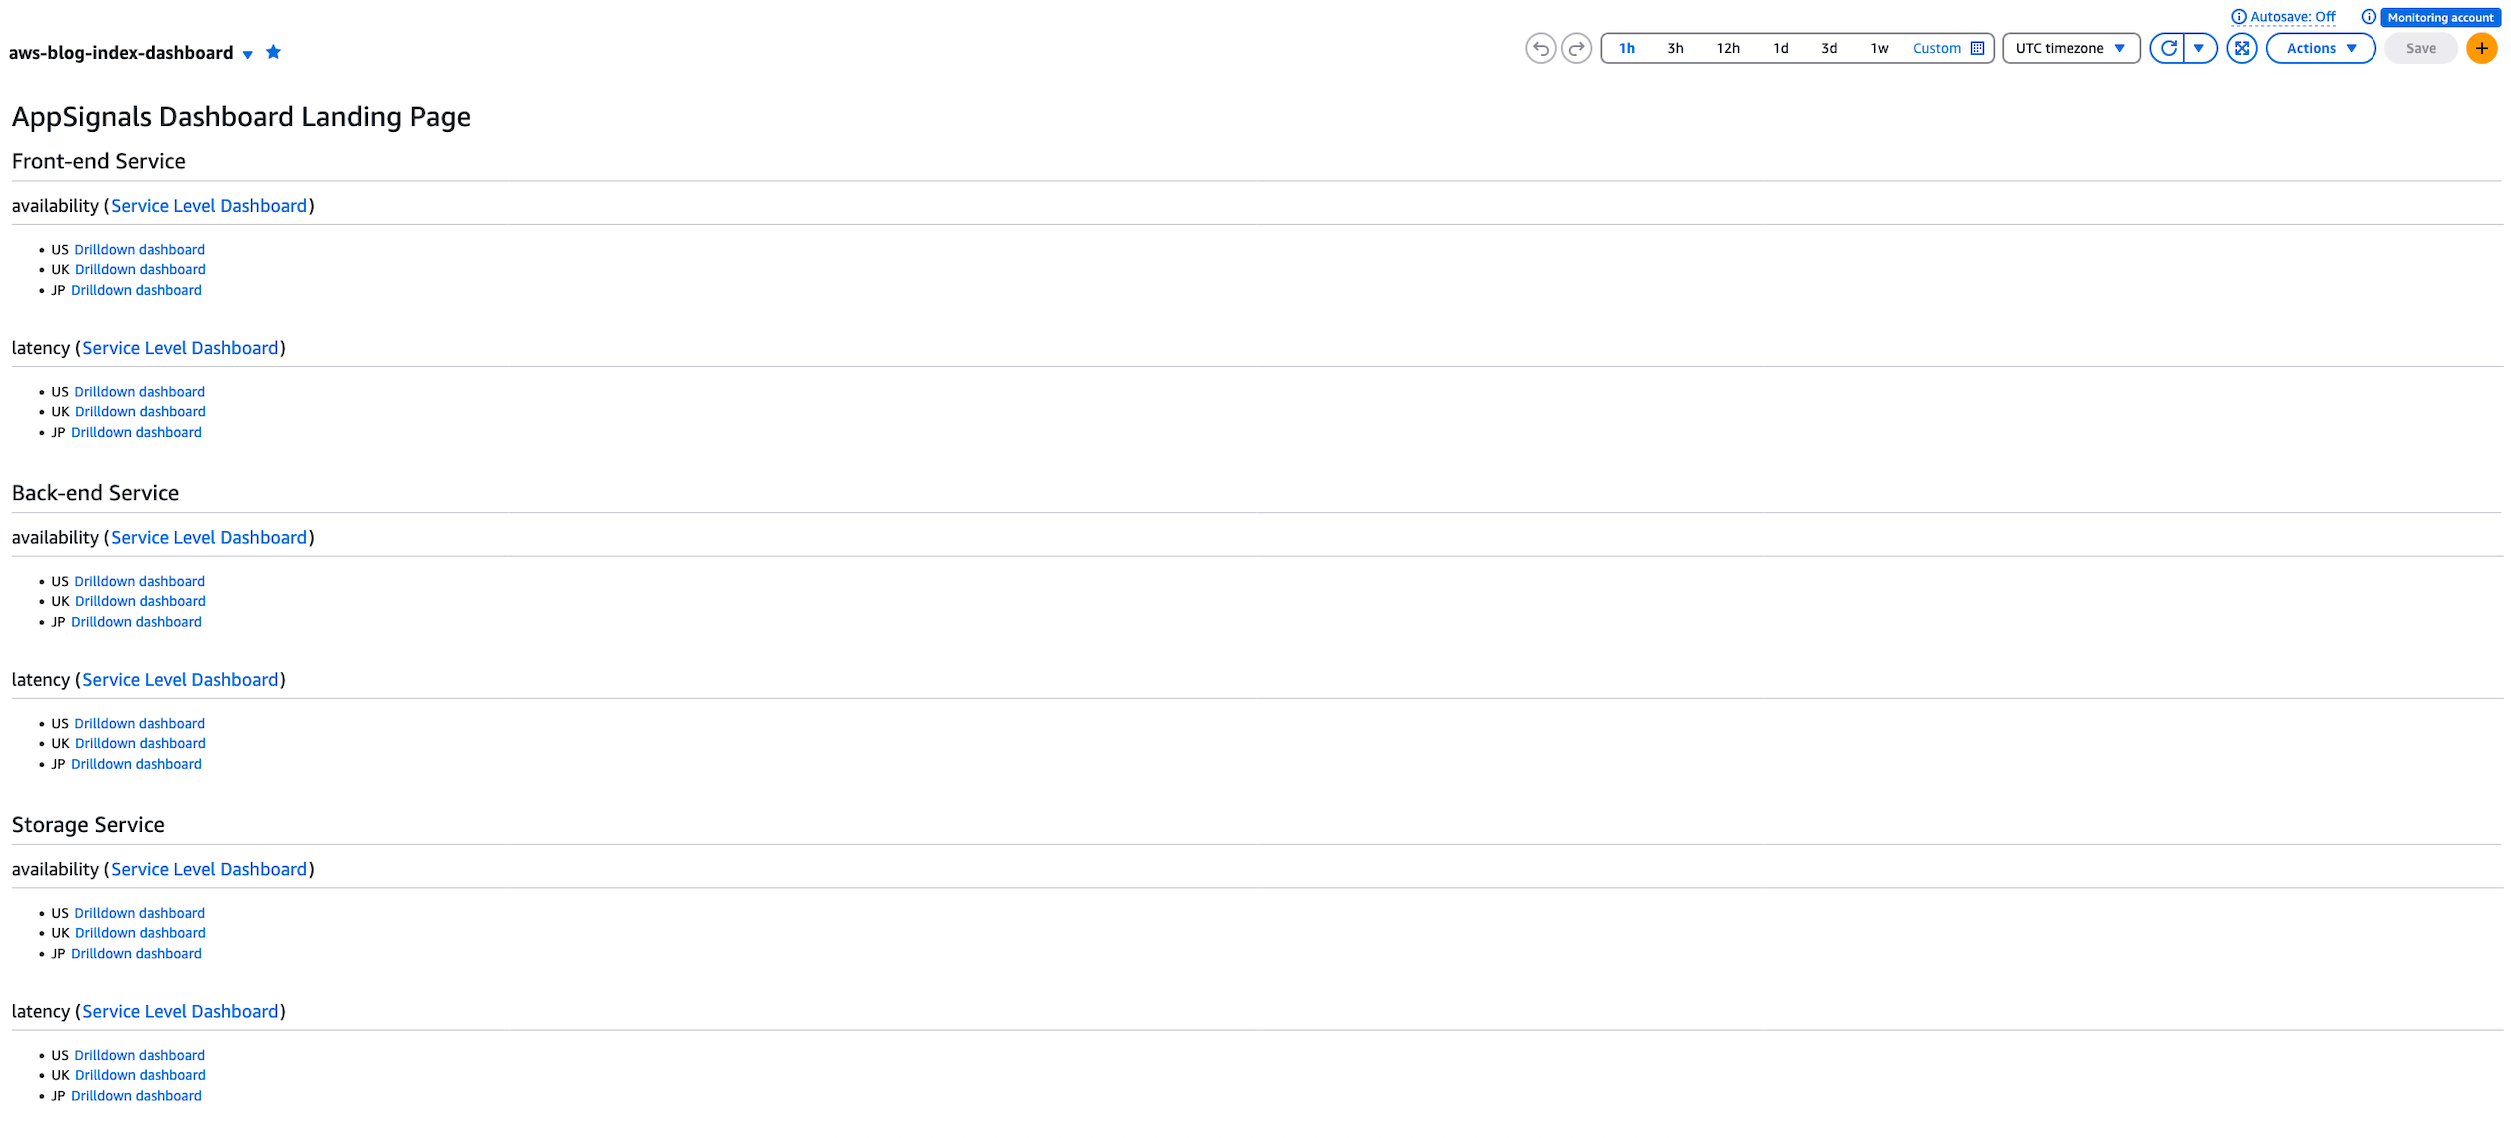
Figure 1: Dashboard Landing Page
Service Level Dashboard
Service Level Dashboard provides an aggregated view of your service across COUNTRIES per SLO type. You’ll have one Service Level Dashboard per service’s SLO type.
Here is how Service Level Dashboard looks. This is for Front-end Service Availability.
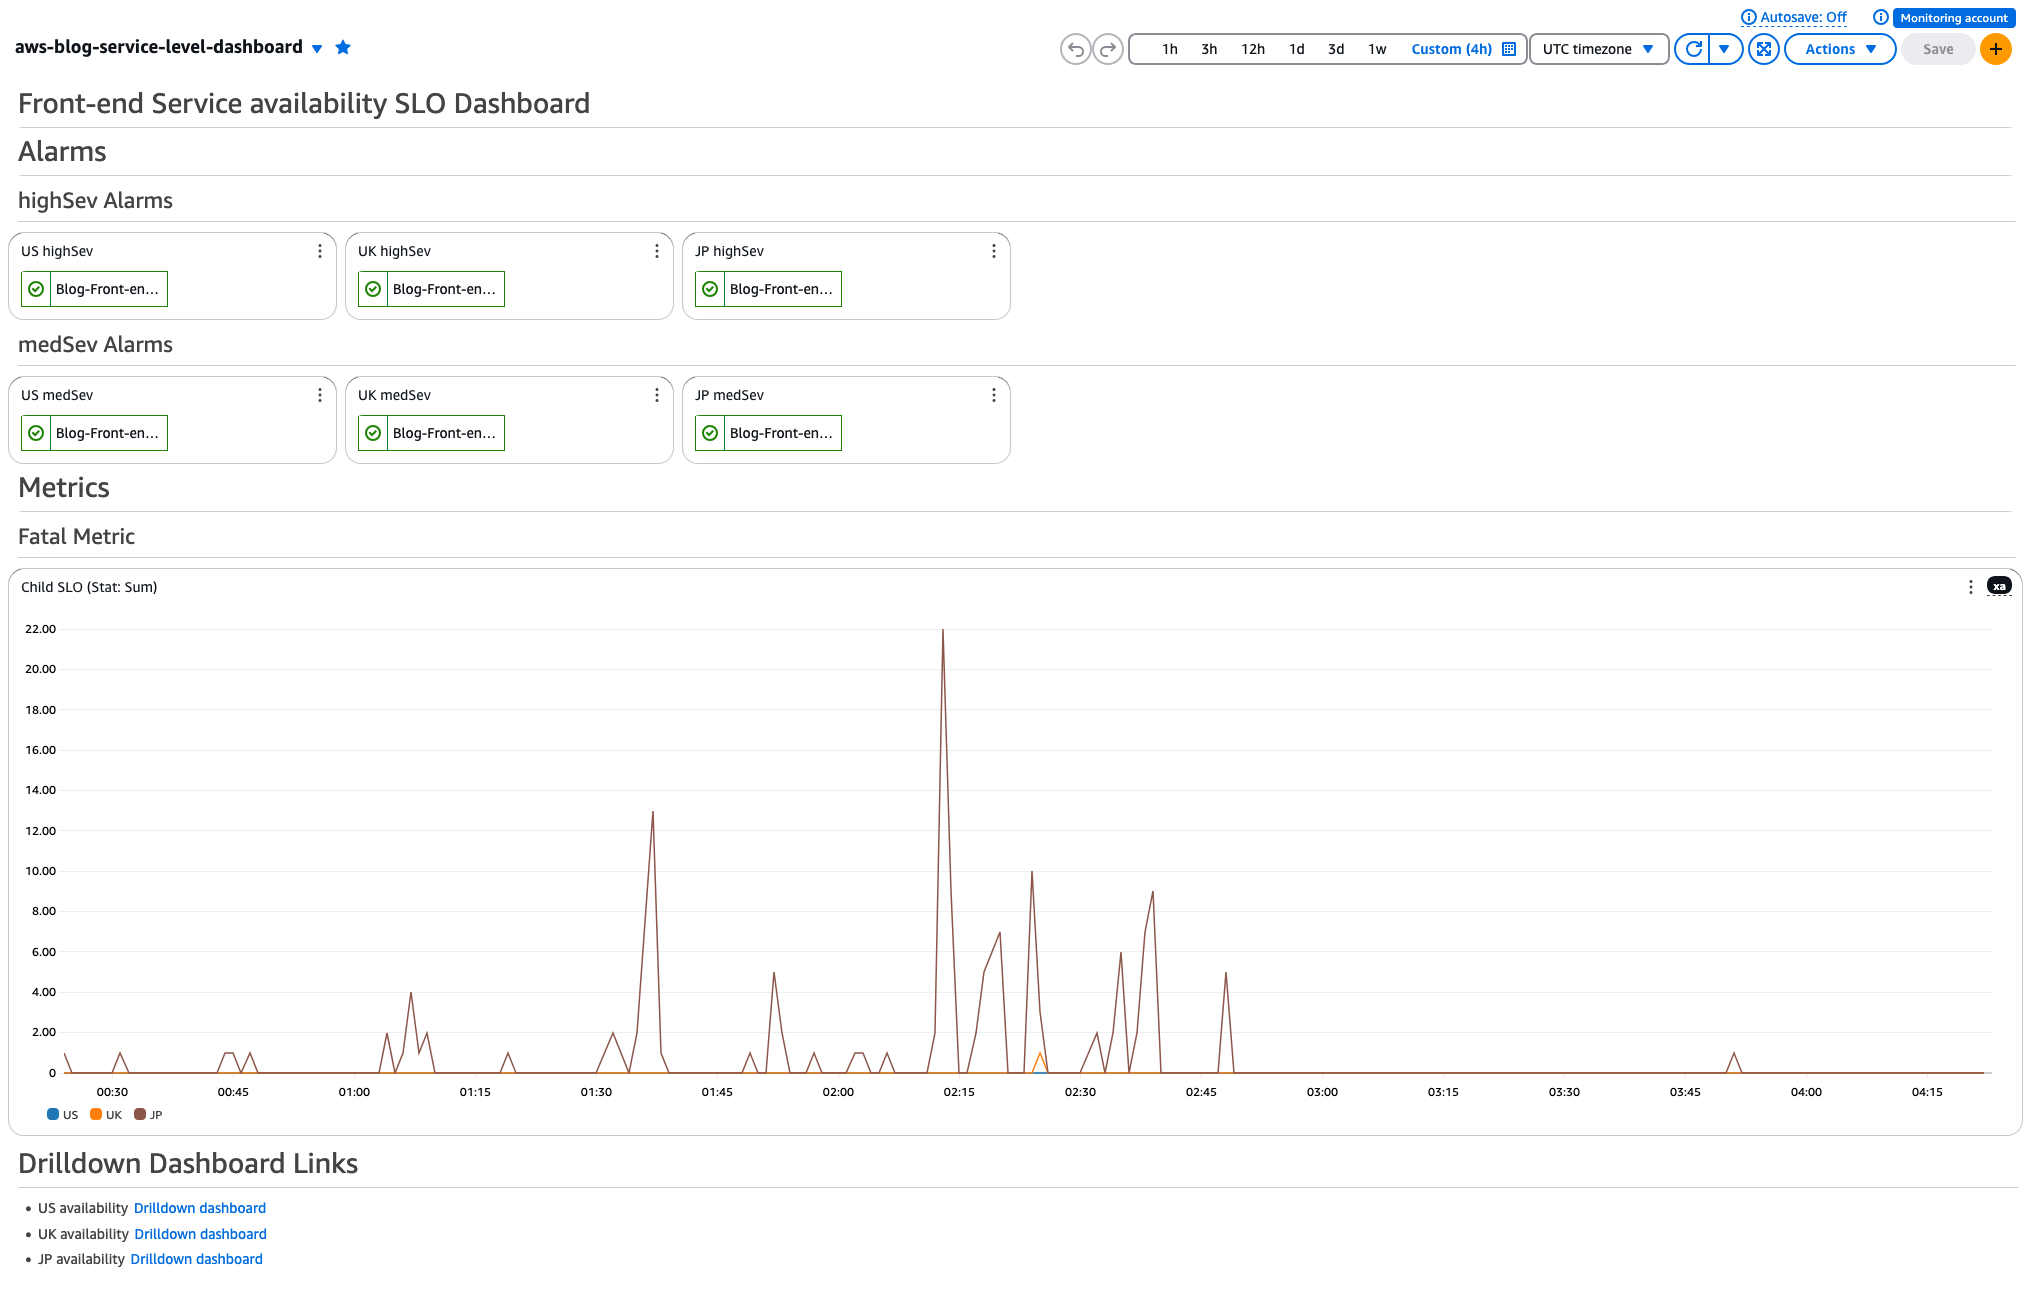
Figure 2: Service Level Dashboard
Contents:
- Alarms
- High severity and Medium severity alarm status badges for all COUNTRIES
- This provides at-a-glance COUNTRY-wide service status
- Metrics
- Overlaying SLI graphs for all COUNTRIES
- This provides a comparable impact on each COUNTRY for SLI
- Links
- Links to Drilldown Dashboards for each COUNTRY
Drilldown Dashboard
Drilldown Dashboard provides a detailed view of your SLO. You’ll have one Drilldown Dashboard per SLO. This Dashboard is also helpful when tuning thresholds and reviewing SLO and Burn Rate status.
Here is how a Drilldown Dashboard looks. This is for Front-end Availability for US COUNTRY.
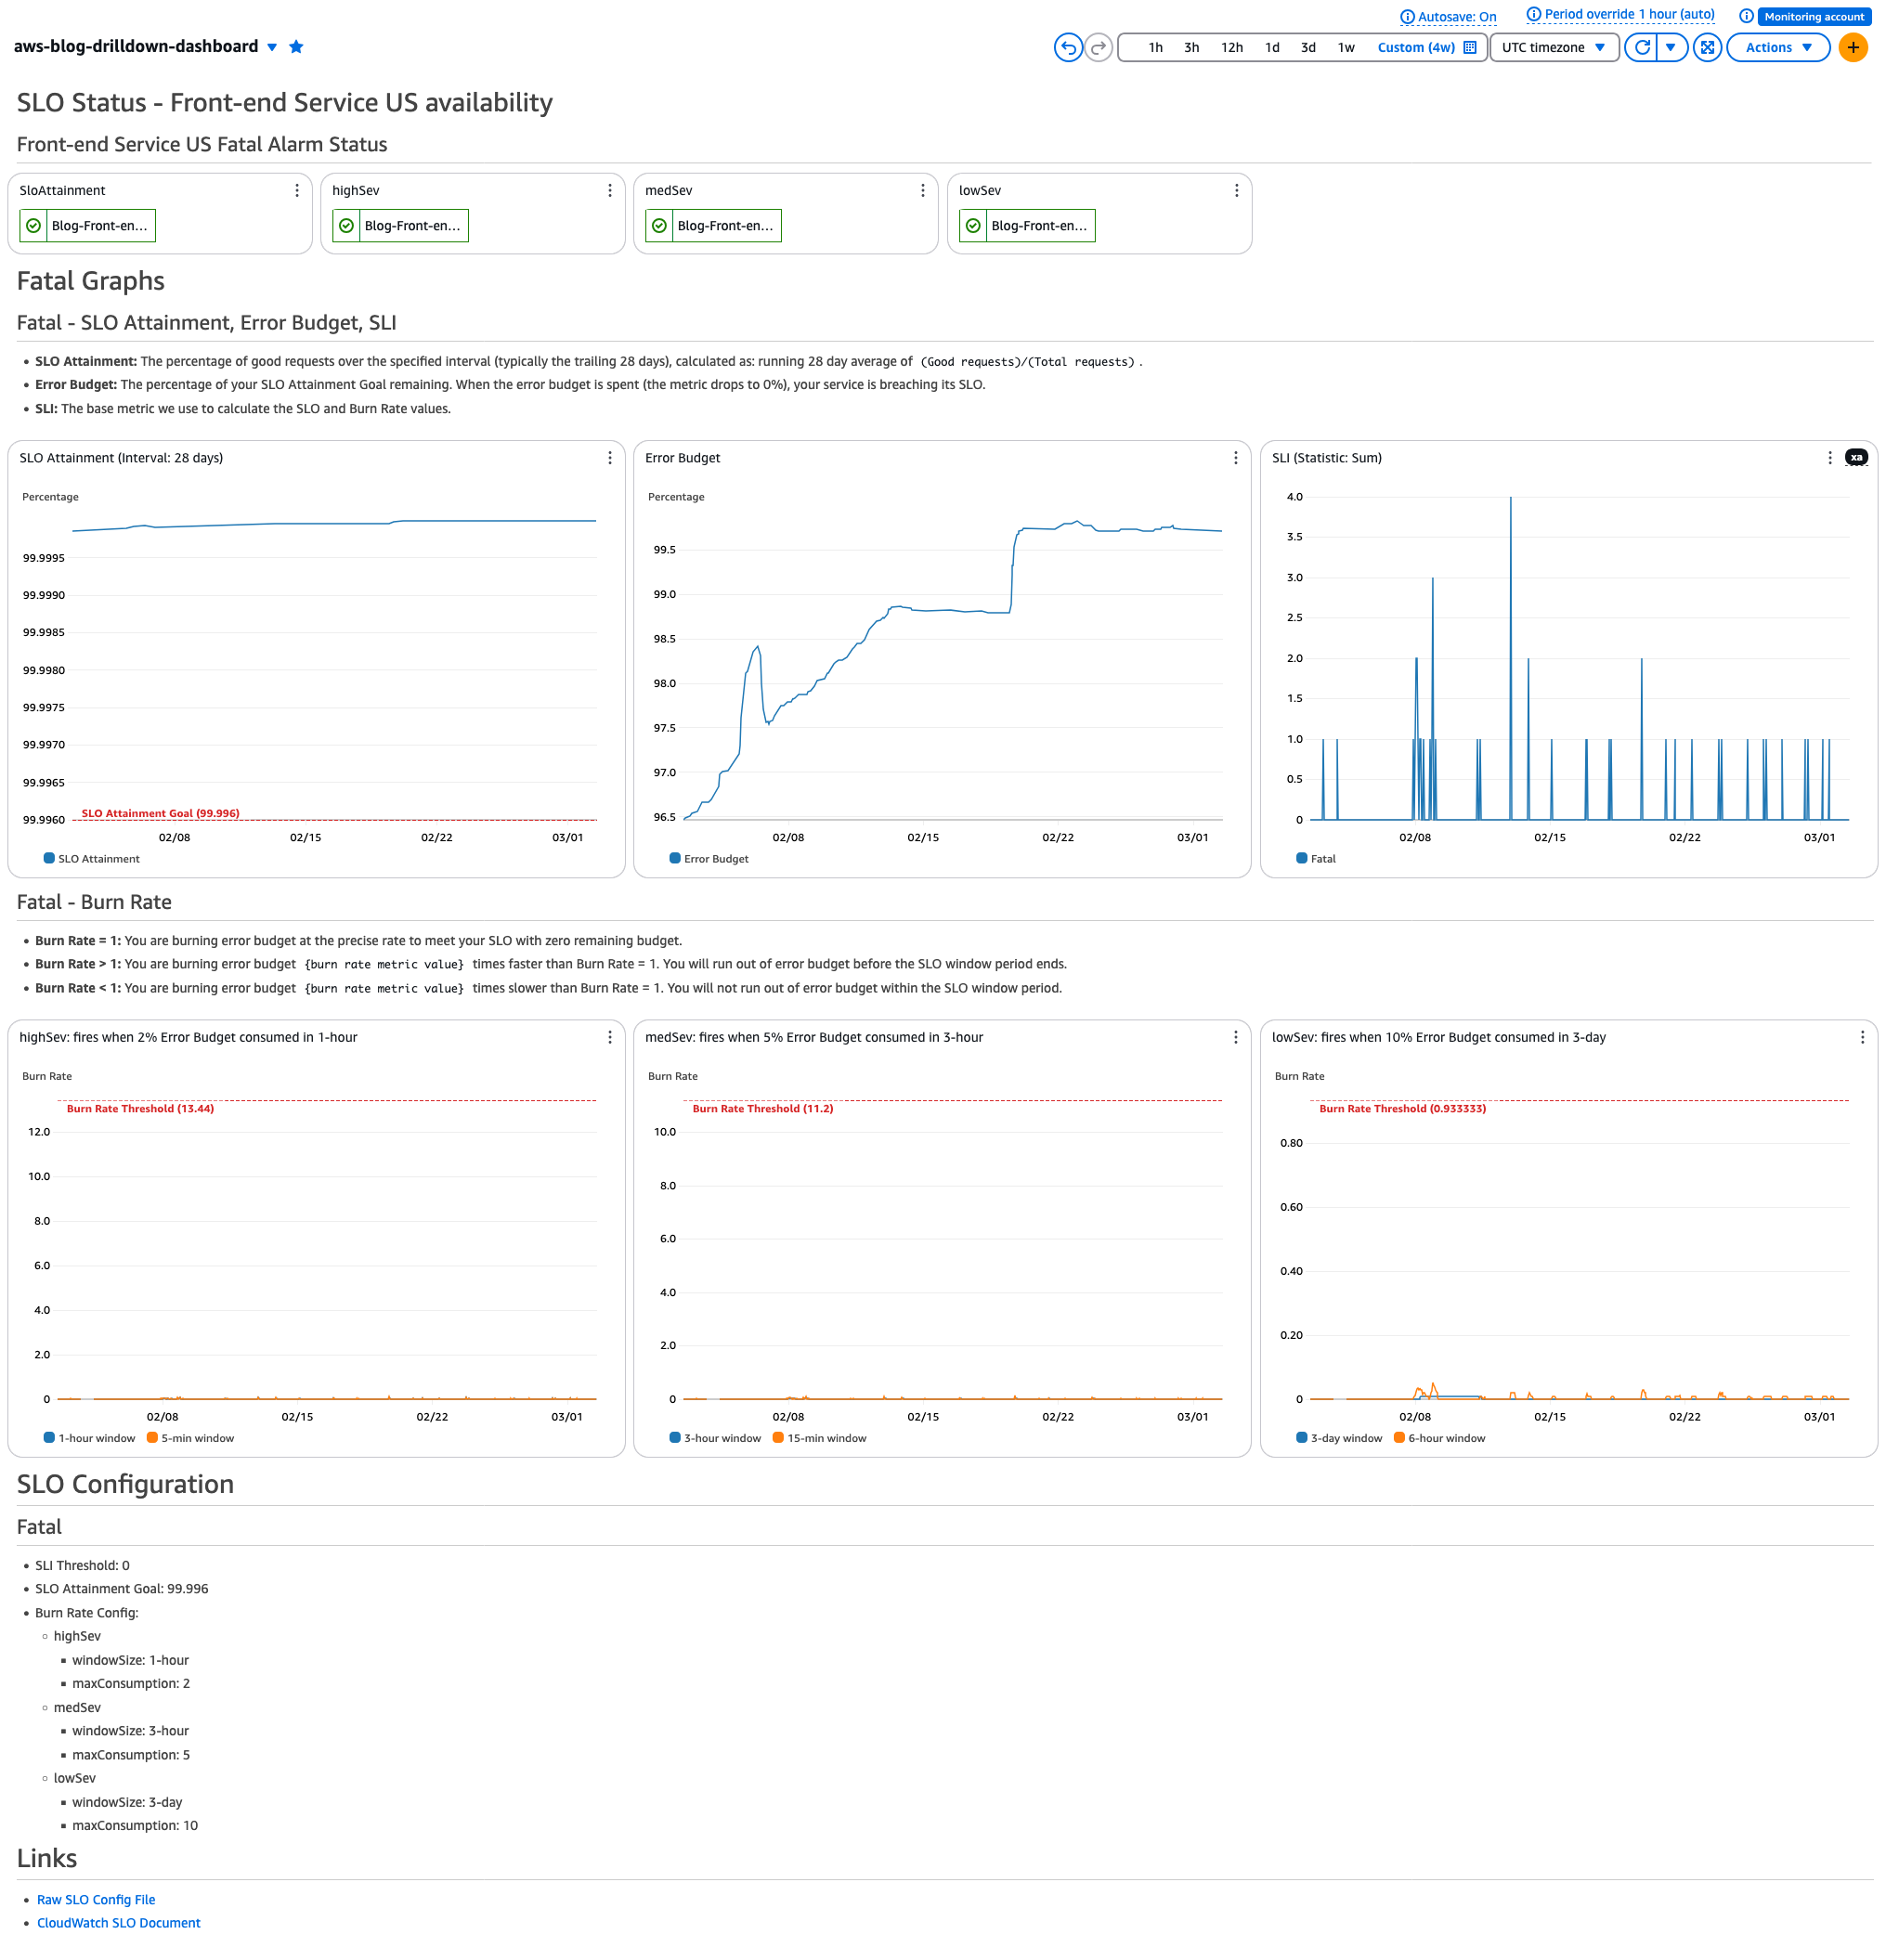
Figure 3: Drilldown Dashboard
Contents (per child SLO):
- Alarm Status
- Alarm status badges for SLO Attainment, High severity, Medium severity, Low severity burn rate alarms
- SLO Attainment, Error Budget, SLI Graphs
- SLO Attainment: The percentage of good requests over the specified interval (typically the trailing 28 days), calculated as: running 28 day average of (Good requests)/(Total requests)
- Error Budget: The percentage of your SLO Attainment Goal remaining. When the error budget is spent (the metric drops to 0%), your service is breaching its SLO
- SLI: The base metric we use to calculate the SLO and Burn Rate values
- Burn Rate Graphs
- Burn rate graphs for High/Medium/Low severities
- SLO Configuration
- Defined variables for this SLO
- Links
- Link to raw SLO config file in case you want to update SLO
- Link to CloudWatch Application Signals documentation
We hope this example provides insights into building effective monitoring dashboards for your services. By implementing these three dashboard tiers, you can achieve comprehensive visibility from high-level service status to detailed SLO metrics.
Conclusion
In this series of posts, we’ve shared Amazon Search’s journey in implementing burn rate monitoring using CloudWatch Application Signals. We covered fundamental concepts like SLIs and SLOs, advanced topics like burn rate monitoring, and practical implementation details including request-based SLOs and custom dashboards.
Our migration from an in-house solution to CloudWatch Application Signals has delivered significant benefits – from reduced operational burden and enhanced development efficiency to substantial cost optimization. The ability to implement SLOs with minimal configuration and the flexibility to monitor services across different teams and platforms has proven invaluable in simplifying our operations.
We hope our experiences and implementation patterns provide you with practical insights for implementing your own SLO-based monitoring system. Whether you’re just starting with SLOs or looking to enhance your existing monitoring setup, CloudWatch Application Signals offers a robust foundation for building reliable and maintainable monitoring solutions.