AWS Cloud Operations Blog
Alarming on SLOs in Amazon Search with CloudWatch Application Signals – Part 1
In theory: SLO concepts applied to Amazon Product Search
In this series of posts, we will show you how we, the Amazon Product Search team, monitor key systems using Service Level Objectives (SLOs) and share our migration journey from an in-house solution to Amazon CloudWatch Application Signals. Amazon Product Search is a large distributed system comprised of over 40 backend services, serving tens of thousands of requests per second.
In part 1, we’ll discuss the limitations of traditional monitoring techniques, fundamental SLO concepts, when to use SLO-based burn rate monitoring, and key decisions when designing our SLO monitoring framework.
In part 2, we’ll share how we used CloudWatch Application Signals to translate these SLO concepts into a functional monitoring framework for Amazon Search, improving observability and reducing technical debt.
Are you satisfied with your monitoring?
Gaps in Monitoring at Amazon Search
Our goal is to implement alarms that help on-call engineers quickly assess service status by detecting truly significant events (fewer false-positives) and capturing important incidents (more true-positives). We need to be selective about notifications – getting paged quickly for customer-impacting issues while avoiding inaction-able pages. It is not easy to achieve this balance with a simple alarming threshold, which led us to explore SLO monitoring as a solution.
Consider this example of an inaction-able alarm: Search services sometimes observe single-datapoint error spikes at midnight due to undetected bot traffic, but recover automatically when the traffic subsides. The service is working normally and showing resilience, so there is no need to page an engineer at night since the service has already recovered. These incidents can be reviewed during business hours to prevent future occurrences.
Another example of under-the-radar deterioration: Search services can experience a persistent but low-level latency increase over several weeks, compared to its normal baseline. This “slow burn” situation doesn’t trigger immediate pages since it’s below the paging threshold. These types of issues require different notification mechanisms that can detect long-term degradation patterns, allowing teams to address problems before they significantly impact the overall customer experience.
Before introducing SLO-based monitoring, Amazon Search employed a common monitoring strategy – what we’ll call threshold-based monitoring. It’s a basic and widely used method to monitor resources.
Threshold-based monitoring alarms are defined by two key attributes:
- Threshold: This is your trigger value – the point at which you want your alarm to fire
- Datapoints to Alarm: The number of recent datapoints that need to exceed your threshold before triggering an alarm
Although threshold-based monitoring is simple and straightforward, it falls short in addressing the challenges we described above. SLO monitoring, in contrast, takes a broader view of service reliability, focusing on monitoring systems based on business Key Performance Indicators (KPIs) rather than individual metric fluctuations. This approach provides a pathway to solving the problems we’ve outlined.
We started exploring basic SLO-based monitoring along with our Chaos Engineering project. More recently, we discovered that an enhanced SLO approach incorporating burn rate could solve the above problems.
What are SLOs?
SLO Fundamentals
SLOs are a well-known framework for measuring and maintaining service reliability.
Here is some basic terminology we will use in this post:
- SLI (Service Level Indicator) is a key performance indicator of your service. SLI represents your service’s “good” status and derives the ratio of good requests to total requests with an SLI metric and an SLI threshold.
- SLO (Service Level Objective) is a target for an SLI as measured over a period of time. It represents your service’s reliability goals.
- SLA (Service Level Agreement) is an agreement with your customer that outlines the level of service you promise to deliver. An SLA also details the course of action when requirements are not met, such as additional support or pricing discounts.
- Error Budget is the business accepted buffer for errors. It is the difference between 100% reliability and the SLO target value. At the point you breach your SLO goal, you have zero Error Budget remaining.
For more detailed information about SLOs in CloudWatch, check out CloudWatch Application Signals documentation.
You can also find best practices and how you can define effective SLOs in this blog post.
SLOs in human language and in variables
For easier context, we have included SLO definitions in human language and variables.
In human language: 99.9% of requests should have latency less than 1000 ms over a 28-day interval.
In variables:
- SLI metric: latency
- SLI threshold: 1000 ms
- SLO interval: 28 days
- SLO attainment goal: 99.9 %
How do I alarm on SLOs?
To alarm on SLOs, we use the concept called burn rate. Think of burn rate as a speedometer for your error budget consumption – it tells you how quickly you’re using up your error budget relative to your SLO attainment goal.
Error rate and burn rate
Consider an SLO for error rate, where the attainment goal is 99.9 % and the interval is 28 days. The table below demonstrates the relationship between error rates, error budget consumption periods, and burn rates for this SLO:
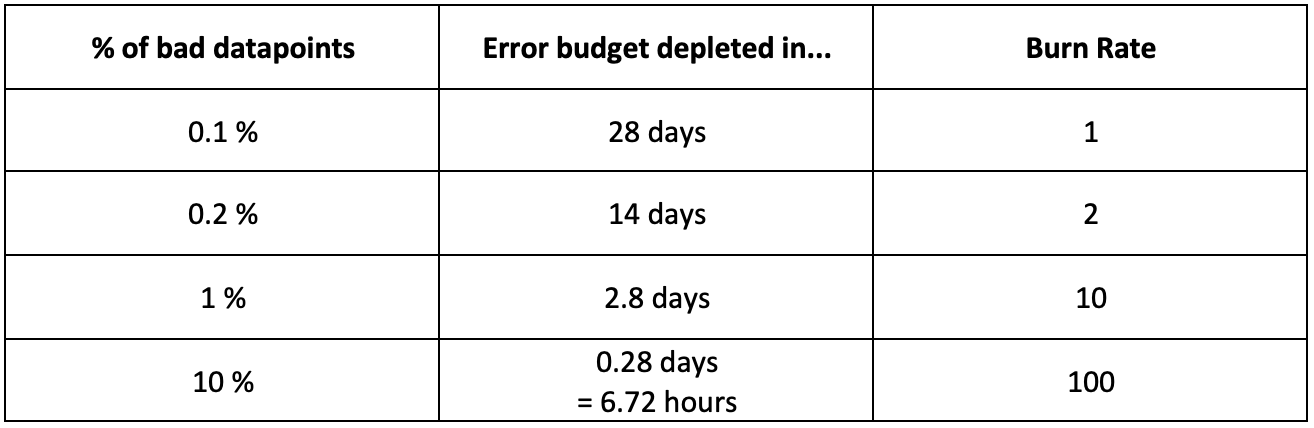
Figure 1: Bad datapoints percentage and burn rates
Burn Rate metric
Let’s also think about the burn rate concept from a different angle. Monitoring the burn rate tells us how far off we are from the baseline error rate.
- Burn Rate = 1: You are burning error budget at the precise rate to meet your SLO with zero remaining budget.
- Burn Rate > 1: You are burning error budget
{burn rate metric value}times faster than Burn Rate = 1. You will run out of error budget before the SLO window period ends. - Burn Rate < 1: You are burning error budget
{burn rate metric value}times slower than Burn Rate = 1. You will not run out of error budget within the SLO window period.
Please also refer to CloudWatch Application Signals documentation to understand how the burn rate is configured and calculated in CloudWatch Application Signals.
When are Burn Rate monitors helpful?
Let’s walk through three scenarios where burn rate monitoring can give you better results than traditional threshold-based monitoring.
Case 1: Single datapoint spike
Imagine your service experiences a brief spike in error rate – just a single datapoint.
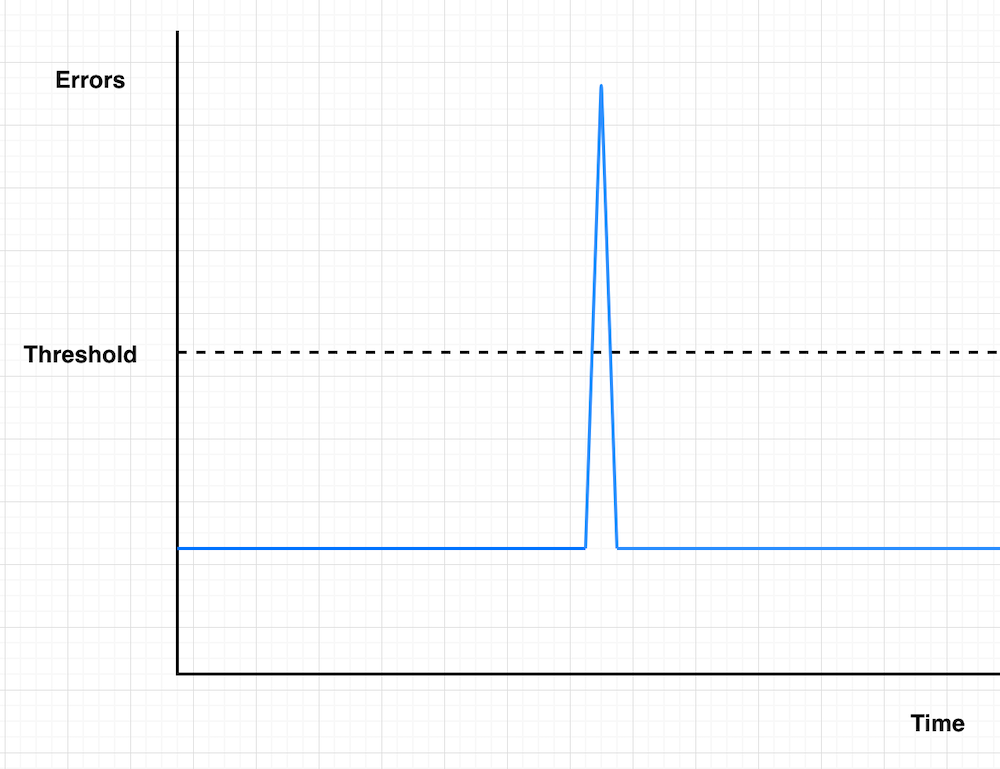
Figure 2: Single datapoint spike
Threshold-based
With threshold-based monitoring, you’ll get notified immediately when that datapoint crosses your threshold. However, since the error rate returns to normal right after, this alarm might not be worth your attention at 3am.
You might think “I’ll just increase the Datapoints to Alarm setting to avoid these false alarms.” While this can help, it might create other challenges (as we’ll see in Cases 2 and 3).
Burn rate
With burn rate monitoring, you’ll only get notified if the error spike is significant enough to consume “X% of your error budget in Y hours.” This means:
- Small spikes won’t wake on-call up unnecessarily
- But if it’s serious enough to impact your SLO, you’ll know about it – even from a single error spike
Case 2: Intermittent spikes
Imagine your service keeps having short error spikes throughout the day, but they never last more than a few minutes at a time.
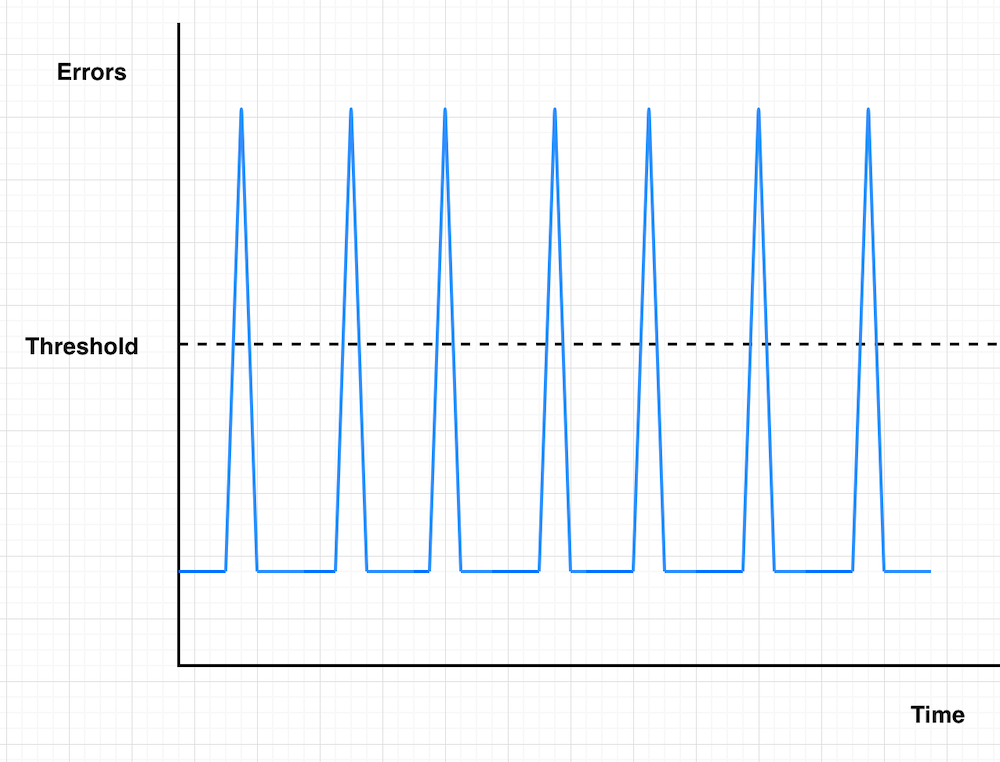
Figure 3: Intermittent spikes
Threshold-based
Remember that Datapoints to Alarm setting we mentioned? Here’s where it can work against you. If your service experiences frequent intermittent spikes, you might never get notified because there aren’t enough consecutive datapoints above the threshold.
Burn rate
Burn rate monitoring can catch these intermittent issues in two ways:
- When individual spikes are severe enough to trigger the burn rate rule
- When multiple smaller spikes within your look-back window add up to a concerning error budget burn
Case 3: Severe incidents
Imagine your service suddenly experiences a complete outage with almost 100% error rate – definitely something you want to know about immediately.
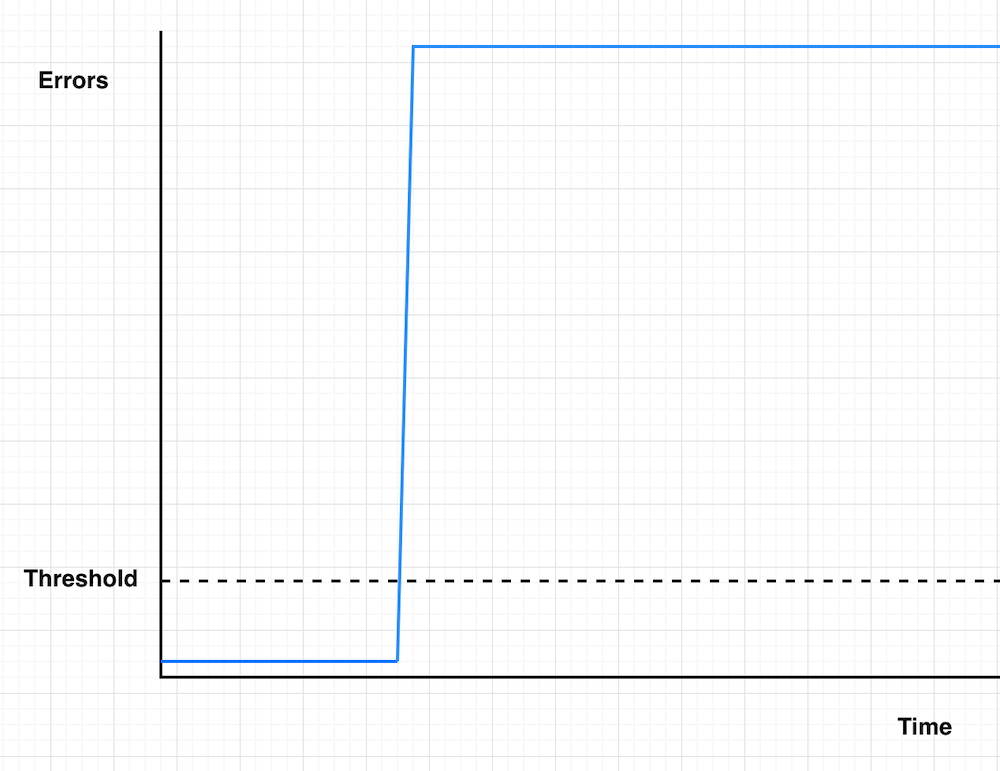
Figure 4: Severe incidents
Threshold-based
Here’s a scary scenario: Your service is experiencing a major incident, but you’ve set Datapoints to Alarm to 15 with 1-minute periods. You won’t get notified for 15 minutes – even if your service is completely down.
Burn rate
With burn rate monitoring, you’ll get notified as soon as your error budget consumption hits your defined threshold. For severe incidents, this typically means immediate notification, helping you respond faster to critical issues.
Guidance on Advanced SLO Concepts
In order to apply burn rate monitoring concepts at Amazon Search, we had to make two key decisions on: Multi-window burn rate approach, and deciding between period-based and request-based SLOs calculation.
Preference for a multi-window approach
Limitations of single-window burn rate
You might think that you can simply define a burn rate alarm based on an error rate and a time window. However, it’s not as straightforward as it might seem.
If we only use a short look-back window (like 5 mins), the alarm fires on many events that don’t actually threaten the SLO. Here is an example from Google’s The Site Reliability Workbook – a 0.1% error rate for 10 minutes would trigger an alarm, while consuming only 0.02% of the monthly error budget. It is creating unnecessary noise.
If we only use a long look-back window (like 1 hour), the alarm would require a proper amount of errors to fire. However, you need to wait at least 1 hour to reset the alarm. If another incident occurs within that hour, it could be masked by the ongoing alarm, potentially hiding new problems that require attention.
Alarming on multi-window burn rate
To solve the constraints above, we use two look-back windows (a long window and a short window) for each burn rate alarm.
Keep in mind that you only need to define your burn rate configurations based on the long window. For example, you can specify your burn rate monitor as “I want to get notified when 2% of error budget consumed in 1 hour”.
The short window is automatically configured to support this primary monitoring goal, providing more responsive detection without requiring separate configuration.
This multi-window approach is recommended in The Site Reliability Workbook, with three burn rate monitoring configurations proposed as a guideline:
- Getting paged when 2% of error budget consumed in 1 hour.
- Getting paged when 5% of error budget consumed in 6 hours.
- Getting a ticket when 10% of error budget consumed in 3 days.
Using two look-back windows provides better operational experience:
Long Window (e.g. 1 hour)
- Primary window for your burn rate rule
- Triggers when error budget consumption threatens SLO compliance
- Provides stable measurement over longer periods
Short Window (e.g. 5 minutes)
- 1/12 of the long window – suggested in The Site Reliability Workbook
- Helps the alarm return to OK state faster
- Prevents masking of new issues during recovery
Operational Benefits
- Alarm can return to OK state much faster once the service recovers
- Enables clearer distinction between resolved issues and new problems
- Reduces the operational burden on on-call engineers
You can simply aggregate a long window alarm and a short window alarm into one alarm with CloudWatch composite alarm.
Please also refer to CloudWatch Application Signals documentation to set up this approach with Application Signals.
Error Budget Calculation Considerations
When calculating burn rate, it’s important to understand how error budgets work differently between period-based and request-based SLOs.
In period-based SLOs, the error budget only decreases throughout the SLO interval, and you don’t “earn back” any budget during the interval. If you run out of error budget, you may need to shift focus from releasing new features to improving service stability and reliability. This might involve pausing feature deployments, implementing fixes for known issues, or addressing technical debt that impacts reliability. This is the traditional error budget concept that most people are familiar with.
Request-based SLOs work differently. Here, the error budget is based on the number of requests that can fail while still meeting your objective. Importantly, this remaining error budget is dynamic – it can increase and decrease throughout the SLO interval, depending on the ratio of good requests to total requests. If your service performs better than the objective for a period, you actually “earn back” some error budget. This means you can run out of error budget more than once in an SLO interval.
For more detailed information on how these calculations work, check out CloudWatch Application Signals documentation.
More effective monitoring with SLOs
In this post, we’ve shared the basic concepts and benefits about burn rate monitoring. We hope this blog post provides good guidance for applying burn rate monitoring and helps you efficiently monitor your systems.
As we’ve explained in this post, burn rate monitoring offers a powerful mechanism for detecting significant events and capturing important incidents based on your business KPIs. While the benefits are substantial, we understand that implementing this approach comes with certain challenges.
To apply burn rate monitoring to your system, you need to define SLOs for your system. Though this requires initial effort, the process helps you identify which metrics truly represent your business performance indicators, creating clarity around what matters most to your service. Also, the whole concept is more challenging to understand and digest. Your team may need training to grasp these concepts.
In the next post, we will walk through our journey from an in-house solution to Amazon CloudWatch Application Signals and share our implementation patterns to improve observability. Check it out!