AWS for Industries
Optimizing Fixed Income Consolidated Tape Performance: Latency Testing for Bond Market Data

In the fast-paced world of financial markets, every millisecond counts. For the (soon to be selected) Fixed Income Consolidated Tape Providers (CTP) that will begin operations in early 2026, it’s crucial to maintain low latency and high throughput to deliver timely and accurate pricing information.
Bondtape
Bondtape is a partnership between FINBOURNE Technology and Propellant.digital. Together they will deliver market-proven, trusted, and scalable bond Consolidated Tape (CT) in the UK, marking a significant step towards improving transparency and efficiency in the global fixed income markets. This partnership will leverage FINBOURNE’s enterprise data technology, combined with Propellant’s analytics framework, to deliver a comprehensive enterprise solution.
Using FINBOURNE’s platform, Bondtape developed a prototype of their CTP solution, designed to quality check, harmonize, and disseminate bond pricing data efficiently in real-time. As part of the exercise, they implemented a full-trade data set and test harness, with which Bondtape then conducted comprehensive latency testing.
The Challenge: Balancing Speed and Stability
The goal was to evaluate how the system handles varying load intensities and whether these conditions have any measurable impact on processing latency. Testing was vital to ensure that the prototype maintained consistent performance under both short-term stress and extended operations, simulating real-world scenarios. It’s important to qualify that the times in this blog post are indicative, as the prototype will receive enhancements from performance tuning and workload smoothing improvements planned as part of the CTP pre-operationalization phase.
The Bondtape Approach: AWS-Powered Platform and Testing Environment
Bondtape’s cloud native platform runs on two Availability Zones for the UK CTs. This architecture efficiently distributes load and data to ensure zero-down time resilience to component, hardware, or entire Availability Zone failure. It is also worth noting that a ‘region’ in AWS terms (e.g. London) comprises 3 or more Availability Zones (AZ). These Availability Zones are at least 100 kilometers apart from each other, and each having its own redundant power, cooling, and connectivity.
The final AZs for the CTP will be optimized for both latency and environmental considerations. All connectivity into and out of the service will be configured for resiliency, with redundancy and automated fail-over to minimize potentially disruptive scenarios. Bondtape is built on the same foundational technology as FINBOURNE’s LUSID platform, which processes an average of 10 million data processing requests daily (3.4 billion in 2024) with industry leading reliability.
Leveraging the scalability and flexibility of AWS, Bondtape set up their test prototype environment with the following configuration:
- A fleet of Amazon Elastic Compute Cloud (EC2) instances, orchestrated using Amazon Elastic Kubernetes Service (EKS). Implementing the unparalleled data throughput of Amazon Managed Streaming for Apache Kafka (MSK) and Amazon Relational Data Service (RDS).
- Running hot/hot across multiple AWS Availability Zones in the EU-WEST-2 London (LON) region.
- Round-trip testing conducted from the FINBOURNE offices in Dublin (DUB) to simulate realistic end-to-end latency expectations of end-users across geographies.
- The test harness used for replaying historic data at prescribed velocities was custom-built by FINBOURNE for Bondtape.
Bondtape conducted a comprehensive latency test on the CTP prototype. They used a test harness designed to inject historical bond pricing data into the platform with varying levels of throughput under controlled conditions.
The objective was to evaluate how the system handles varying load intensities and whether these conditions have any measurable impact on processing latency. Having these benchmarks and testing tools in place lets them effectively measure the performance impact and improvements from the ongoing platform development.
By replaying a full 10-hour trading session, Bondtape aimed to identify whether the system maintains consistent performance or exhibits drift, degradation, or tail latency build-up under sustained workloads.
Leveraging FINBOURNE’s scalable infrastructure and AWS services, the Bondtape team measured how the system performs under conditions where the allocated resources become saturated, and the impact (or lack thereof) of scale up and scale down events.
As the testing and evaluation of the platform continues alongside its development, Bondtape will be working closely with AWS to ensure their CTP solution exhibits the necessary performance and resiliency characteristics ahead of launch.
Performance Test Methodology: Simulating Market Conditions
Bondtape conducted two types of tests:
1. Load sensitivity. By replaying bond data at different speeds (1x, 2x, and 3x), they observed how increasing throughput influences the latency and responsiveness of the CTP, even in its early state.
2. Stability under representative load. By replaying a full 10-hour trading session, Bondtape wanted to identify whether the system maintains consistent performance or exhibits drift, degradation, or tail latency buildup under sustained workloads. This approach let Bondtape benchmark the latency characteristics of the system under both short-term stress and extended operation, giving them a better understanding of its behavior in production-like scenarios. They set the initial ‘tolerance’ at 500ms.
For each test, Bondtape measured the round-trip time (RTT) and calculated key metrics including mean latency, median (P50), 95th percentile (P95), and 99th percentile (P99). They subjected each event processed by the system to a range of quality checks, including MiFID II message format compliance, ISIN asset class validation, ToTV (Traded on Trading Venue) qualification, and post-trade reporting flag validation.
Key Findings
The tests revealed several important insights:
1. Baseline Performance: Under normal conditions (1x speed), the system maintained low median latencies, demonstrating solid performance for typical workloads.
2. Scalability: Increasing the replay speed to 2x and 3x, Bondtape observed wide latency distributions, showing growing sensitivity to throughout pressure. However, performance remained within acceptable limits.
3. Long-term Stability: The 10-hour test showed latency distribution flattening out, with a heavier tail beyond 60ms. The longer runtime appeared to accumulate system pressure, increasing tail latency.
4. High-Pressure Scenarios: The week-long data replay at 10x speed showed the system’s ability to handle large volumes over extended periods, with only slight latency increases. The latency distribution flattens out with a heavier tail beyond 100ms.
Histograms
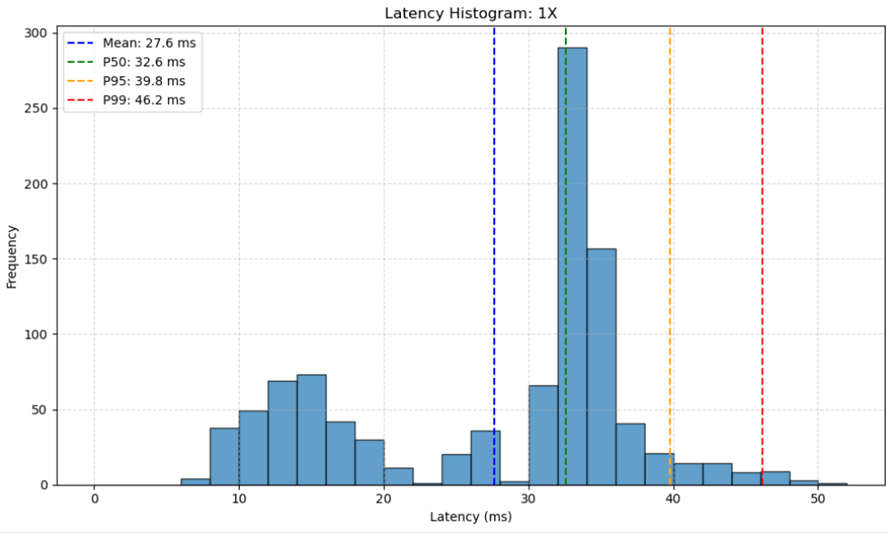 Figure 1 – 1x Speed
The latency distribution shows a tight cluster around 30–35ms, showing stable performance under real-time load.
A modest tail begins to form past 40ms, but overall spread remains low.
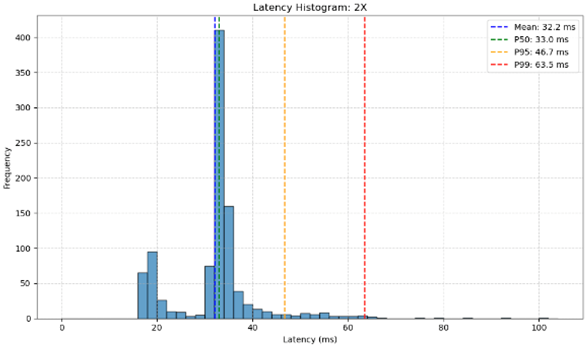 Figure 2 – 2x Speed
The distribution shifts slightly right, with most latencies between 35 – 45ms.
Increased throughput introduces a broader spread but remains manageable.
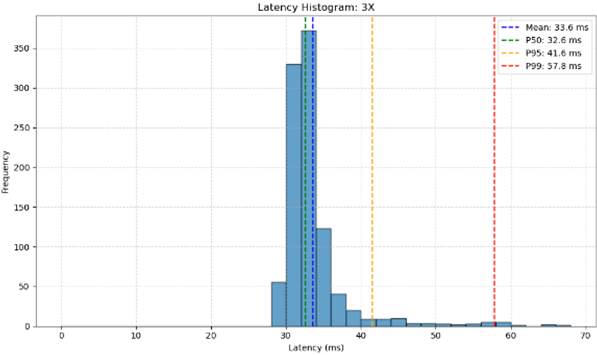
Figure 3 – 3x Speed
Latency continues to rise, with a wider distribution and denser tail past 50ms.
Some outliers begin to appear, suggesting early signs of load sensitivity.
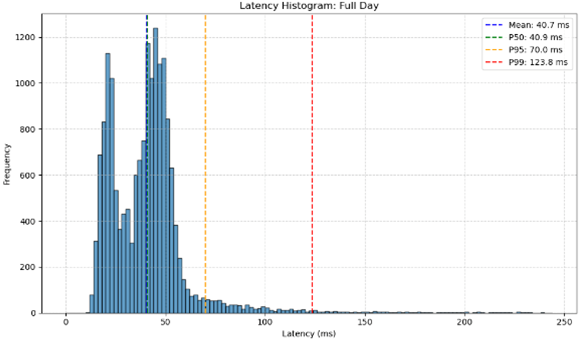 Figure 4 – Full-Day (1x)
Latency distribution flattens out with a heavier tail beyond 60ms.
Longer runtime appears to accumulate system pressure, increasing tail latency, but seeing more extreme values is explained by the larger sample size.
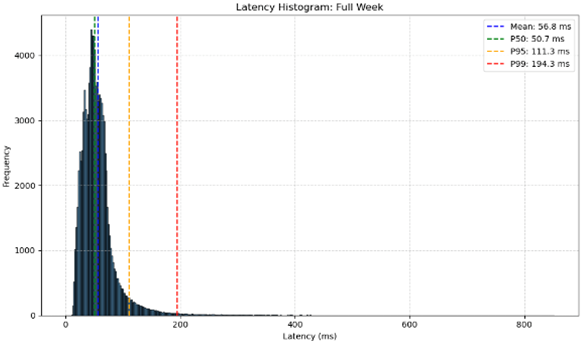 Figure 5 – Full-Week (10x)
Latency distribution flattens out with a heavier tail beyond 100ms.
Longer runtime appears to accumulate system pressure, increasing tail latency, but seeing more extreme values is explained by the larger sample size.
Slight increase in latency in long run pressure test.
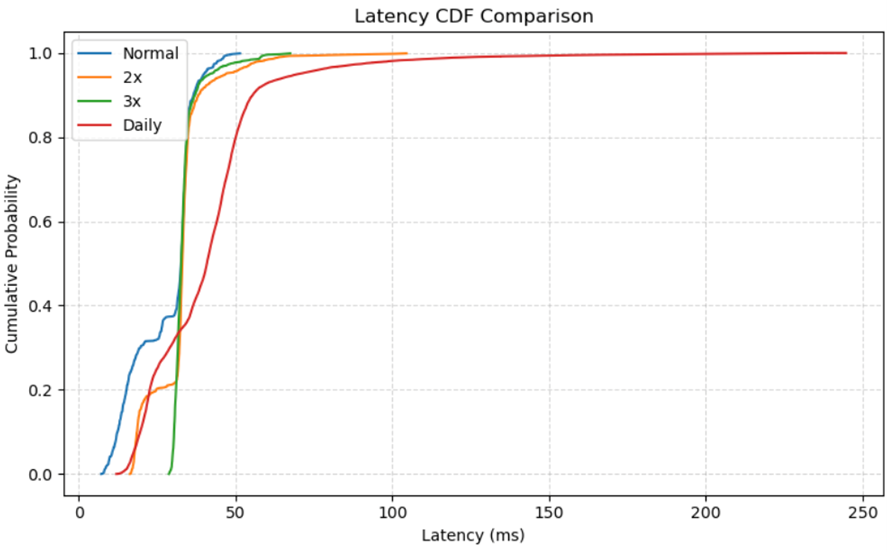
Figure 6 – CDF Comparison
The CDF curves highlight that normal and 2x speeds reach 95% completion under 50ms, while 3x and daily runs show slower progression.
The daily test curve flattens later, indicating a wider spread and higher tail latencies.
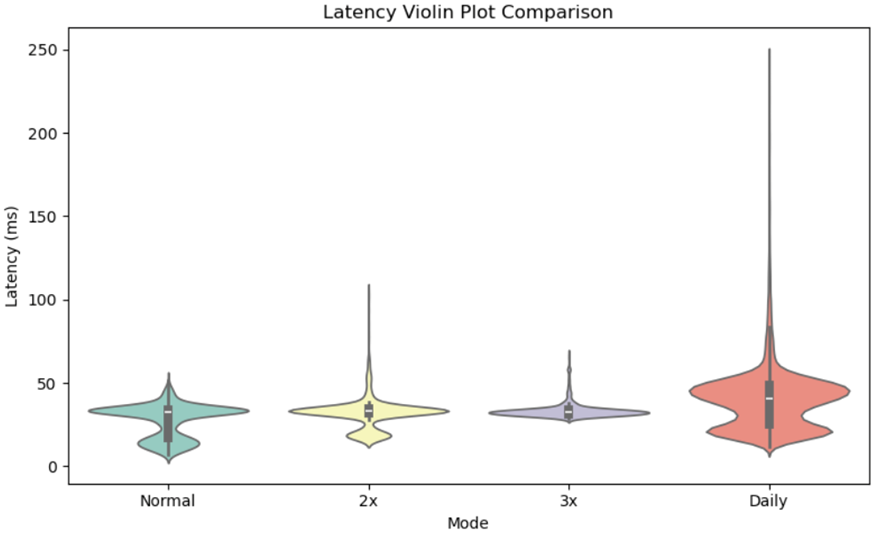
Figure 7 – Violin Plot Comparison
The violin plot shows increasingly wider distributions from 1x to 3x, with the daily run exhibiting the most significant spread and outliers.
It confirms the latency distribution becomes more variable under sustained or accelerated load conditions.
Conclusions and Next Steps
Overall, the Bondtape prototype showed promising performance, with all tests falling within the 500ms tolerance threshold. The system handled normal and moderately increased loads well, while also showing resilience in high-pressure scenarios.
The tests also identified areas for potential improvement, particularly in optimizing for sustained high-throughput or long-running use cases.
By leveraging the power and flexibility of AWS and rigorous testing like this, Bondtape are confident in the team’s ability to build a robust, high-performance Consolidated Tape for the bond market at a reasonable price. The next steps for Bondtape will involve refining the prototype based on these test results and preparing for real-world deployment.
Stay tuned for more updates as Bondtape and AWS continue to push the boundaries of what’s possible in financial data processing and distribution.