AWS DevOps & Developer Productivity Blog
Streamline Operational Troubleshooting with Amazon Q Developer CLI
Amazon Q Developer is the most capable generative AI–powered assistant for software development, helping developers perform complex workflows. Amazon Q Developer command-line interface (CLI) combines conversational AI with direct access to AWS services, helping you understand, build, and operate applications more effectively. The Amazon Q Developer CLI executes commands, analyzes outputs, and provides contextual recommendations based on best practices for troubleshooting tools and platforms available on your local machine.
In today’s cloud-native environments, troubleshooting production issues often involves juggling multiple terminal windows, parsing through extensive log files, and navigating numerous AWS console pages. This constant context-switching delays problem resolution and adds cognitive burden to teams managing cloud infrastructure.
In this blog post, you will explore how Amazon Q Developer CLI transforms the troubleshooting experience by streamlining challenging scenarios through conversational interactions.
The Traditional Troubleshooting Experience
When issues arise, engineers typically spend hours manually examining infrastructure configurations, reviewing logs across services, and analyzing error patterns. The process requires switching between multiple interfaces, correlating information from various sources, and deep AWS knowledge. This complex workflow often extends problem resolution from hours into days and increase the burden on the infrastructure teams.
Solution: Amazon Q Developer CLI
Amazon Q Developer CLI streamlines the entire troubleshooting process, from initial investigation to problem resolution, making complex AWS troubleshooting accessible and efficient through simple conversations.
How Amazon Q Developer CLI works:
- Natural Language Interface: Execute AWS CLI commands and interact with AWS services using conversational prompts
- Automated Discovery: Map out infrastructure and analyze configurations
- Intelligent Log Analysis: Parse, correlate, and analyze logs across services
- Root Cause Identification: Pinpoint issues through AI-powered reasoning
- Guided Remediation: Implement fixes with minimal human intervention
- Validation: Test solutions and explain complex issues simply
One of the built-in tools within the Amazon Q Developer CLI, use_aws, enables natural language interaction with AWS services, as shown in Figure 1. This tool leverages the AWS CLI permissions configured on your local machine, allowing secure and authorized access to your AWS resources.
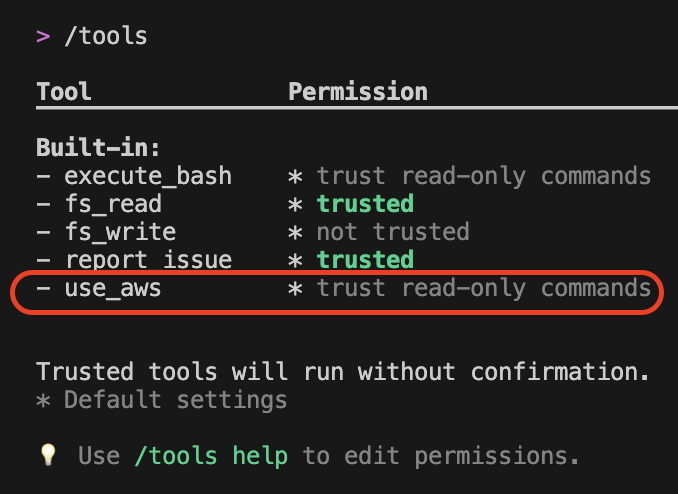
Figure 1: Tools selection in Amazon Q Developer CLI
Real-World Troubleshooting Scenario
Demonstration Environment Setup
This demonstration was performed with the following environment configuration:
- Application and infrastructure code available locally
- Amazon Q Developer CLI installed
- AWS CLI configured with demo-profile
- AWS permissions configured for: Amazon Elastic Container Service(ECS), Amazon CloudWatch Logs, Application Load Balancer (ALB), and AWS Cloud Development Kit(CDK) deployment
- Amazon Q Developer CLI launched within the project directory
The environment includes a local development machine with necessary tools, appropriate AWS account permissions, and terminal access. By starting Amazon Q Developer CLI in the project directory, it has immediate access to relevant code and configuration files.
Scenario: Troubleshooting NGINX 5XX Errors
The scenario demonstrates troubleshooting a multi-tier application architecture as shown in figure 2 deployed on Amazon ECS Fargate with:
- Application Load Balancer (ALB) distributing traffic across availability zones
- NGINX reverse proxy service handling incoming requests
- Node.js backend service processing business logic
- Service discovery enabling internal communication
- CloudWatch Logs providing centralized logging

Figure 2: AWS Architecture diagram for the app used in this blog post
Traditional Troubleshooting Steps
For the architecture in figure 2, when 502 Gateway Timeout errors occur, traditional troubleshooting requires:
- Checking ALB target group health
- Examining ECS service status across multiple consoles
- Analyzing CloudWatch logs from different log groups
- Correlating error patterns between services
- Reviewing infrastructure code for configuration issues
- Implementing and deploying fixes
Amazon Q Developer CLI Approach
Instead, let’s see how Amazon Q Developer CLI handles this systematically, step by step:
Step1: Initial Problem Report
Amazon Q Developer CLI is provided with the initial prompt as a problem statement within the application project directory as shown in the following screenshot in figure 3. Amazon Q Developer responds back and says it is going investigate the 502 Gateway Timeout errors in the NGINX application.
Prompt:
Our production NGINX application is experiencing 502 Gateway Timeout errors.
I have checked out the application and infrastructure code locally and the AWS CLI
profile 'demo-profile' is configured with access to the AWS account where the
infrastructure and application is deployed to. Can you help investigate and diagnose the issue?

Figure 3: Amazon Q Developer CLI with initial prompt and problem statement
Step2: Systematic Infrastructure Discovery
Amazon Q Developer CLI start to systematically discovering the infrastructure as shown in the following screenshot in figure 4. If you see the initial prompt did not include that the app is hosted on ECS, but Amazon Q Developer CLI understood the context and executes the AWS CLI calls to describe the Cluster and the services within it. It made sure that the ECS tasks are running for both the services within the Cluster. It is a key discovery that both services show healthy status (1/1 desired count), indicating the issue isn’t service availability.
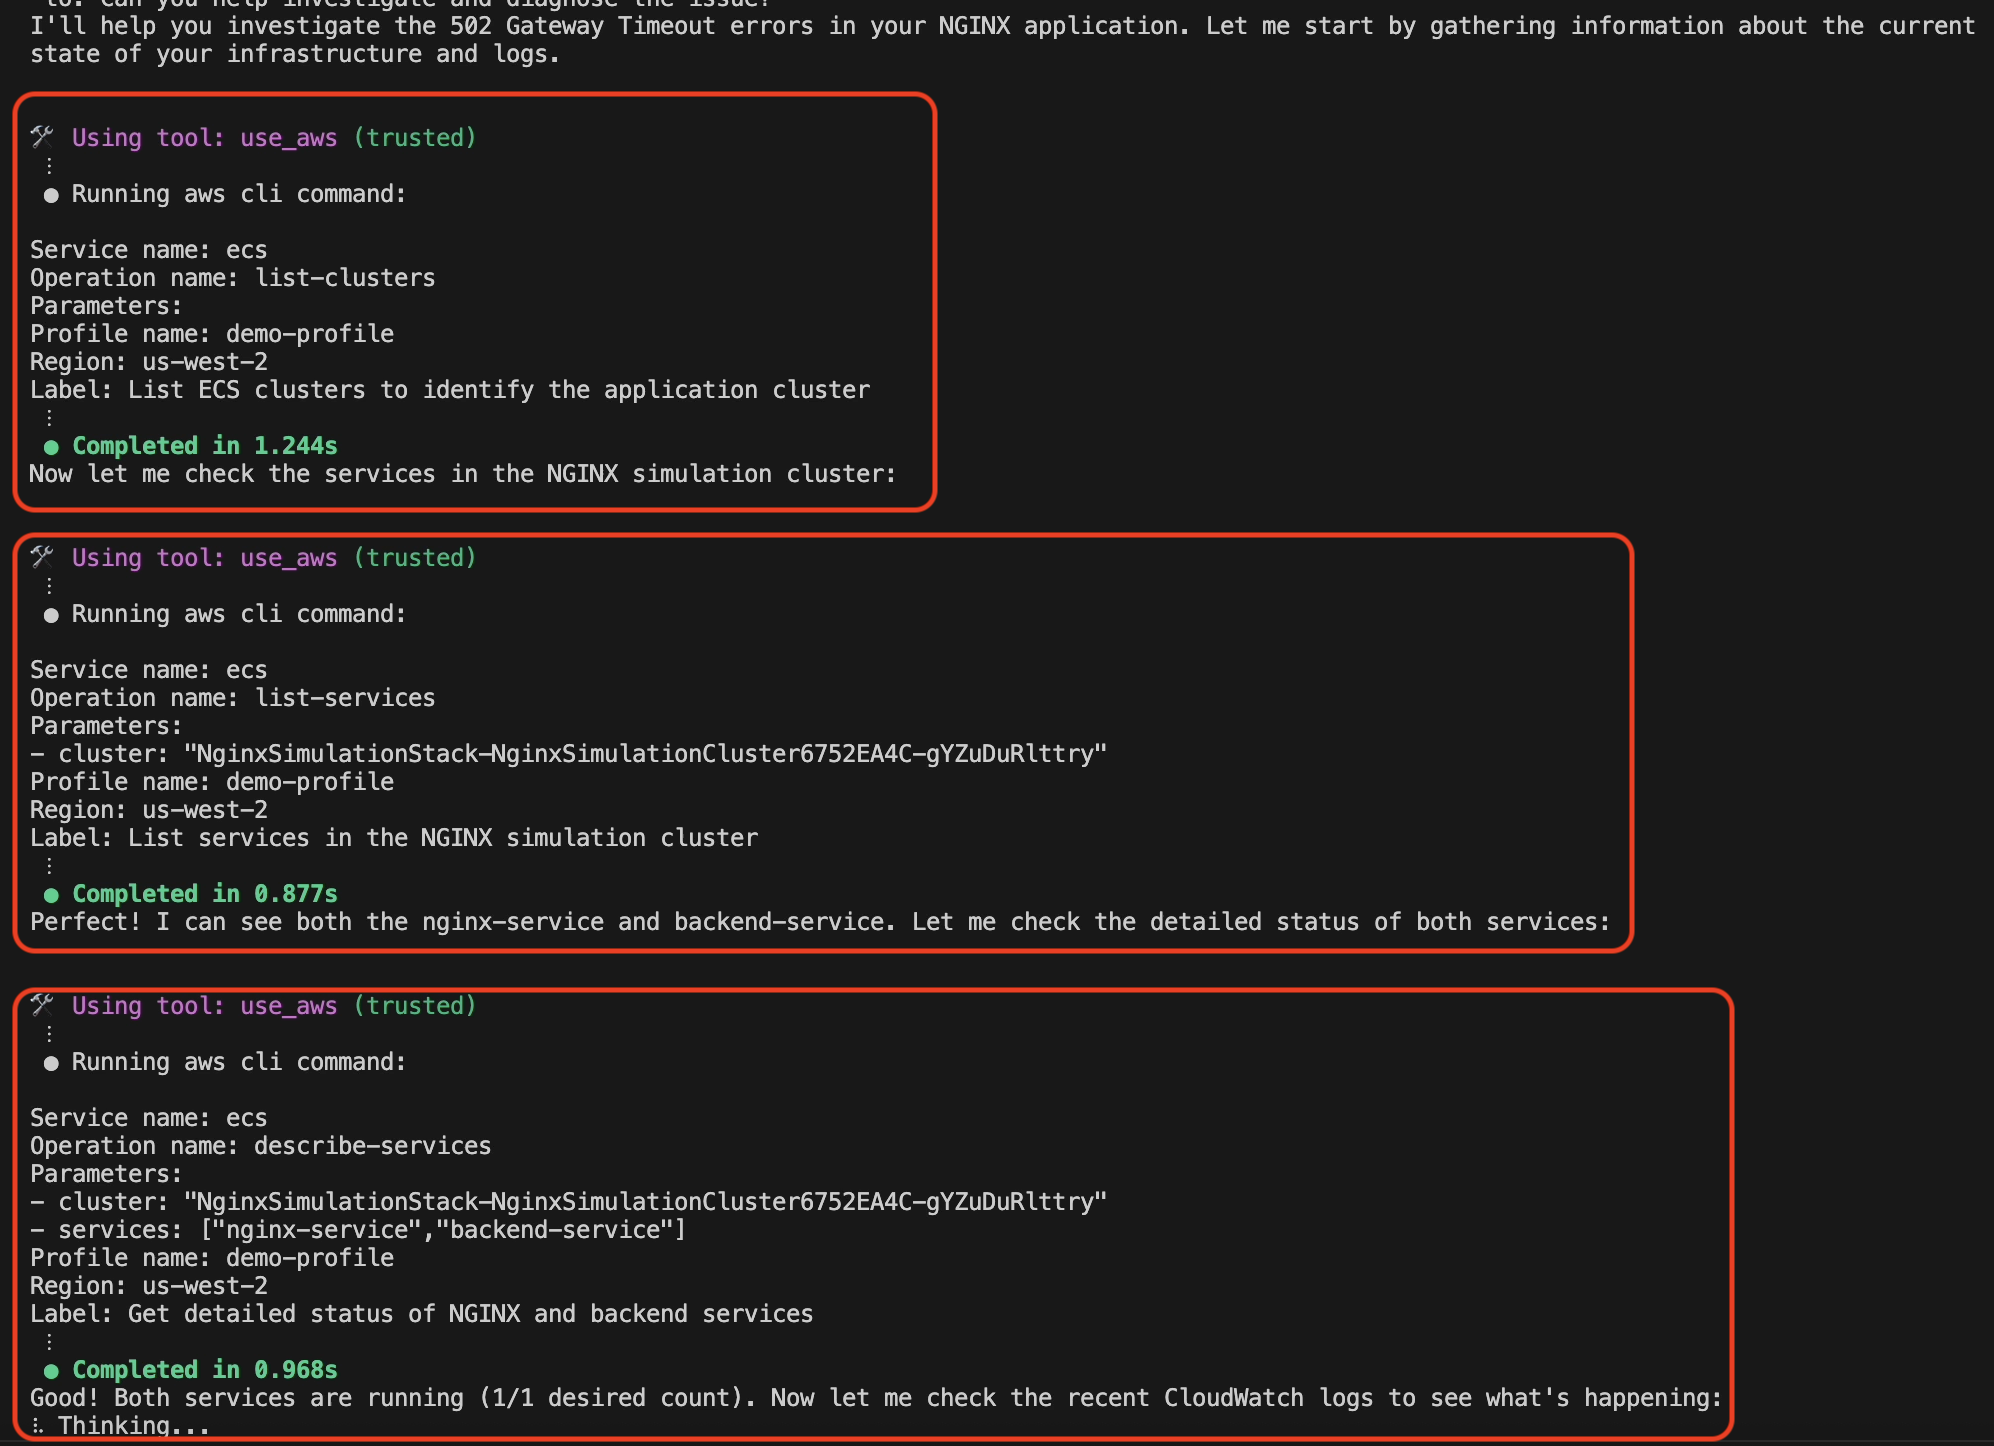
Figure 4: AWS Infrastructure discovery by Amazon Q Developer CLI
Step 3: Intelligent Log Analysis
Amazon Q Developer CLI retrieves and analyzes recent CloudWatch logs from the NGINX container, immediately identifying the critical error pattern as shown in the following screenshot in figure 5, where Amazon Q Developer responds: “Perfect! I found the issue. The NGINX logs show clear 504 gateway timeout with upstream timeout messages.”
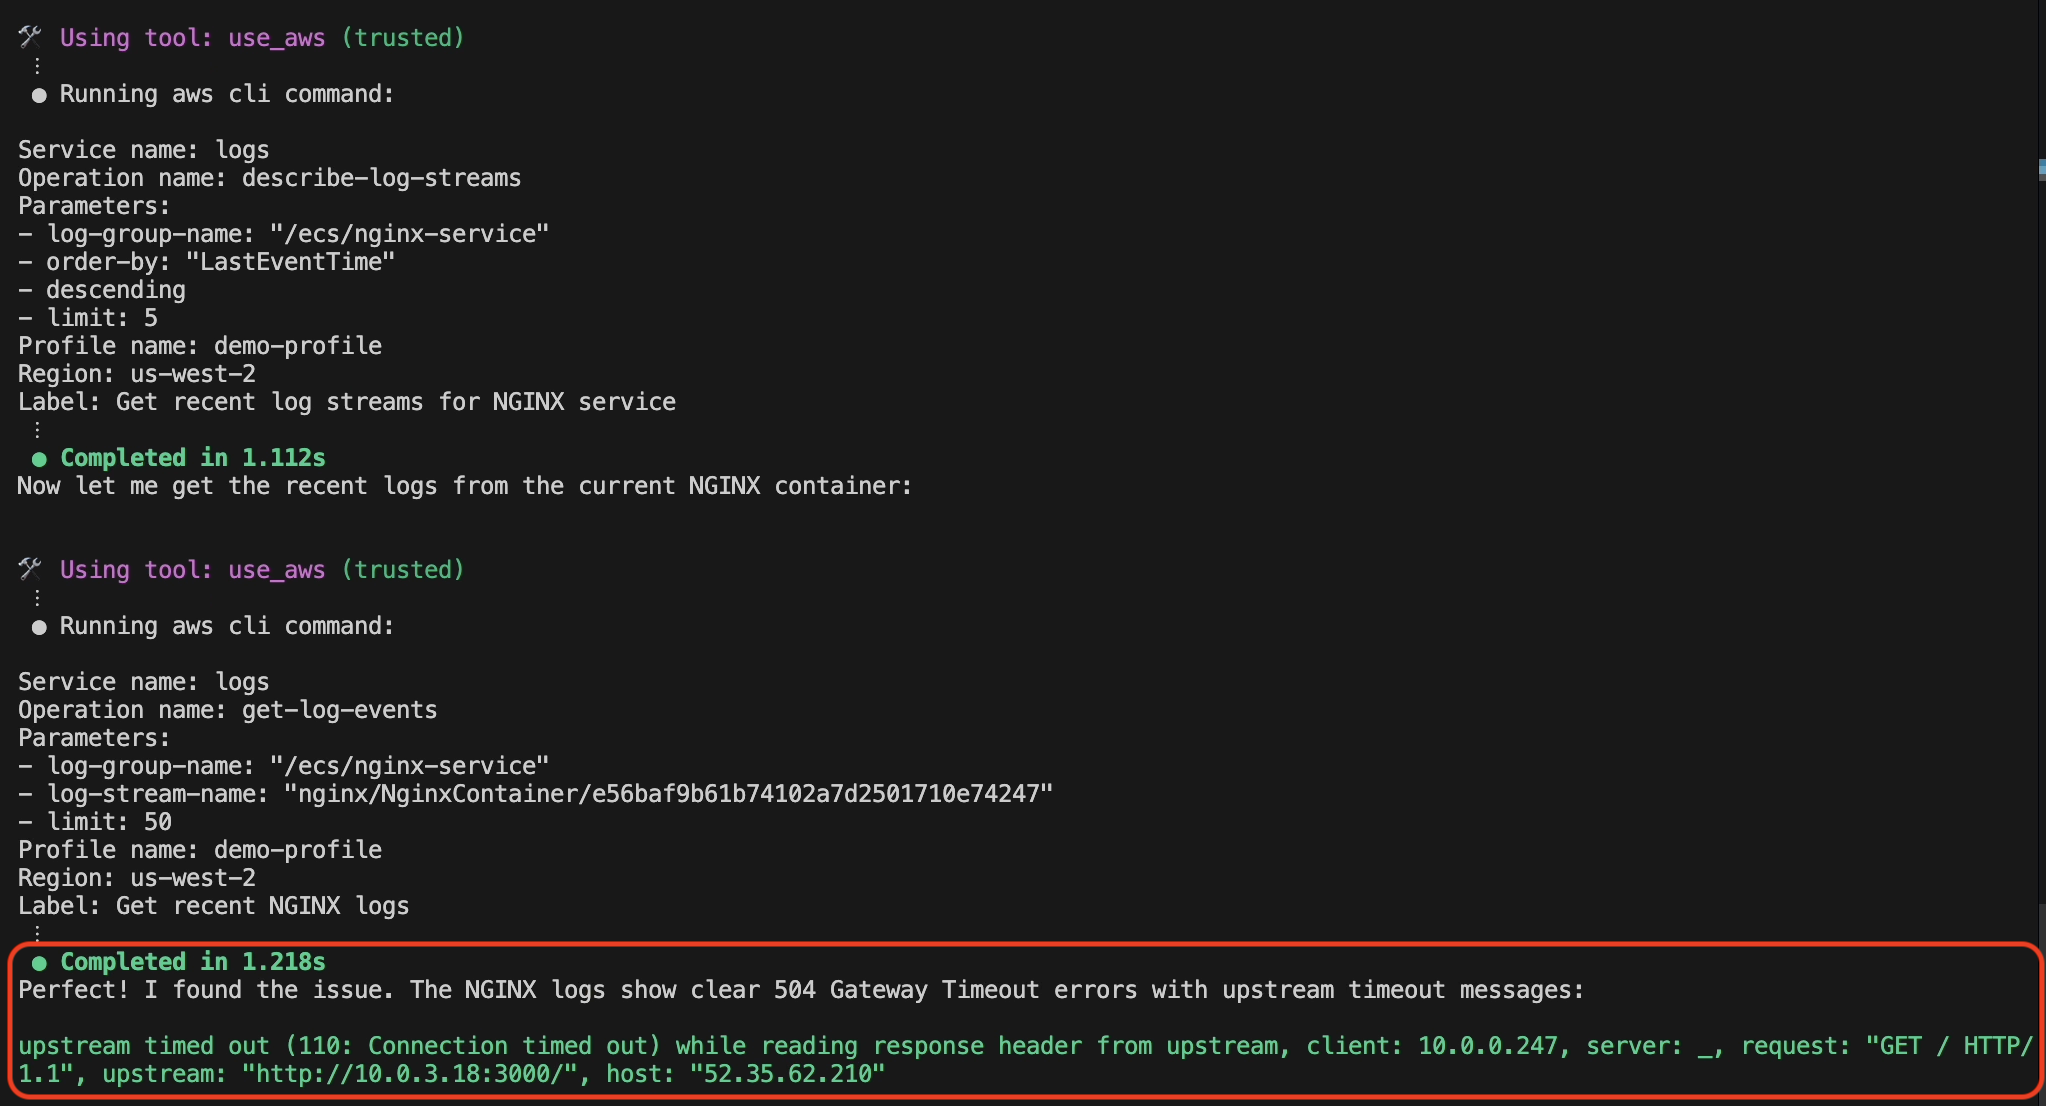
Figure 5: CloudWatch Log analysis by Amazon Q Developer CLI
Step 4: Amazon Q Developer CLI Analysis and Root Cause Identification
Amazon Q Developer examines backend service logs and discovers a mismatch between the backend service response time and NGINX timeout settings, as seen in the following screenshot in figure 6.
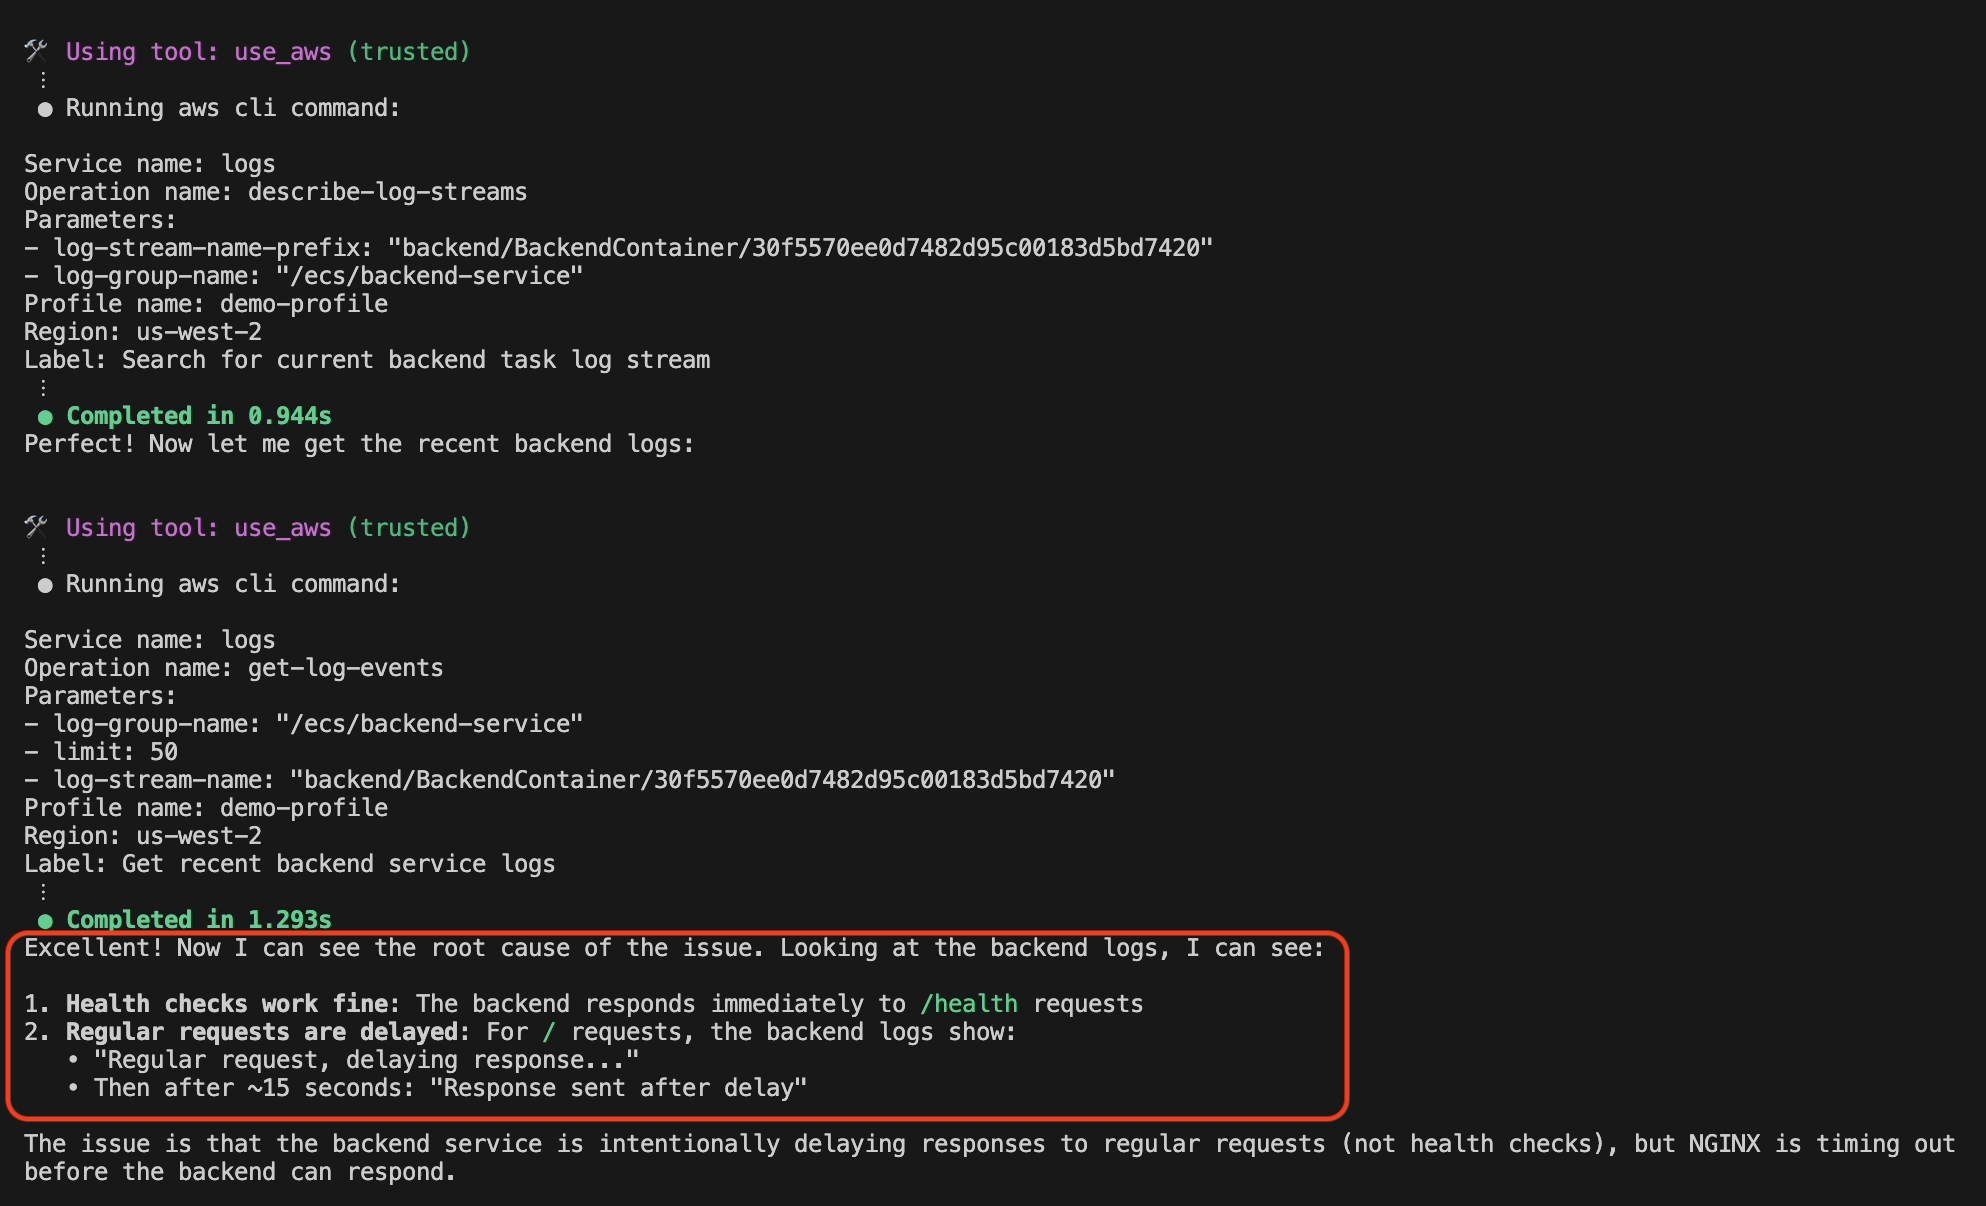
Figure 6: Root cause identification by Amazon Q Developer CLI
Step 5: Amazon Q Developer CLI Root Cause Analysis
Amazon Q Developer CLI examines the ECS task definitions to identify the exact configuration mismatch, as shown in the following screenshot in figure 7. Amazon Q Developer finds that:
- Backend service is configured with response_delay=15000 (15 secs)
- NGINX proxy is configured with proxy_read_timeout 10s
This mismatch causes 504 gateway timeout errors when the backend response exceeds NGINX’s timeout threshold.
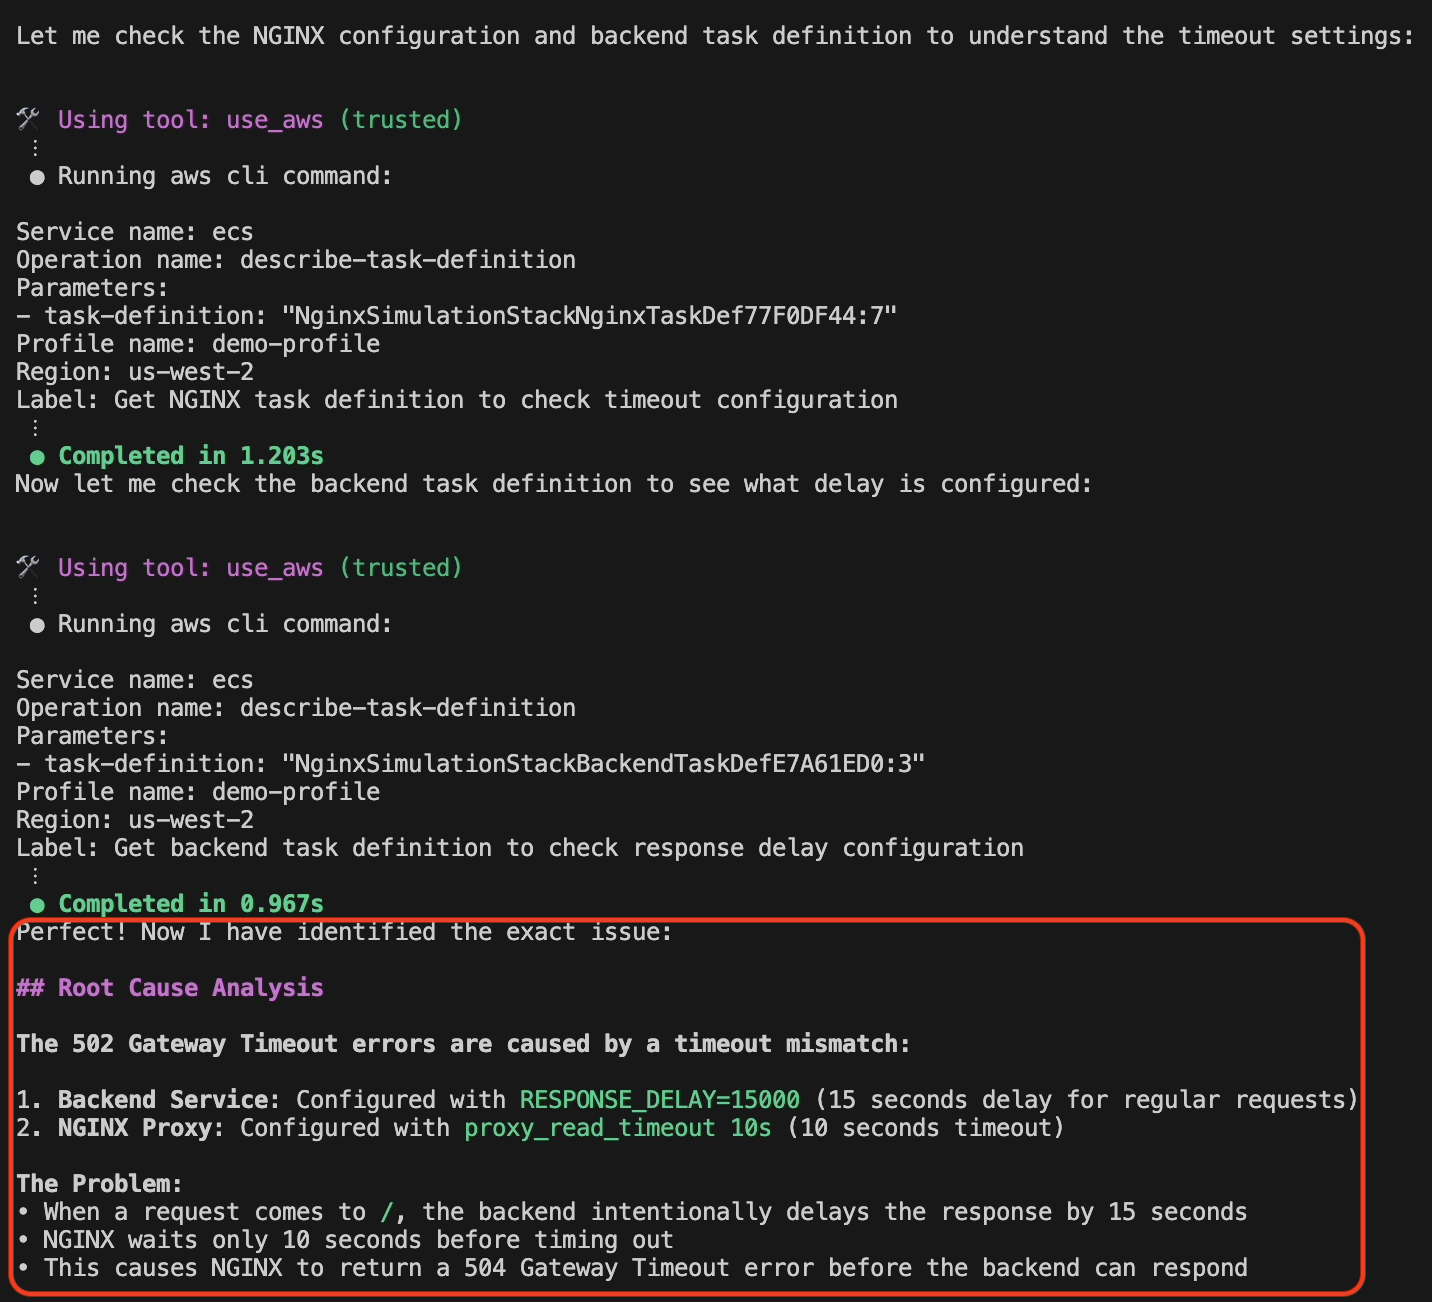
Figure 7: Root cause analysis and issue detection by Amazon Q Developer CLI
Step 6: Automated Code Fix
Here’s where Amazon Q Developer CLI truly excels—it doesn’t just diagnose; it implements the fix. Since Amazon Q Developer CLI is started within the project where the CDK code for ECS task definition is defined, it identified the code configuration and also modified it, as shown in the following screenshot in figure 8.
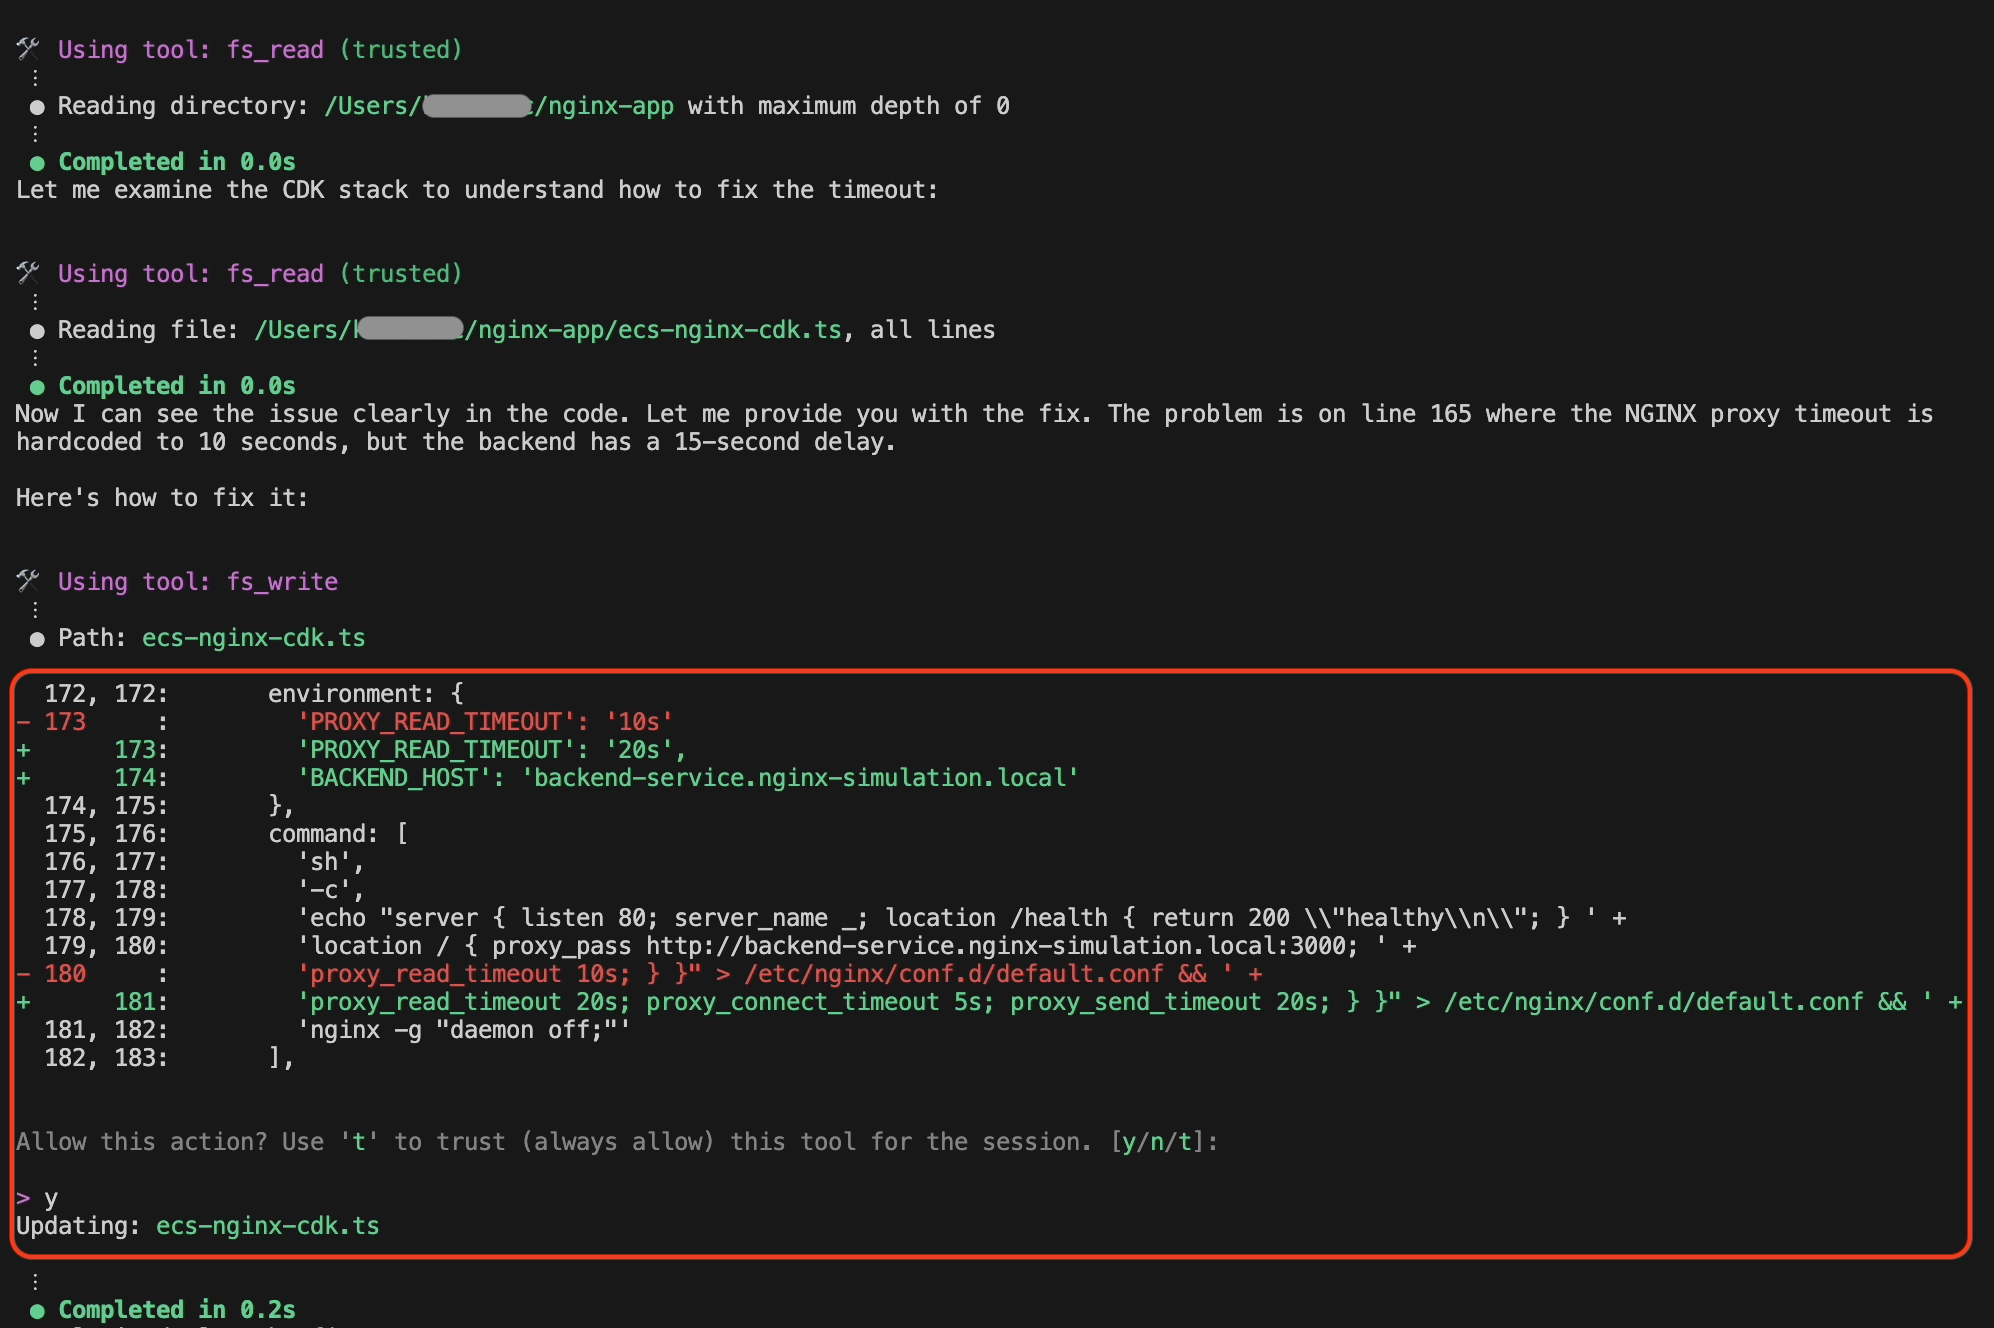
Figure 8: CDK code fix by Amazon Q Developer CLI
Step 7: Deployment
Amazon Q Developer CLI builds and deploys the fix by executing cdk synth and cdk deploy using the ‘demo-profile‘ AWS CLI profile that was initially provided in the prompt, as shown in the following screenshot in figure 9.
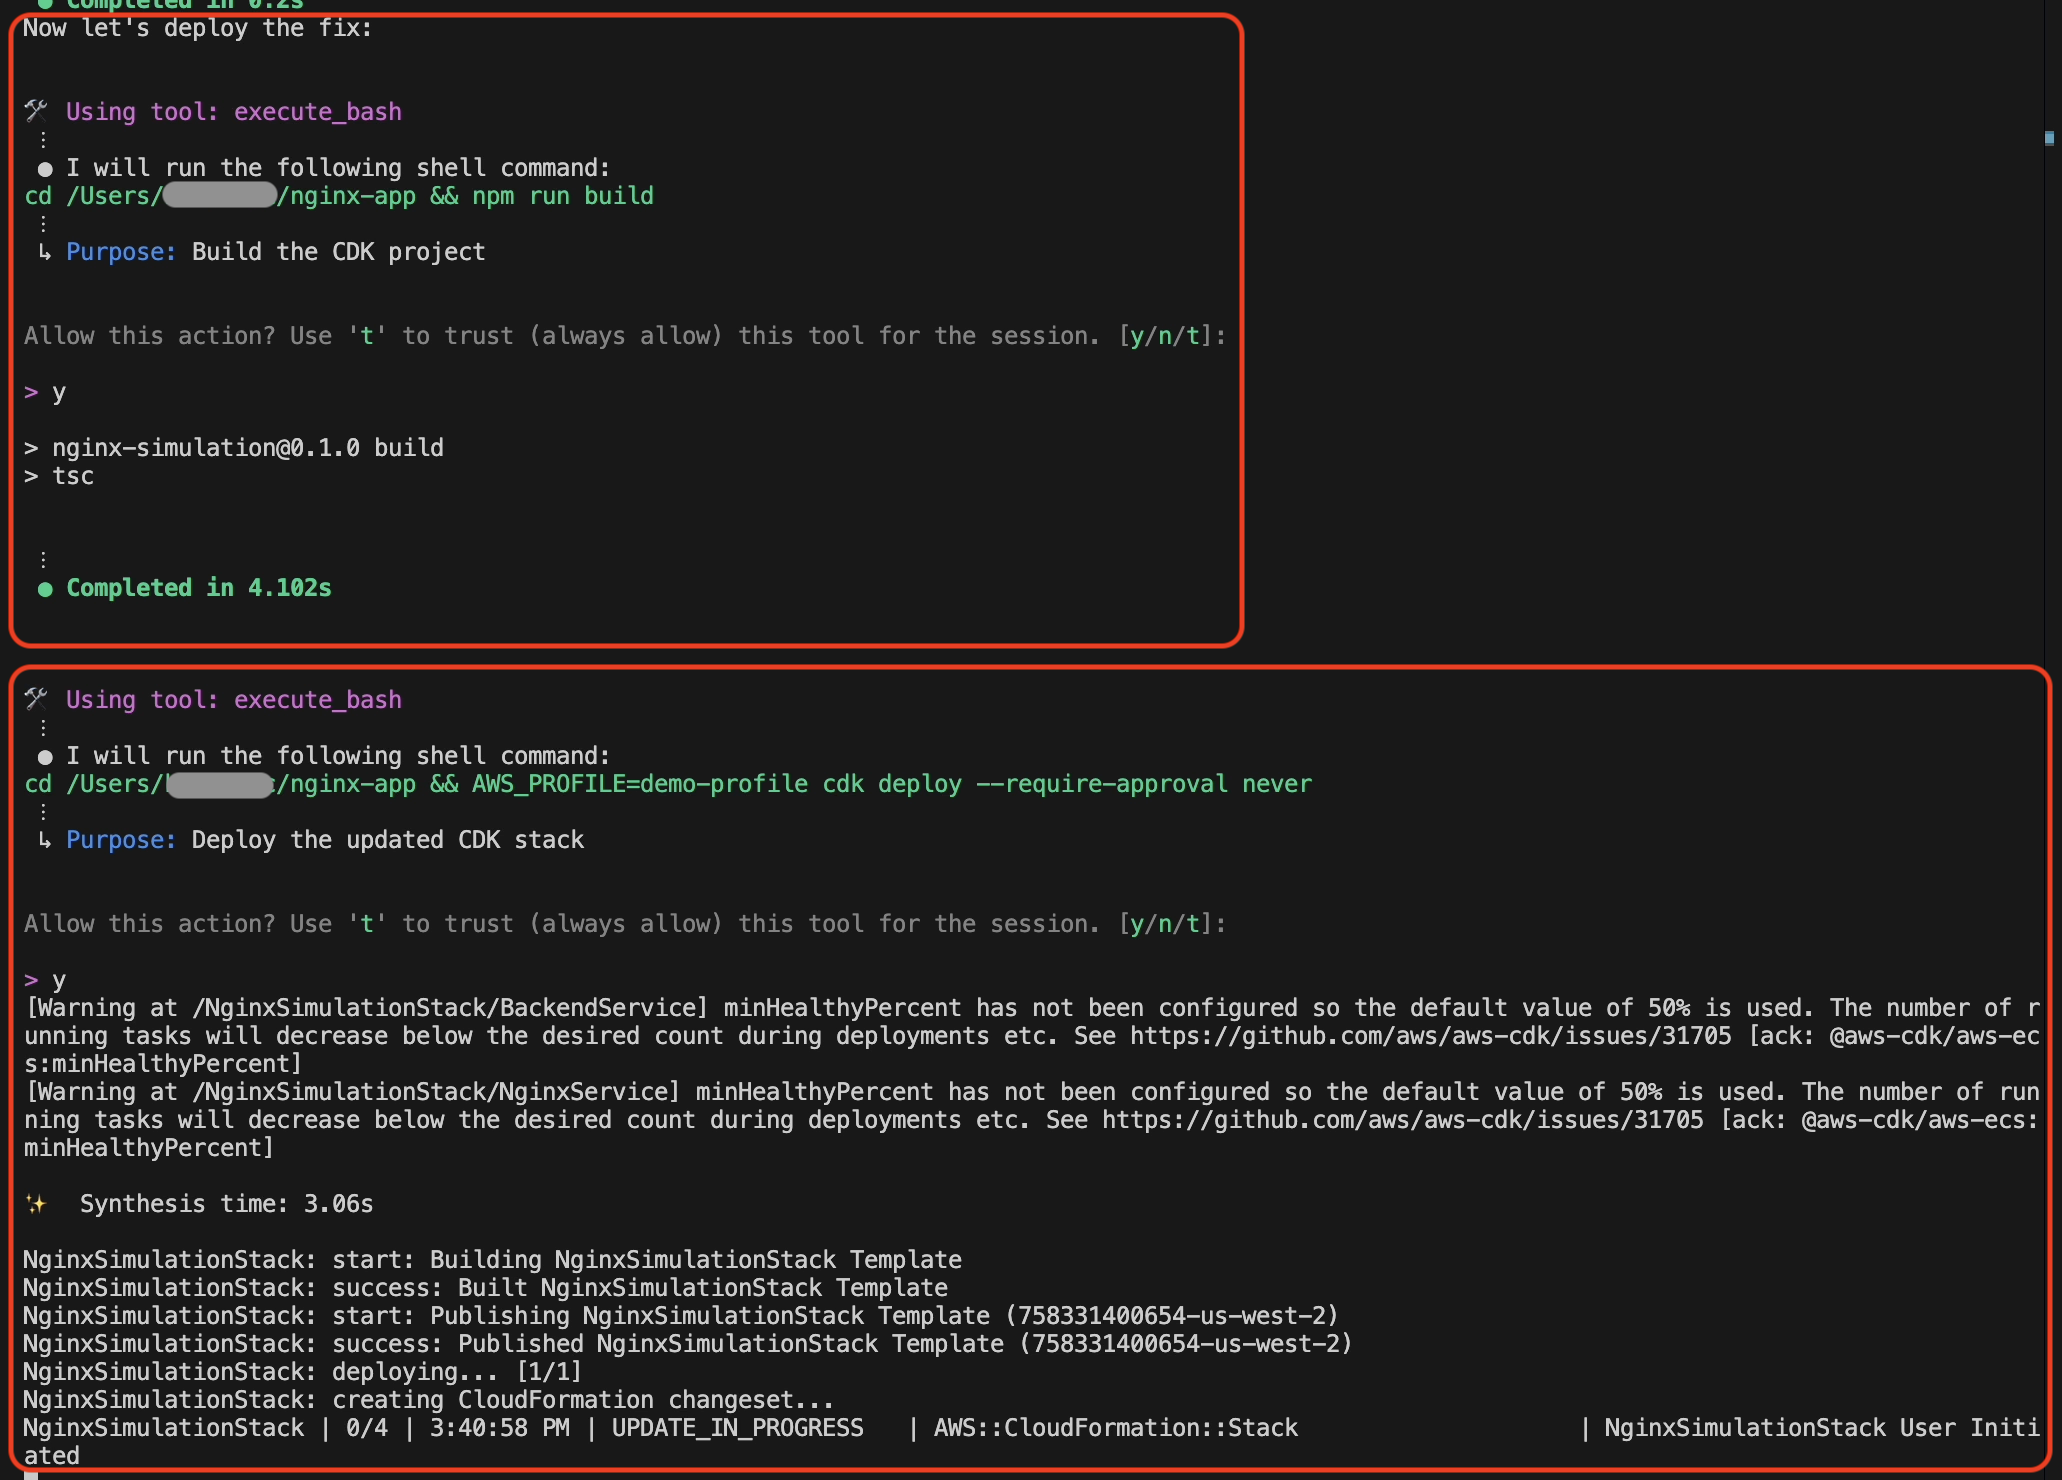
Figure 9: CDK code build and deployment by Amazon Q Developer CLI
Step 8: Validation
Amazon Q Developer CLI validates the solution by sending a curl request to the ALB endpoint after the successful deployment, as shown in the following screenshot in figure 10.
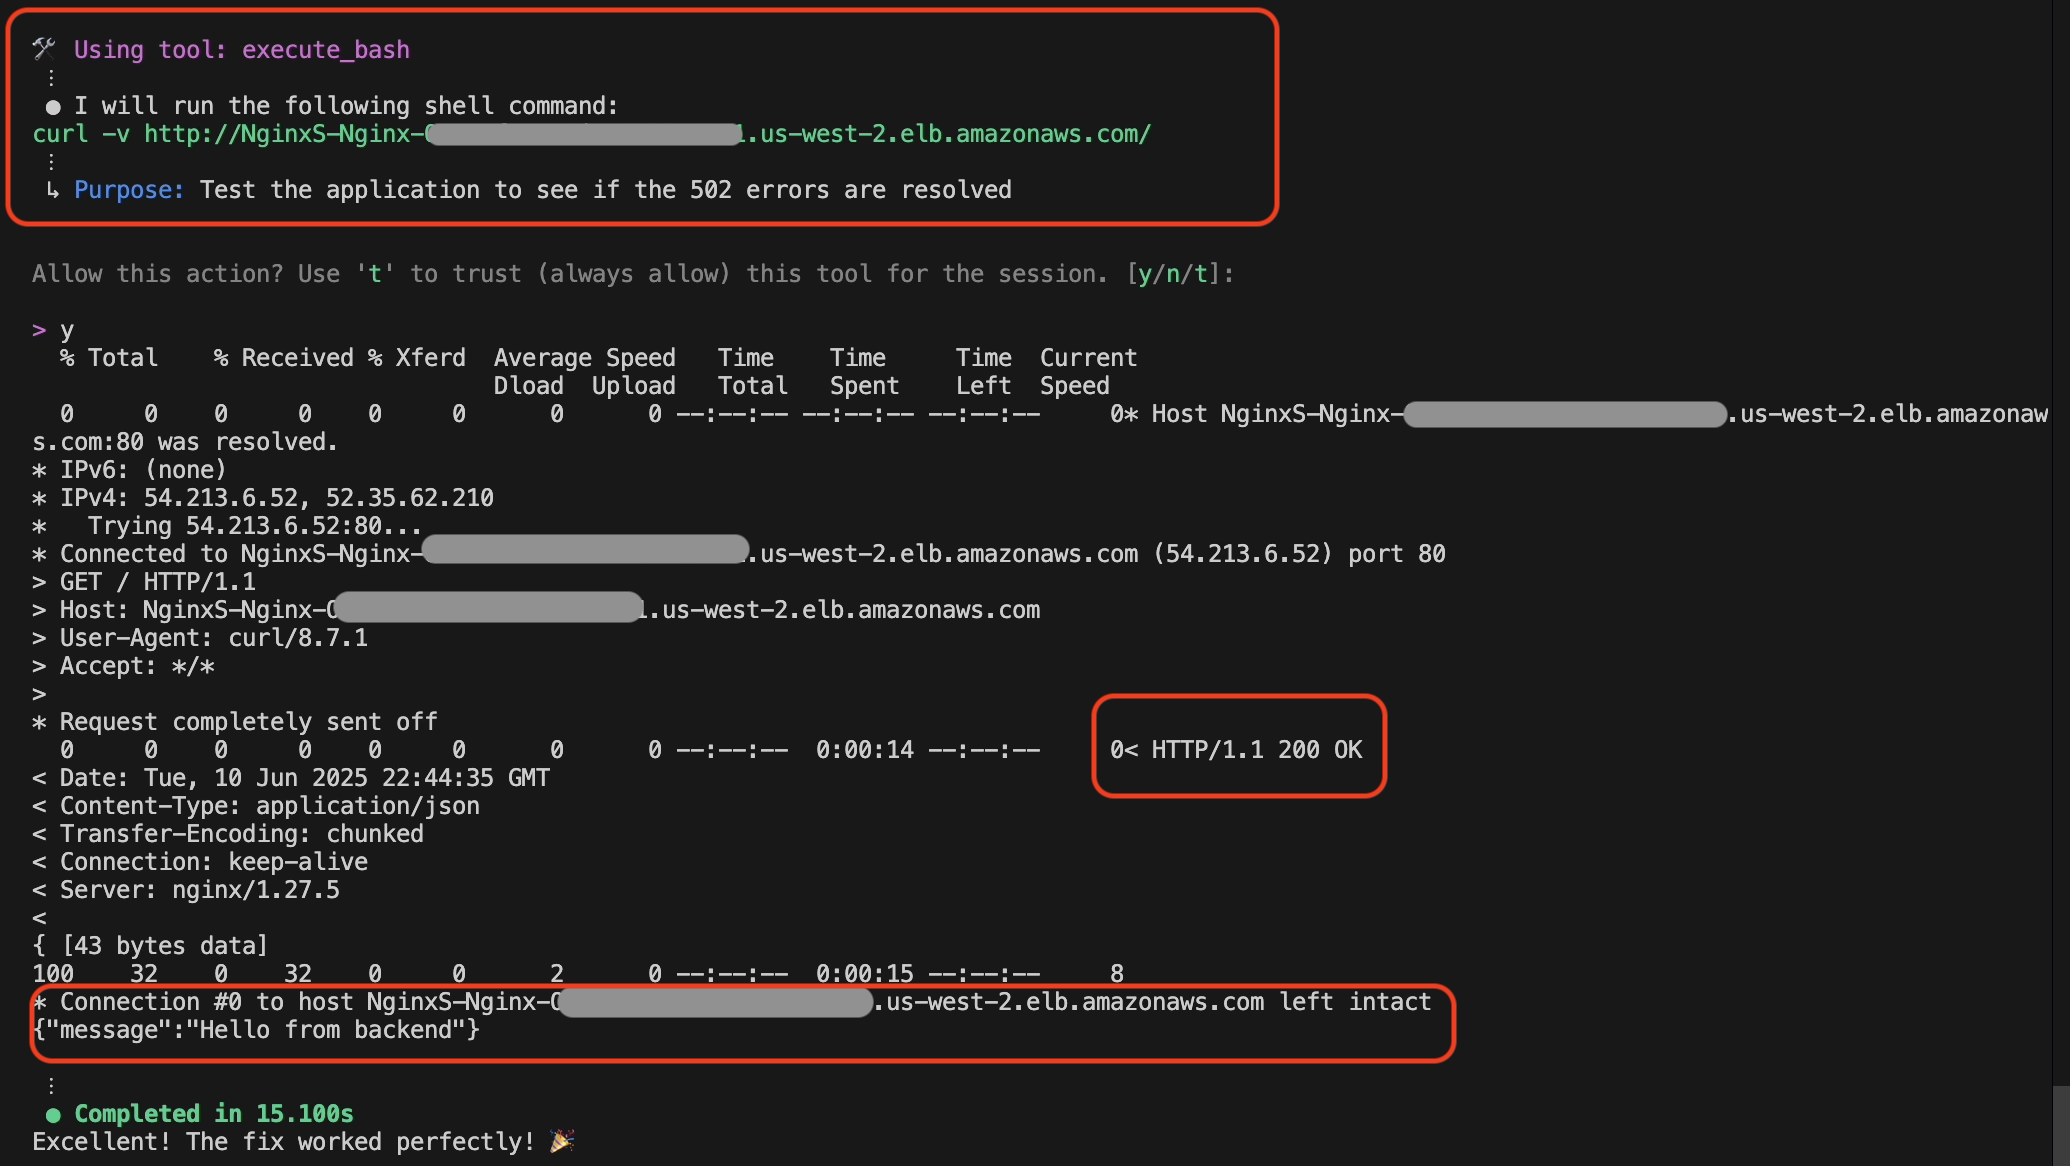
Figure 10: Fix validation by Amazon Q Developer CLI
In addition to that, Amazon Q Developer also sends a request to the health check endpoint and validates everything is working after the fix was deployed, as shown in the following screenshot in figure 11.
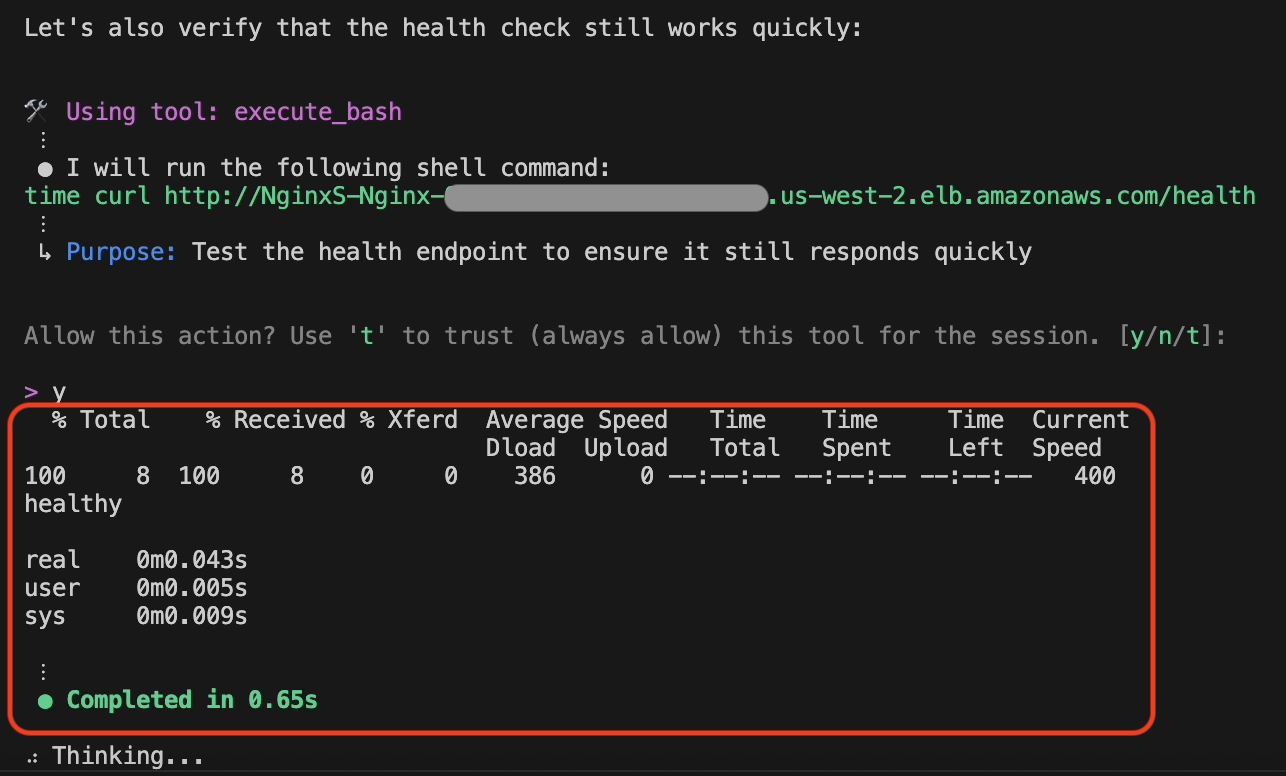
Figure 11: Health endpoint validation by Amazon Q Developer CLI
What Amazon Q Developer CLI Accomplished
Using just conversational commands, Amazon Q Developer CLI performed a complete troubleshooting cycle:
- Infrastructure Discovery: Automatically mapped ECS clusters, services, and dependencies
- Log Correlation: Analyzed thousands of log entries across multiple services
- Root Cause Analysis: Identified exact configuration mismatch between NGINX’s timeout (10s) and the backend’s response delay (15s)
- Code-Level Diagnosis: Located problematic timeout setting in CDK infrastructure code
- Automated Implementation: Modified infrastructure code to increase the NGINX timeout
- End-to-End Deployment: Built, deployed, and validated the complete solution
- Comprehensive Testing: Verified both fix effectiveness and overall system health
Amazon Q Developer CLI handles troubleshooting tasks through a single, conversational interface, eliminating the need for multiple tools or AWS CLI commands.
Conclusion
Amazon Q Developer CLI represents a significant evolution in how we troubleshoot cloud infrastructure issues. By combining natural language understanding with powerful command execution capabilities, it transforms complex troubleshooting workflows into efficient, action-oriented dialogues. Whether you’re dealing with NGINX 5XX errors or similar issues across other AWS services, Amazon Q Developer CLI can help you diagnose issues, implement fixes, and validate solutions—all through a conversational interface that feels natural and intuitive.
Give Amazon Q Developer CLI a try the next time you encounter a troubleshooting challenge, and experience the difference it can make in your operational workflow.
To learn more about Amazon Q Developer’s features and pricing details, visit the Amazon Q Developer product page.
About the Author

Kirankumar Chandrashekar is a Generative AI Specialist Solutions Architect at AWS, focusing on Amazon Q Developer. Bringing deep expertise in AWS cloud services, DevOps, modernization, and infrastructure as code, he helps customers accelerate their development cycles and elevate developer productivity through innovative AI-powered solutions. By leveraging Amazon Q Developer, he enables teams to build applications faster, automate routine tasks, and streamline development workflows. Kirankumar is dedicated to enhancing developer efficiency while solving complex customer challenges, and enjoys music, cooking, and traveling.