AWS DevOps & Developer Productivity Blog
Streamline DevOps troubleshooting: Integrate CloudWatch investigations with Slack
Infrastructure alerts pose a challenge for DevOps teams, particularly when they occur outside of regular business hours. The complexity isn’t merely in receiving notifications, it lies in rapidly assessing their severity and determining the root cause. This challenge is compounded when upstream service disruptions cascade into multiple downstream alerts, creating a confusion of notifications that mask the true source of the problem. DevOps teams find themselves working backwards through a complex web of interconnected services, unsure whether to start investigating at the application, network, or infrastructure level.
To reduce resolution time and alert root cause analysis, AWS introduced CloudWatch Investigations, a generative AI-powered capability within Amazon CloudWatch. Powered by Amazon Q Developer, a generative AI–powered assistant for software development, CloudWatch investigations analyzes multiple metrics, logs, and deployment events to provide suggestions for remediation and root-cause analyses, reducing alarm resolution time. A key advantage of this feature is the ability to integrate these findings directly into Microsoft Teams and Slack, making sure developers and stakeholders receive immediate alerts when issues arise. This centralized collaboration approach enables teams to work together efficiently, reducing duplicate efforts and facilitating consistent problem-solving across the organization.
In this blog post, we will walk through how to integrate CloudWatch Investigations with Slack channels and demonstrate how to interact with investigations in Slack.
Overview of the solution
CloudWatch Investigations can be started in multiple ways, like from existing Amazon CloudWatch log insights, metrics, or alarms. To demonstrate CloudWatch Investigations functionalities, we will use CloudWatch alarms in a sample web application available in the aws-samples GitHub repository. Steps on how to deploy this web app in your AWS environment, via a CloudFormation template, can be found here. You can learn more about the architecture of the resources deployed in the AWS One Observability workshop. If you choose to deploy the sample web application, you will be responsible for all service charges associated with the CloudFormation template deployment. Alternatively, you can use existing CloudWatch alarms in your environment. Examples of common Amazon CloudWatch alarms include: MemoryUtilization, CPUUtiliziation, 5xxErrors and 4xxError. A full list of available alarms can be found here.
For this blog, we will utilize a pre-configured alarm to monitor when one of the website services, backed by an Application Load Balancer, experiences abnormal response times. When the alarm triggers, CloudWatch Investigations automatically initiates an investigation, analyzing both the current alarm state and 90 days of CloudTrail event history to generate hypotheses and determine potential root causes. The investigation insights are published to a Slack channel via Amazon Q Developer in Chat Applications and Amazon Simple Notification Service (SNS).
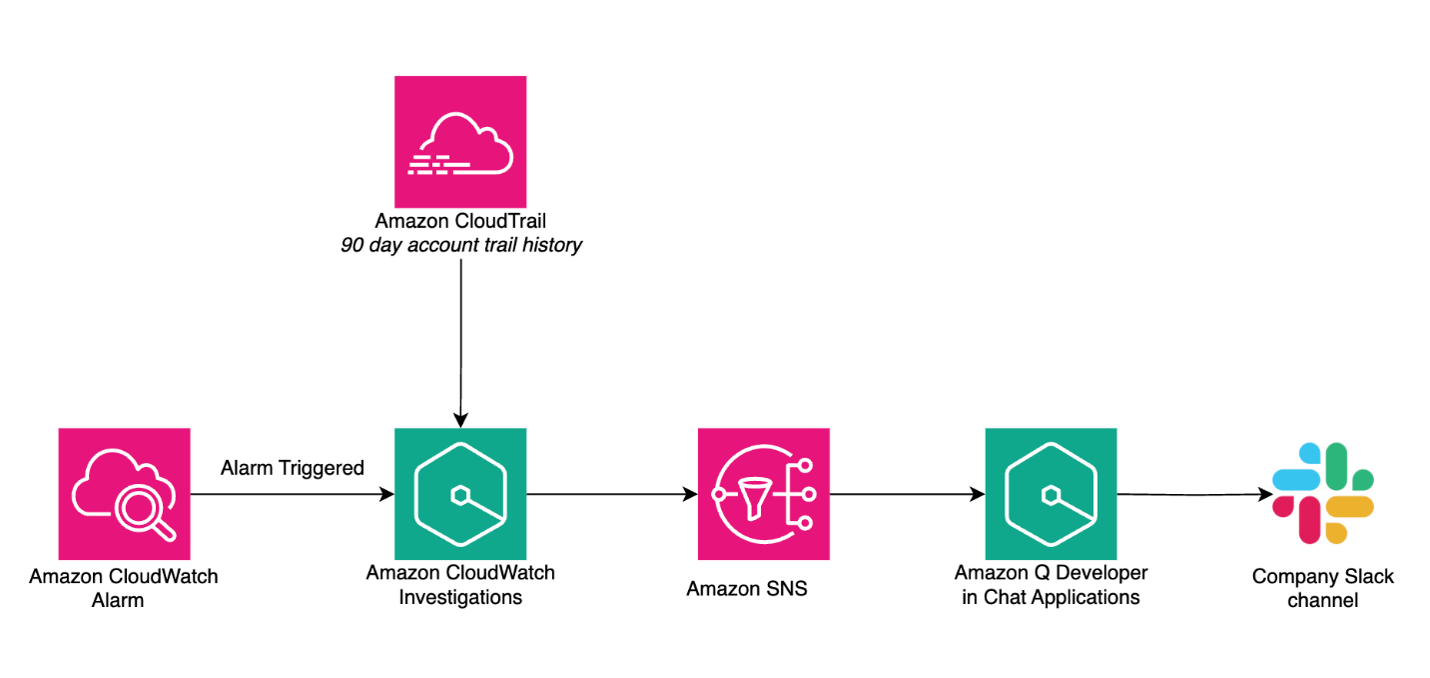
Figure 1. Architecture diagram of the services involved in the investigation integration in Slack
Prerequisites
- Launch the Amazon CloudFormation template associated with the One Observability lab outlined in the AWS Samples GitHub.
- Set up a Standard Amazon SNS topic by following the instructions outlined here. To enable CloudWatch investigations to send notifications to Slack, you must add an access policy to the Amazon SNS topic, an example can be found here.
- When the topic configuration is complete, navigate to Amazon Q Developer in Chat Applications (formerly AWS Chatbot) to configure the integration between Amazon Q and Slack by following the instructions outlined here. To allow channel members to interact with the investigation in Slack, add the following permission templates to the Channel role settings: Notification Permissions, Amazon Q Permissions, and Amazon Q Operations assistant permissions. More details on these permissions can be located here.
Setting up CloudWatch Investigations
To get started, navigate to the Amazon CloudWatch console. Choose AI Operations and then Configuration.
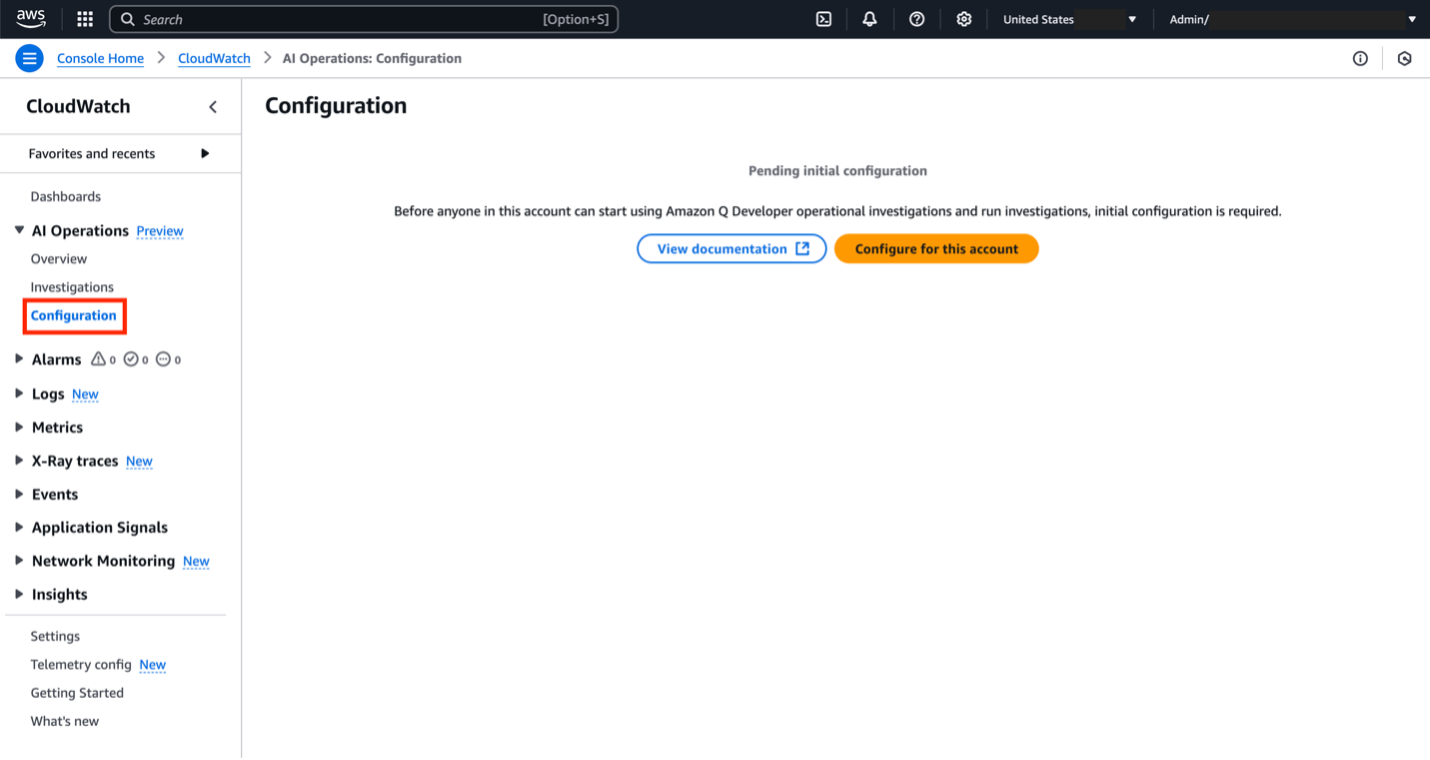
Figure 2. Configure for this account button within the AWS Console
Before we can set up an investigation, we need to create an investigation group. This is an organizational structure to manage common properties of the investigation like retention requirements, encryption, access permissions and the SNS topic linked. Click Configure for this account and follow the prompts in the console to set up the investigation group. Detailed explanations for each prompt are located in the documentation here. For this demo, we left the default options for steps 1 and 2 of the prompts. In step 3, please select the existing SNS topic created in the prerequisites section.
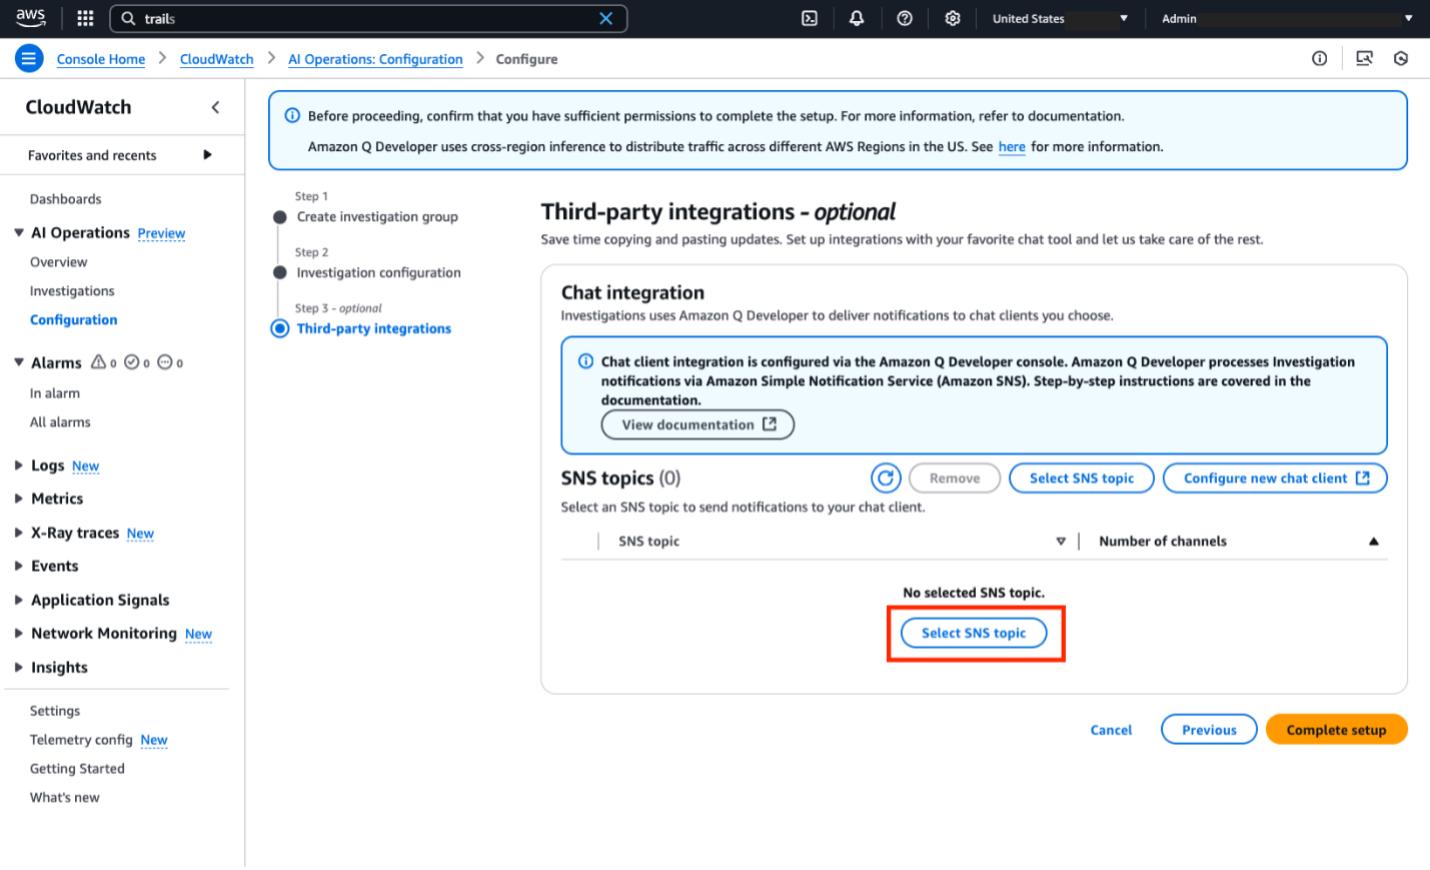
Figure 3. Select SNS topic for Q Developer Operational Insights
For the investigation trigger, we will use an existing alarm created by the CloudFormation deployment mentioned at the beginning of this blog. The sample alarm is named:
ApplicationInsights/Services/AWS/ApplicationELB/TargetResponseTime/app/Servic-lista-...
and it goes into ALARM state when one of the website services, backed by an Application Load Balancer, experiences abnormal response times.
To configure this alarm to automatically start an investigation when it goes into an ALARM state:
- In the CloudWatch console, choose Alarms, All alarms
- Search for the alarm name and click on it
- Choose Actions, Edit
- Choose Next once to skip the metrics and conditions section
- Choose Add investigation action and then select your investigation group as outlined in figure 4
- Choose Skip to Preview and create, then choose Update alarm
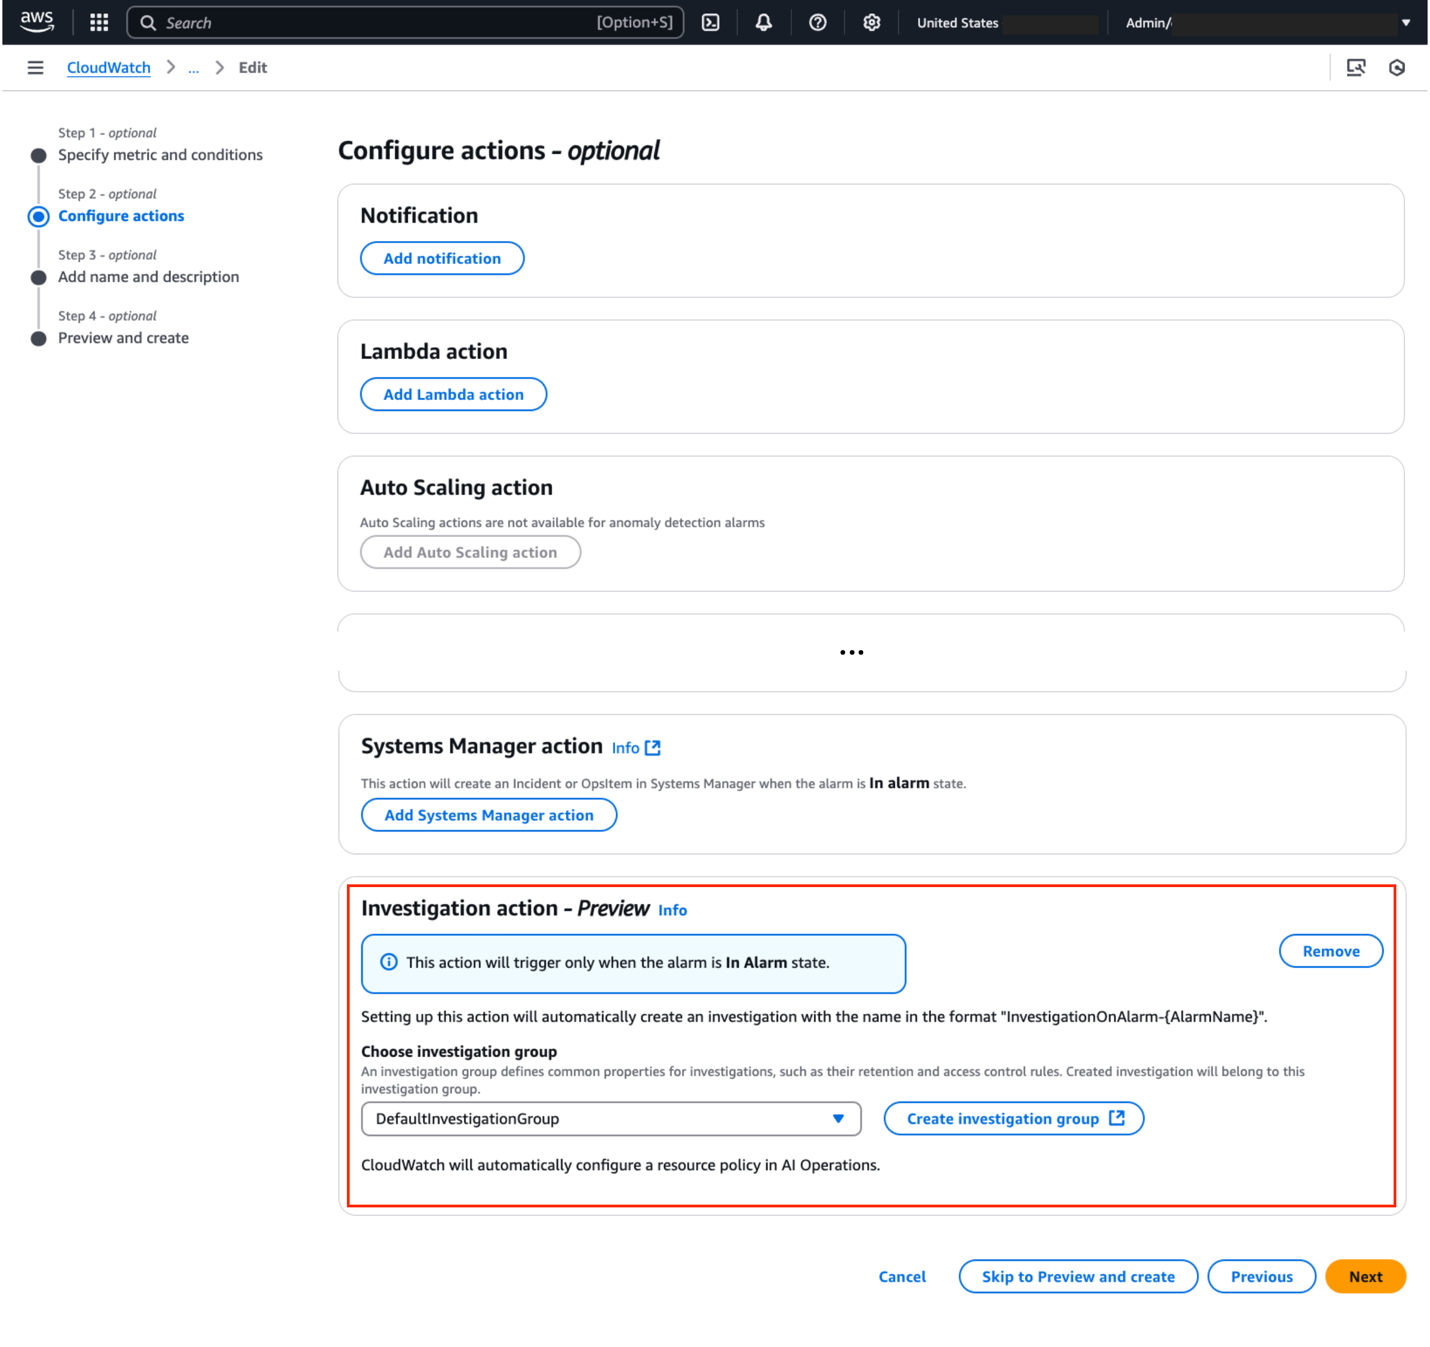
Figure 4. Configure alarm to automatically start investigations
Testing the solution
At this point, we are ready to test the solution. To simulate a website traffic overload and trigger the alarm, we are going to use Amazon ECS tasks deployed as part of the sample web application. Open up CloudShell and run the following command:
PETLISTADOPTIONS_CLUSTER=$(aws ecs list-clusters | jq '.clusterArns[]|select(contains("PetList"))' -r)

TRAFFICGENERATOR_SERVICE=$(aws ecs list-services --cluster $PETLISTADOPTIONS_CLUSTER | jq '.serviceArns[]|select(contains("trafficgenerator"))' -r)

aws ecs update-service --cluster $PETLISTADOPTIONS_CLUSTER --service $TRAFFICGENERATOR_SERVICE --desired-count 5
The command will launch 5 instances of the Amazon ECS traffic generator container task. Once the tasks are running (after about 5 minutes), the ALB will become overloaded with requests, forcing the alarm into ALARM state as shown below. You should also see a new investigation created.
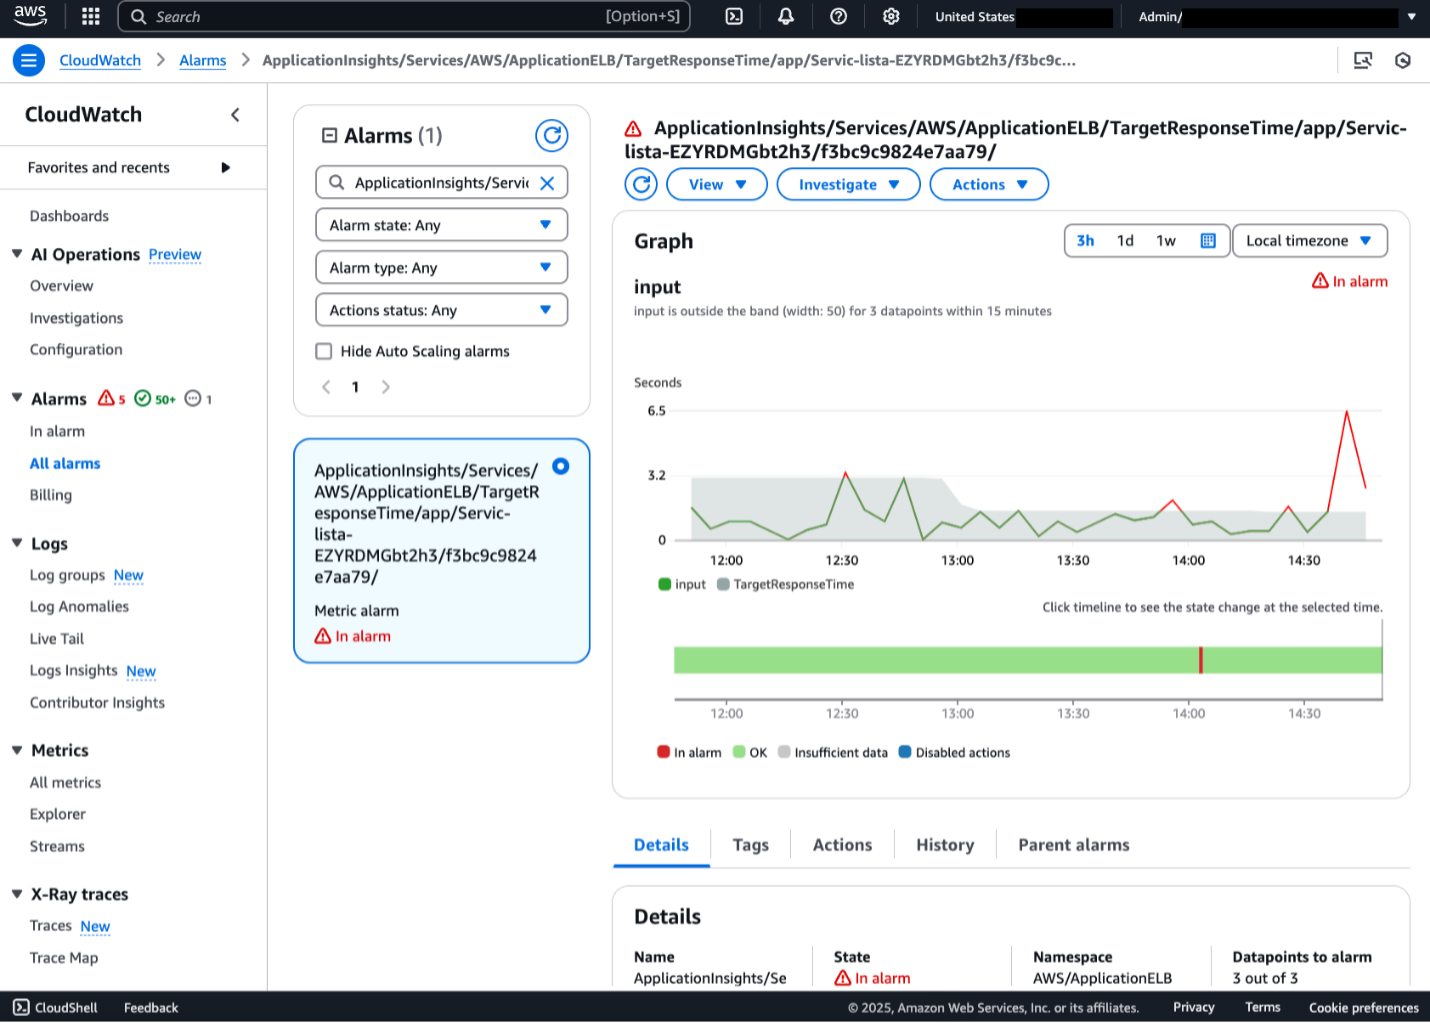
Figure 5. CloudWatch Alarm in ALARM state
Interacting with the investigation via Slack
Once the alarm is triggered, an investigation is initiated. Since we associated the investigation with an Amazon SNS topic and subscribed our Slack client to it, we can see a message in our Slack channel from Amazon Q as seen in figure 6.
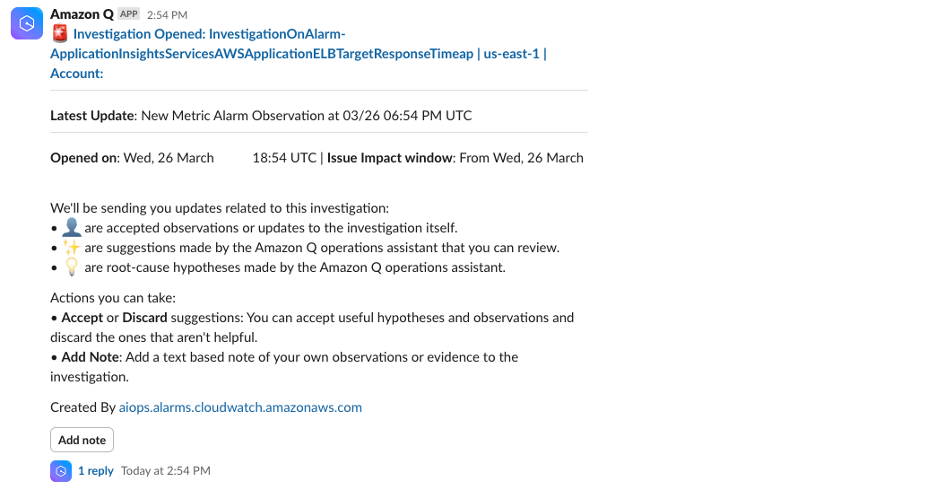
Figure 6. Slack notification for open investigation
Within Slack, channel members can accept useful hypotheses and discard unhelpful ones by clicking on the Accept or Discard button. They can also add text-based notes of observations or evidence to the investigation by clicking on the Add Note button. Amazon Q will respond to messages within the same thread as the original investigation message. Channel members will be able to track who has accepted or discarded messages, as well as notes made about the investigation. This emphasizes the power of Slack integration, as teams can collaborate on the investigation and track who is actively working on it. It is important to note that CloudWatch Investigations uses Generative AI and may provide suggestions different from those below based on your specific account environment.
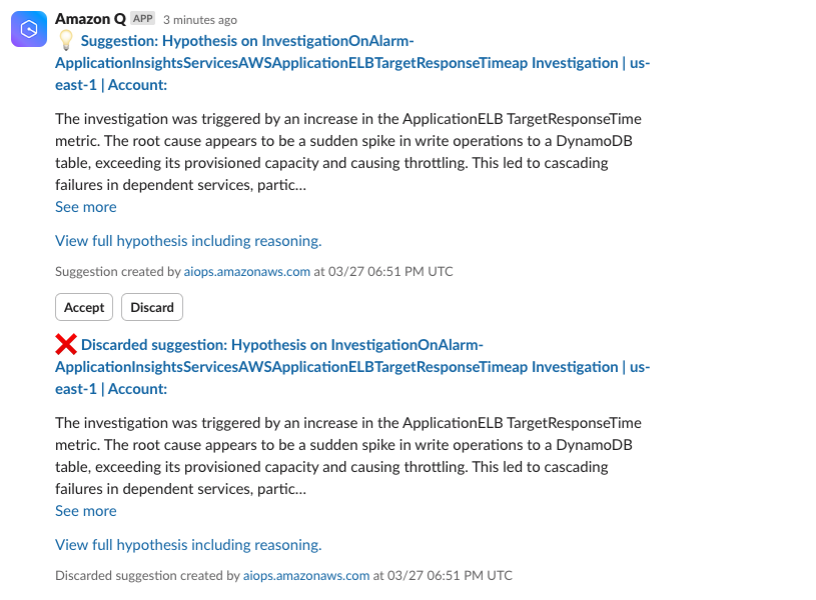
Figure 7. Accept or discard investigation suggestions from Slack
When integrated with Slack, CloudWatch Investigations can provide suggestions and root-cause hypotheses. Channel members with appropriate permissions can access metrics, charts, and additional information related to the investigation by clicking the blue header at the top of the investigation message. This link will direct users to the CloudWatch Investigations feed in the AWS console as shown below in figure 8.
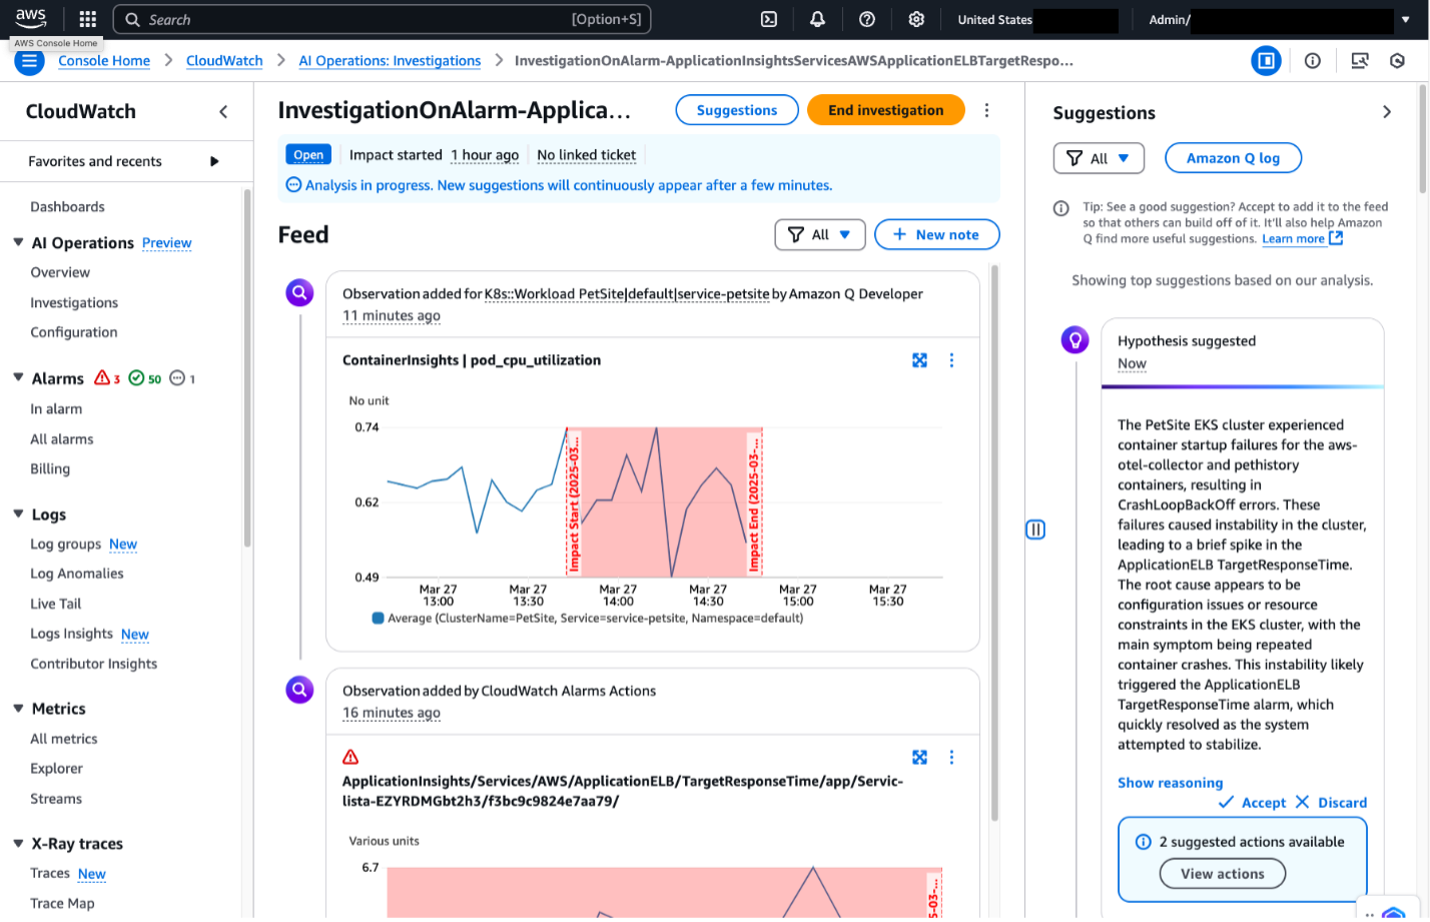
Figure 8. CloudWatch Investigations in CloudWatch console.
Integrating CloudWatch Investigations with Slack or Teams channels improves developers’ visibility of arising issues and provides targeted recommendations to reduce alarm resolution time. The Accept and Discard buttons make it straightforward to track who is actively working on an investigation, fostering a culture of collaboration. The best part? The integration is quick to set up, especially with existing alarms.
Clean Up
If you launched the CloudFormation template mentioned at the beginning of this blog, the services will continue to run unless you delete them. To make sure that you are not charged for use of the resources after the demo, please follow the below steps to delete the resources created as part of the steps performed on this blog.
- Remove the Amazon Q in Chat Applications Slack integration by clicking on Remove Workspace Integration and policy as explained here.
- Delete Amazon SNS topic and subscription as explained here.
- Remove the CloudWatch Investigations as explained here.
- Delete the images under the Amazon ECR repository named
cdk-…-container-assets…as explained here. - Open the CloudShell console or AWS CLI and execute the two commands below:
curl https://raw.githubusercontent.com/aws-samples/one-observability-demo/main/PetAdoptions/cdk/pet_stack/resources/destroy_stack.sh | bash

aws cloudformation delete-stack –stack-name CDKToolkit
After executing the above command, the resources of the demo should be destroyed. Look at the CloudFormation console in case of potential errors.
Conclusion
The new CloudWatch Investigations feature reduces alarm resolution time for development teams by providing actionable insights and recommendations. It is straightforward to connect investigations to a team’s primary form of communication, such as Teams or Slack, to improve notification awareness and interaction. To learn more about the capabilities of CloudWatch Investigations check out the feature announcement and documentation.
Happy investigating!