AWS Database Blog
Use AWS FIS to test the resilience of self-managed Cassandra
Database outages can have devastating effects on your applications and business operations. For teams running self-managed Apache Cassandra clusters, unexpected node failures or memory issues can lead to service degradation, data inconsistency, or even complete system outages. How can you be confident your Cassandra deployment will remain resilient when things go wrong?
AWS Fault Injection Service (AWS FIS) is a managed service that you can use to perform fault injection experiments on your AWS workloads. Fault injection is based on the principles of chaos engineering. These experiments stress an application by creating controlled disruptive events so that you can observe how your application responds. You can then use the results to improve the performance and resiliency of your applications.
Cassandra is a commonly used, high performance NoSQL database. AWS offers a variety of ways to run Cassandra workloads on AWS, from Amazon Keyspaces (for Apache Cassandra), a scalable, serverless, highly available, and fully managed Apache Cassandra-compatible database service, to running self-managed Cassandra on Amazon Elastic Compute Cloud (Amazon EC2).
In this post, we review how you can use AWS FIS to craft a chaos experiment to test the resilience of your self-managed Cassandra clusters running on Amazon EC2. This can help you understand your application’s ability to reestablish a connection to a healthy node.
Solution overview
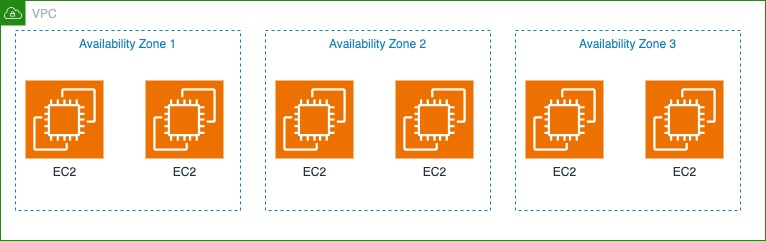
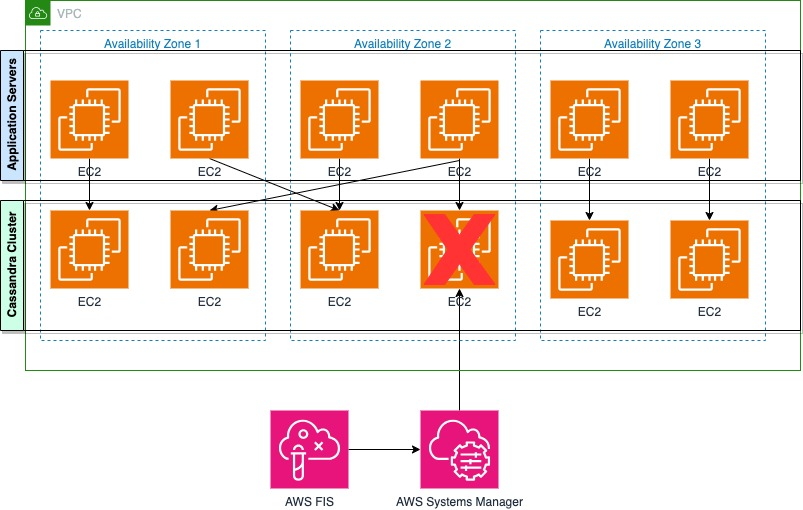
Imagine that you’re part of a team working to verify the resilience posture of your application. Previously, a memory issue uncovered a misconfiguration in the implementation of retries and backoffs within your application’s code. You’re tasked with validating that the latest development efforts have sufficiently improved the component’s resilience. As shown in the following figure, the team has a six-node Cassandra cluster spread across three Availability Zones within an AWS Region. It has a replication factor (RF) of 3, meaning that the data sent to the cluster will be stored across three different nodes in the environment. Because of how Cassandra functions, each node within the cluster is capable of reading and writing requests. The interruption of a single node within the cluster shouldn’t impact the application. At least two nodes within the cluster will still contain the data.
You can run an experiment to interrupt one of the nodes within your Cassandra cluster. The experiment assumes that the application developers have correctly coded Cassandra connection pools, backoffs, and retries. If the code is correct and a server that the application is connected to is impaired, the application will retry and be able to connect to another node in the Cassandra cluster to process requests. Let’s explore the following experiment hypothesis: In a six-node Cassandra cluster with an RF of 3, the interruption of one node will have no impact to service availability. A successful response requires a quorum of replicas (two out of three) to respond for a successful write. The cluster will maintain data consistency across the remaining five nodes, and the p99 latency will remain under 100 milliseconds. When a node is interrupted, any client request to the failed node might still succeed against two of the remaining healthy nodes within the cluster.With the RF of 3, data will remain fully accessible because two complete copies of the data will still be available on the surviving nodes.The Cassandra service might still be reporting the node as healthy, but the request from the node might begin to slow or stop responding. The experiment will target the resources based on tags. In the following sections, we discuss how to configure and run this experiment. We also discuss the benefits of connection pooling.
Prerequisites
Before running the experiment, make sure you have the necessary AWS Identity and Access Management (IAM) permissions set up, your monitoring is in place, and you have a rollback strategy.
Configure the experiment
For the experiment, you need a means to target the cluster resources, which we will accomplish using AWS resource tags. For this example, the EC2 instances within the cluster have been tagged with the cluster name and the tag chaos-ready with the value true, allowing for granular permissions assignment to the experiment.
To manually configure AWS FIS for this test case, complete the following steps:
- On the AWS FIS console, choose Create experiment template.
- Specify a description, name, and which AWS account will host the resources, then choose Next.
- For Target method, select Resource tags, filters and parameters, then add the cluster tags you applied earlier. For the selection mode, you will use the count method, and set the number of resources as one.
The preceding code uses the following parameters:
- resourceType – Specifies we’re targeting EC2 instances
- resourceTags – Uses two tags to identify eligible instances
- selectionMode – Makes sure only one matching instance is selected
- In the
Actionportion of the document, set the action type ofaws:ssm:send-command. - You will then be prompted for the additional parameters: Document ARN, Document parameters, Document version, and Duration.You can see the AWS Systems Manager document Amazon Resource Name (ARN) and parameters to pass to the document. This will use the Systems Manager document AWSFIS-Run-Memory-Stress, which generates memory stress on an instance using the
stress-ngtool, simulating a memory leak.The experiment will stress the memory on one of the EC2 instances in the clusters. AWS FIS will determine the correct targets and trigger Systems Manager using a
runcommand to run the Systems Manager document on the EC2 instance.The preceding code has the following key parameters:
- actionId – Uses Systems Manager to execute commands
- documentParameters – Sets memory stress to 100% for 900 seconds (15 minutes)
- duration – Makes sure the experiment automatically stops after 15 minutes
- Define your target by specifying the EC2 instance tags (
Chaos-Ready: True,Cluster-Name: Cassandra-Cluster1) and set the selection mode toCOUNT(1). - Next, add an action using the
aws:ssm:send-commandaction ID, and specify theAWSFIS-Run-Memory-StressSystems Manager document ARN. - Set the document parameters to stress 100% of memory for 900 seconds.
- Configure the experiment to run for 15 minutes.
After everything is prepared, you can start the experiment on the AWS FIS console or using the AWS Command Line Interface (AWS CLI). Remember to closely monitor your application and Cassandra cluster performance throughout the test duration.
Run the experiment
You can execute experiments using the console or AWS CLI and APIs. After the experiment is started, the service will filter based on the specified tags, find the hosts to target, and begin the impairment. After the node is impaired, reads and writes to the application servers will begin to degrade or fail, as shown in the following figure.
Monitoring is a critical part of chaos experimentation; you must be able to observe the effects of the impairments being caused. In addition, the system should be under a steady state of load. The following metrics serve as examples of what you might include in your monitoring dashboards before running the experiment. Feel free to adjust these based on your specific use case and system requirements. Monitor these key areas:
- Application performance – Track request latency (p99, p95, p50), error rates, and request throughput. Pay special attention to client-side connection retry patterns to understand how your application handles node failures.
- Cassandra cluster health – Focus on node status, read/write latencies, and consistency levels. Monitor the replication factor status to make sure data remains properly distributed across surviving nodes.
- Infrastructure status – Track essential resource metrics, including CPU, memory usage, and network connectivity. These baseline metrics help identify whether performance issues stem from resource constraints or cluster problems.
Consider using Amazon CloudWatch to implement this monitoring strategy. With CloudWatch, you can create comprehensive dashboards combining Amazon EC2 and application metrics. You can set up alarms for critical thresholds, analyze logs in real time using CloudWatch Logs Insights, and compare metrics across nodes with Metrics Explorer. Additionally, you can integrate CloudWatch with AWS FIS to automatically stop experiments if predefined alarm conditions are met, adding an extra layer of safety to your chaos experiments.
During execution, watch for these warning signs: latency spikes exceeding your SLO thresholds, increased operation failures or timeout errors, unusual patterns in connection retries or throughput, and changes in node health status. Consider setting up automated alerts for these metrics to receive quick responses to issues during the experiment.
Cassandra connection pooling
In Cassandra, connection pooling enables applications to maintain multiple connections across different nodes within the cluster. When a node becomes unresponsive, applications can quickly switch to alternate connections, reducing failover time and maintaining system performance. This immediate failover capability is crucial for maintaining consistent application performance and reliability.To implement effective connection pooling, configure your pool size based on concurrent request requirements and implement load balancing policies. Regular monitoring of pool utilization, combined with proper connection lifecycle management and exponential backoff strategies, provides optimal resilience. These practices help your application maintain reliable performance even when individual nodes experience issues.Using connection pooling, after the application servers connected to an impaired node begin to encounter a failure, they can switch to a different connection to the cluster, as shown in the following figure.

After the impaired node recovers, it comes back online with the data it had before failure. To maintain consistency, a repair process needs to be run to synchronize any data changes that occurred during the downtime. The duration of the repair process varies significantly depending on the amount of data and the length of the node’s downtime. After the node is back online, it becomes available in the connection pool, though applications might implement their own strategies for gradually returning traffic to the recovered node. This process helps maintain data consistency while allowing the system to return to normal operations.
After the impaired node recovers, it comes back online with the data it had before failure. Cassandra provides multiple mechanisms to handle data synchronization based on the duration of the outage. For outages under 3 hours (the default hinted handoff window), the built-in hinted handoff system automatically manages consistency by replaying missed writes. For outages exceeding this window, the node might need to be bootstrapped, or a manual repair process needs to be run to fully synchronize the data. The duration of this repair process varies significantly depending on the amount of data and the length of the node’s downtime. After the node is back online, it becomes available in the connection pool, though applications might implement their own strategies for gradually returning traffic to the recovered node. This process helps maintain data consistency while allowing the system to return to normal operations.
Conclusion
Testing the resilience of distributed systems such as Cassandra is crucial for maintaining reliable operations in production environments. Through experiments using AWS FIS, you can systematically validate system behavior during partial node failures, specifically focusing on memory-related failures. The experiment not only helps validate your application’s retry mechanisms, but also provides valuable insights into how your Cassandra cluster behaves under stress conditions.Chaos engineering is not a one-time exercise, but an ongoing practice that helps teams build and maintain more reliable distributed systems. Through tools such as AWS FIS, organizations can confidently validate their system’s resilience and continuously improve their architecture to better serve their customers.
For other experiments, see the AWS FIS sample repository. For information about best practices, refer to Best Practices for Running Apache Cassandra on Amazon EC2. To learn more about backoff and retries, see Retry with backoff pattern.