AWS Database Blog
Scale read operations with Amazon Timestream for InfluxDB read replicas
Time-series data workloads often require high read throughput to support real-time alarms and notifications, monitoring dashboards, and analytics visualization tools. In this post, we show how to use Amazon Timestream for InfluxDB read replicas to scale your read operations by adding additional read replicas while maintaining a single write endpoint. Built in partnership with InfluxData, our read replica add-on offers InfluxDB open source customers the ability to horizontally scale their read capacity.
Challenges with managing time-series data
Modern infrastructure monitoring generates massive amounts of time-series data that often serves two distinct purposes. Organizations managing this data face a common challenge: addressing both immediate operational needs and longer-term analytical requirements with the same dataset. This dual-purpose data management includes:
- Real-time operational needs – For quick detection of anomalies, instant dashboard updates, and immediate alerting
- Deep analytical requirements – For resource optimization, capacity planning, and root cause analysis
This combination demands solutions that can efficiently handle both time-sensitive operations and complex historical analysis without compromise. The following diagram illustrates our single-instance implementation.
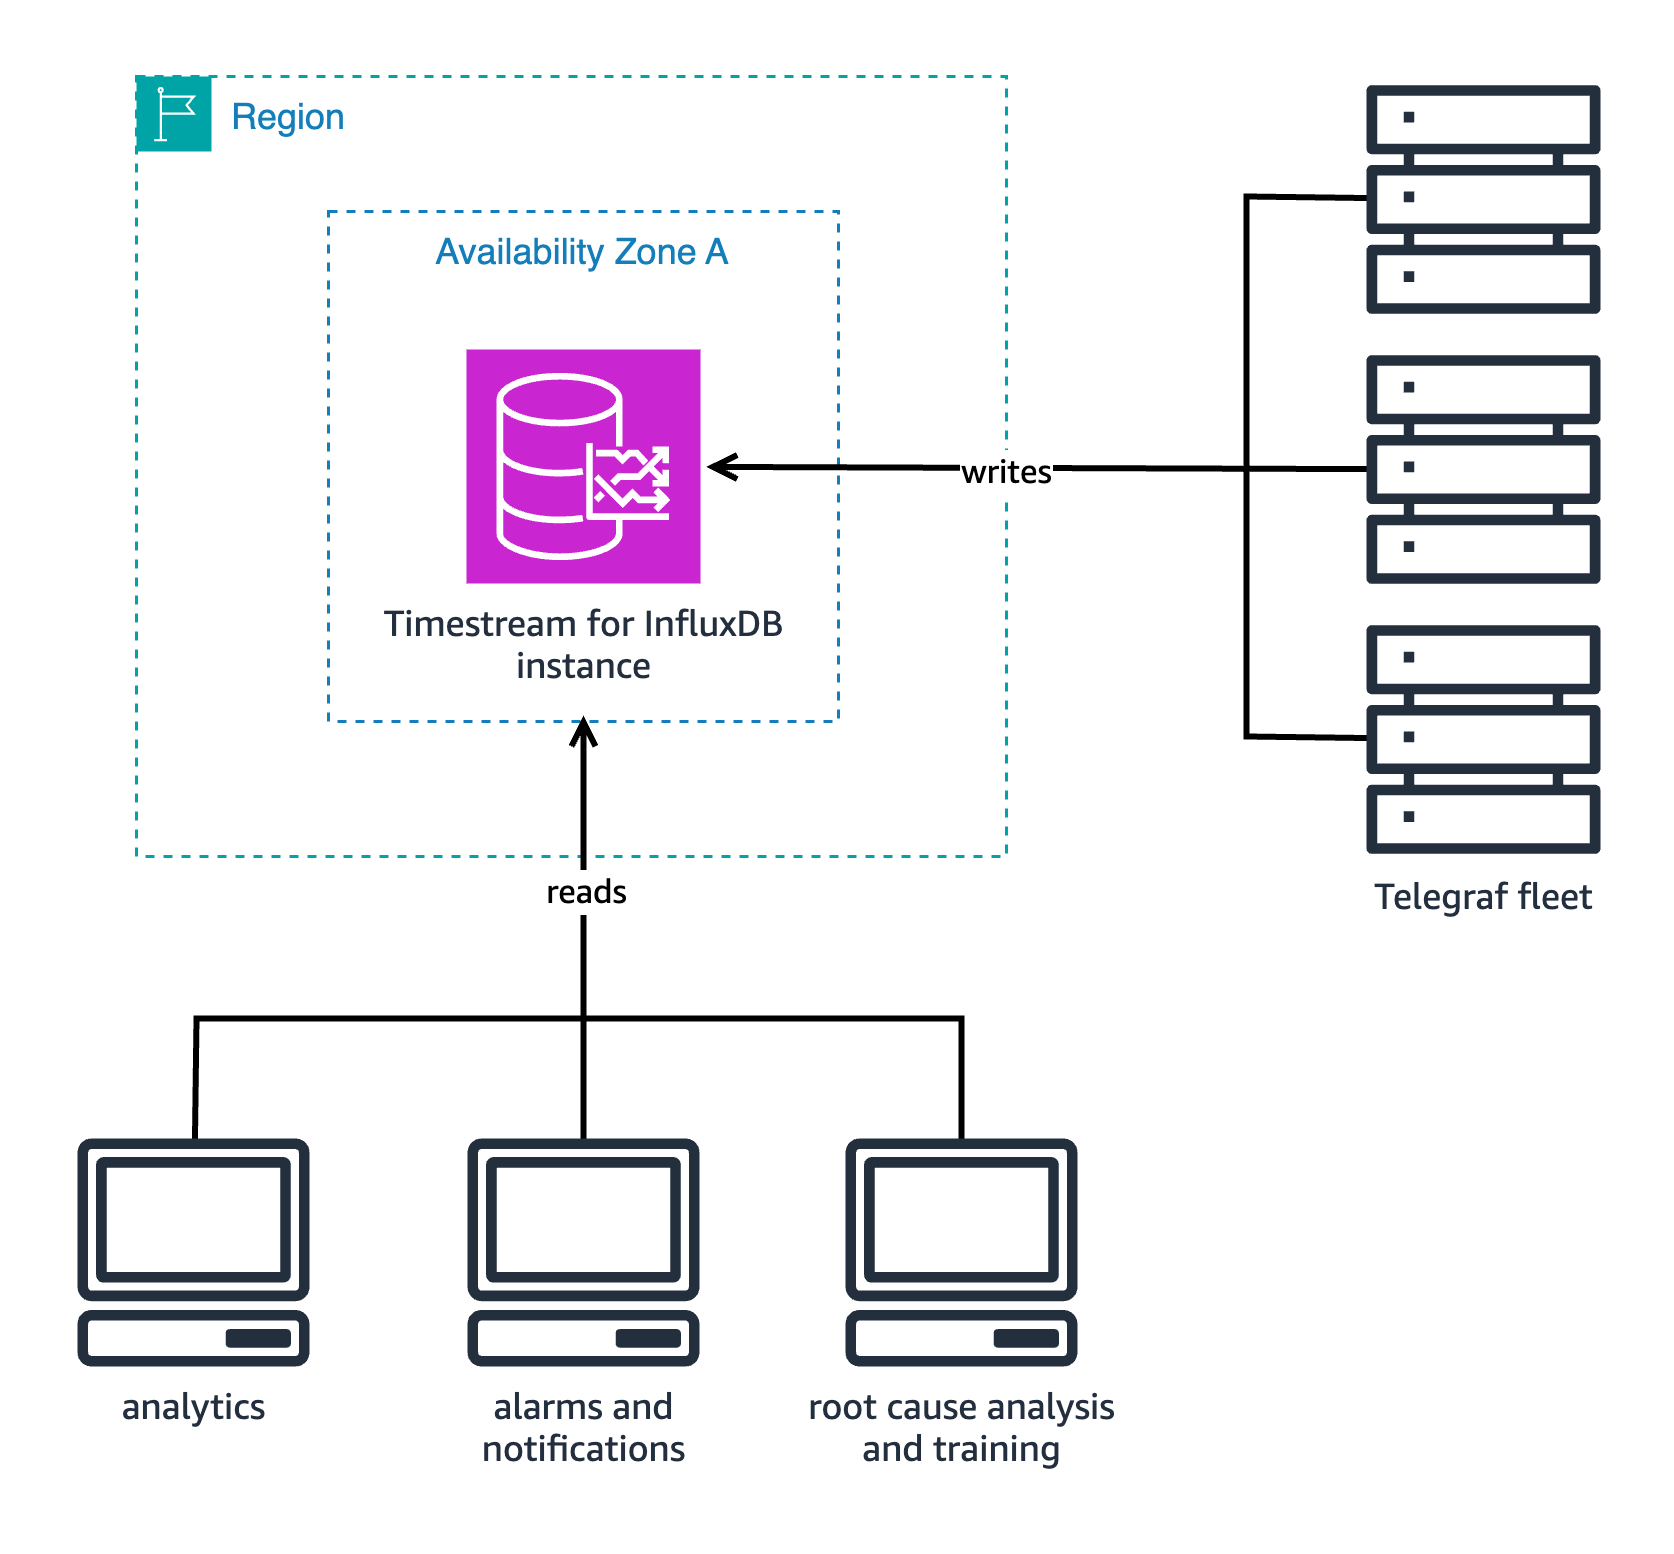
A single Timestream for InfluxDB instance handles real-time operational needs and deep analytical requirements at the same time. The instance has competing demands and needs to deal with different types of requests without having a way to prioritize them according to urgency.
Solution overview
Let’s explore how Timestream for InfluxDB read replicas can help you effectively manage different workload patterns while maintaining system performance. For our example workload, we focus on solving this problem by adopting a Timestream for InfluxDB read replica cluster. We start by dividing our query workload in two groups based on the different needs:
- Operational monitoring – This consists of the following:
- High-frequency, lightweight queries, usually using operations like
last(),max(), and similar functions, with short time ranges - Dashboards that refresh every 10–30 seconds showing fleet-wise health averages over time
- Alerts evaluation that run every few minutes, only looking for values that breach predefined thresholds
- Basic aggregations and comparisons
- Required latency of less than 500 milliseconds
- High-frequency, lightweight queries, usually using operations like
An example of an operational monitoring Flux query, querying an Internet of Things (IoT) dataset, is the following:
This queries the maximum speed of all trucks within the East fleet in the last minute.
- Analytical processing – This consists of the following:
- Complex correlation analysis
- Machine learning (ML) model training
- Seasonal pattern detection
- Capacity planning calculations
- Root cause analysis queries
- Acceptable latency is from seconds to minutes
An example of an analytical processing Flux query is the following:
The query analyzes the rate of change in truck load and fuel consumption over a 1-hour period. Due to the larger time range, use of movingAverage, and small aggregate window duration, this query takes longer to run and is considered CPU intensive.
Our solution implements a workload-optimized architecture, as shown in the following diagram.
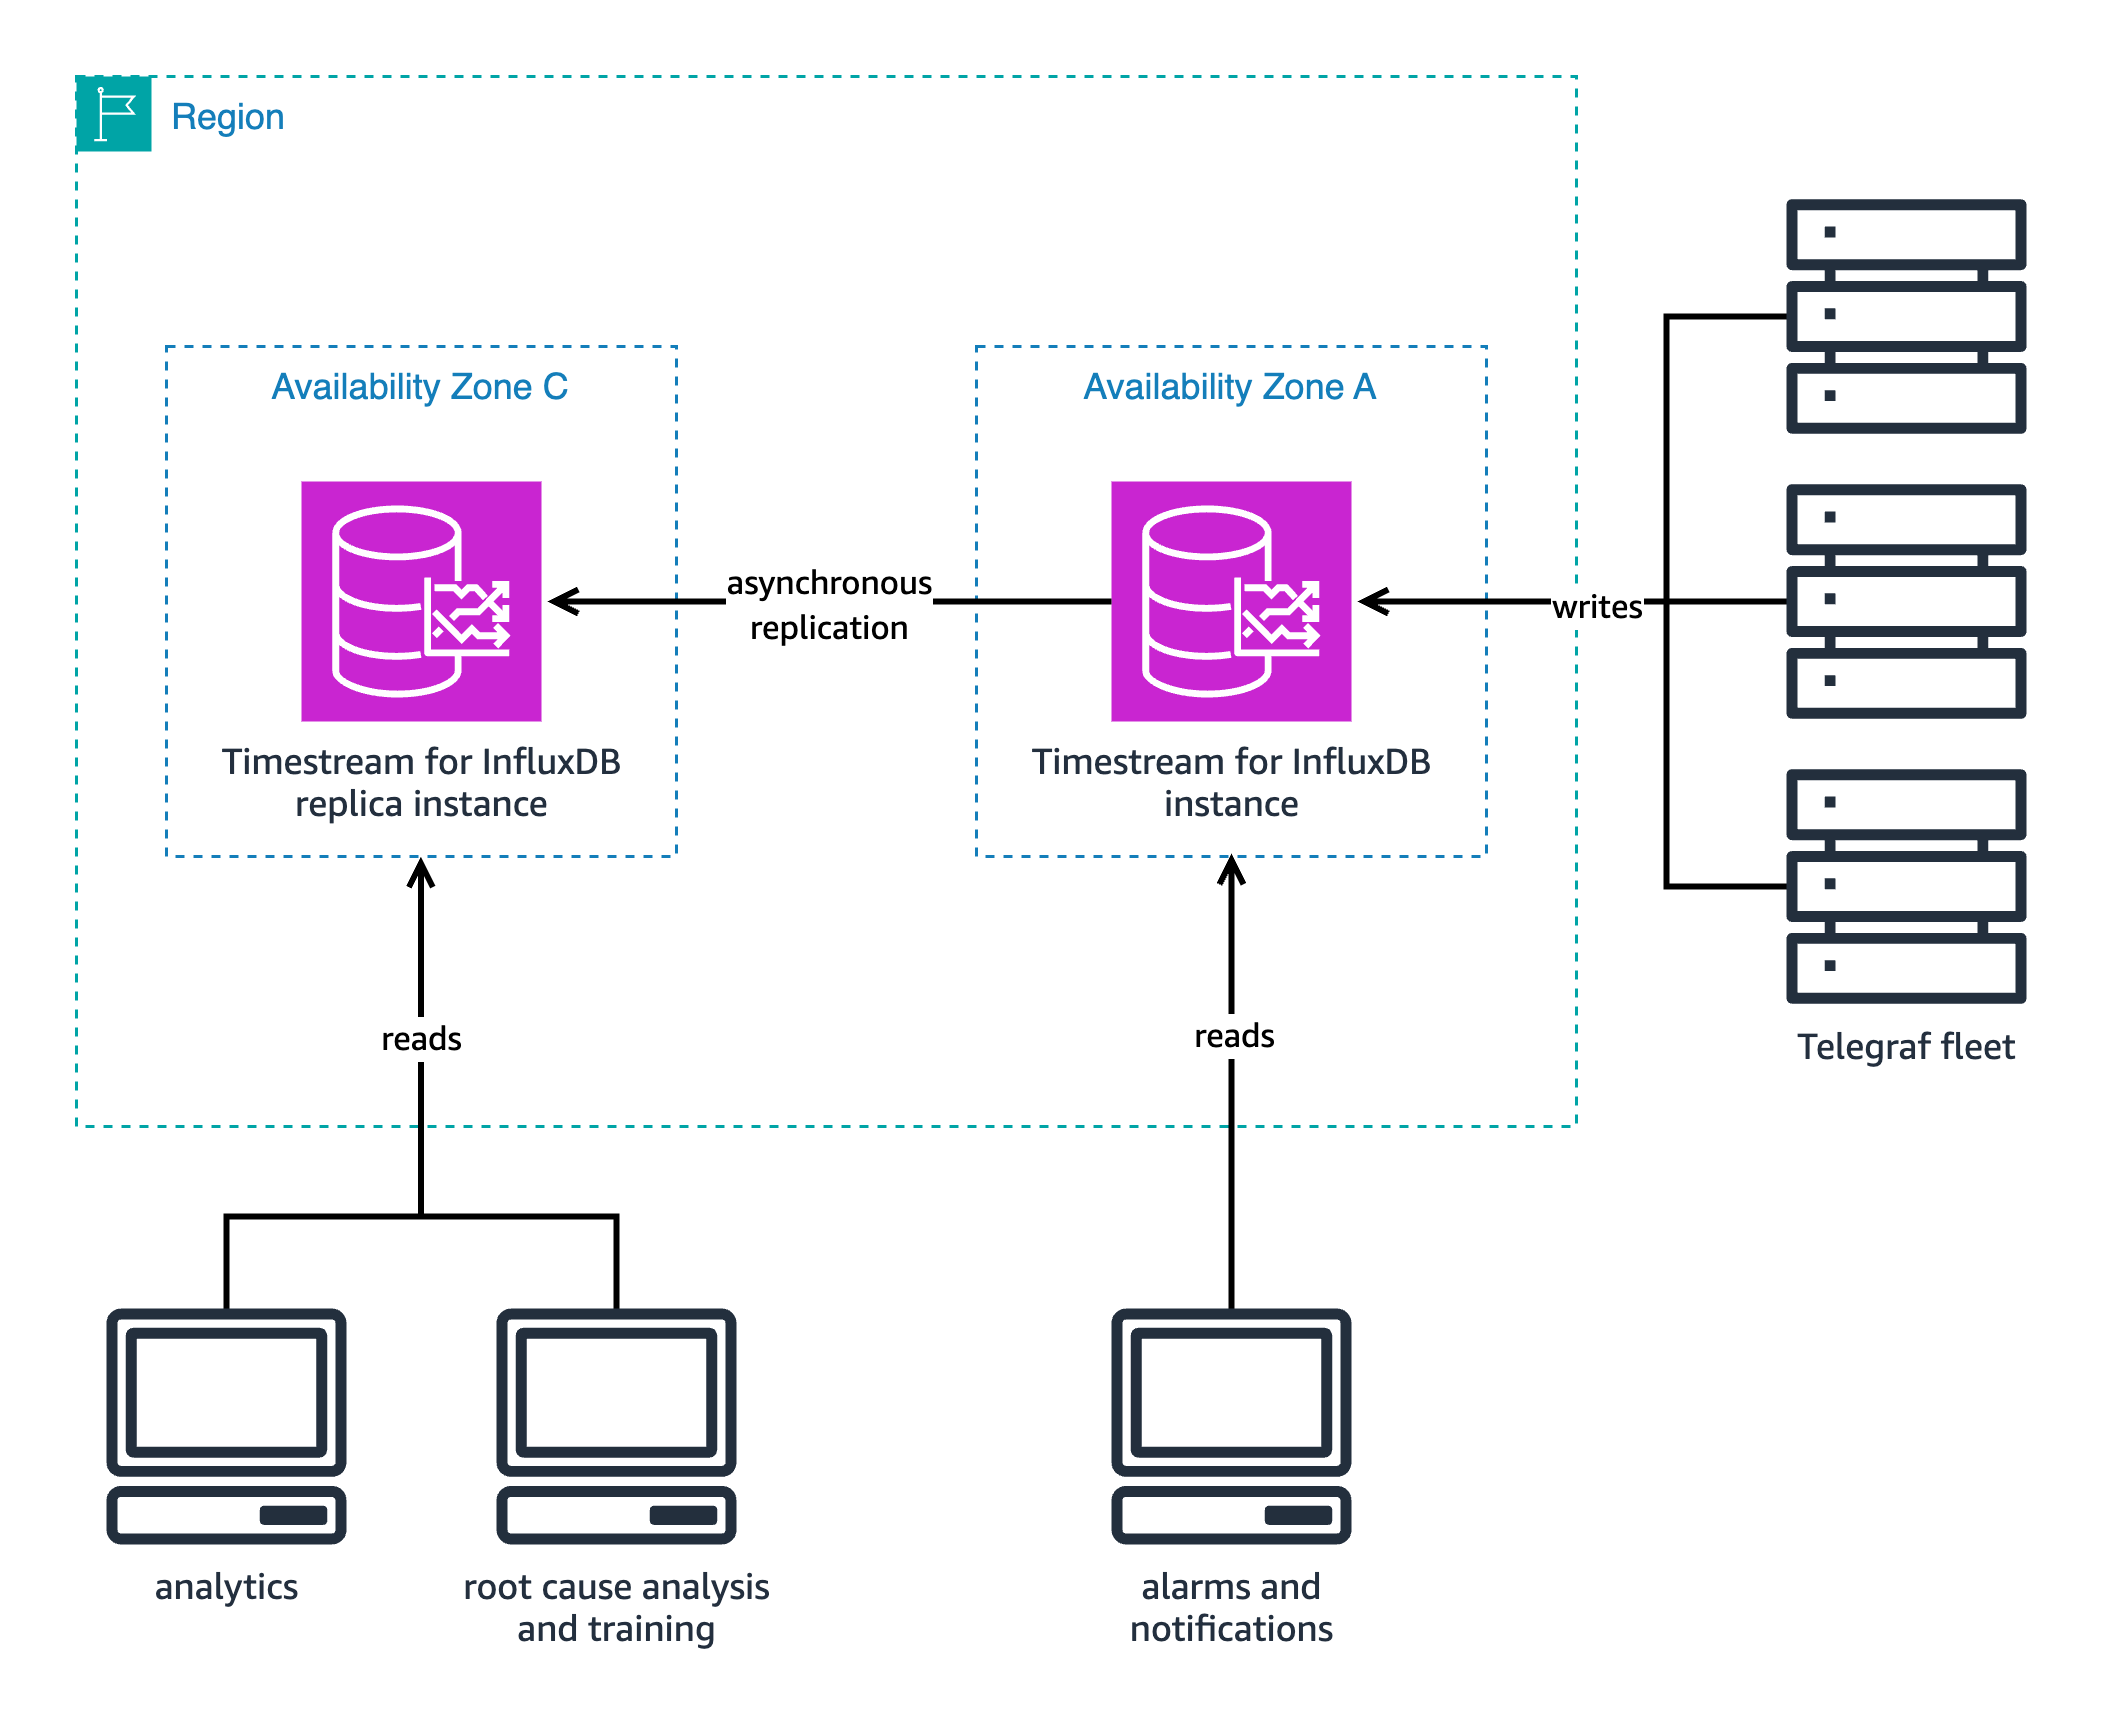
The read replica configuration is as follows:
- Primary node (operational):
- Handles metric ingestion
- Kept for quick, simple queries
- Dedicated to real-time dashboards and alerting
- Used for tasks that require minimal latency
- Data sources include Telegraf and custom agents
- Typical ingest rate of 100,000 metrics per second
- Replica node (analytical):
- Used for complex queries
- Handles ML training workloads
- Dedicated for queries with higher memory allocation
Read replica nodes use the same hardware specifications as Timestream for InfluxDB instances. For more information, see Hardware specifications for DB instance classes.
The solution in this post will use the following AWS resources:
- A Timestream for InfluxDB read replica cluster
- An Amazon Elastic Compute Cloud (Amazon EC2) instance
You will incur charges for the AWS resources used in the solution. See Amazon Timestream pricing and Amazon EC2 pricing for more information.
Understanding read replicas
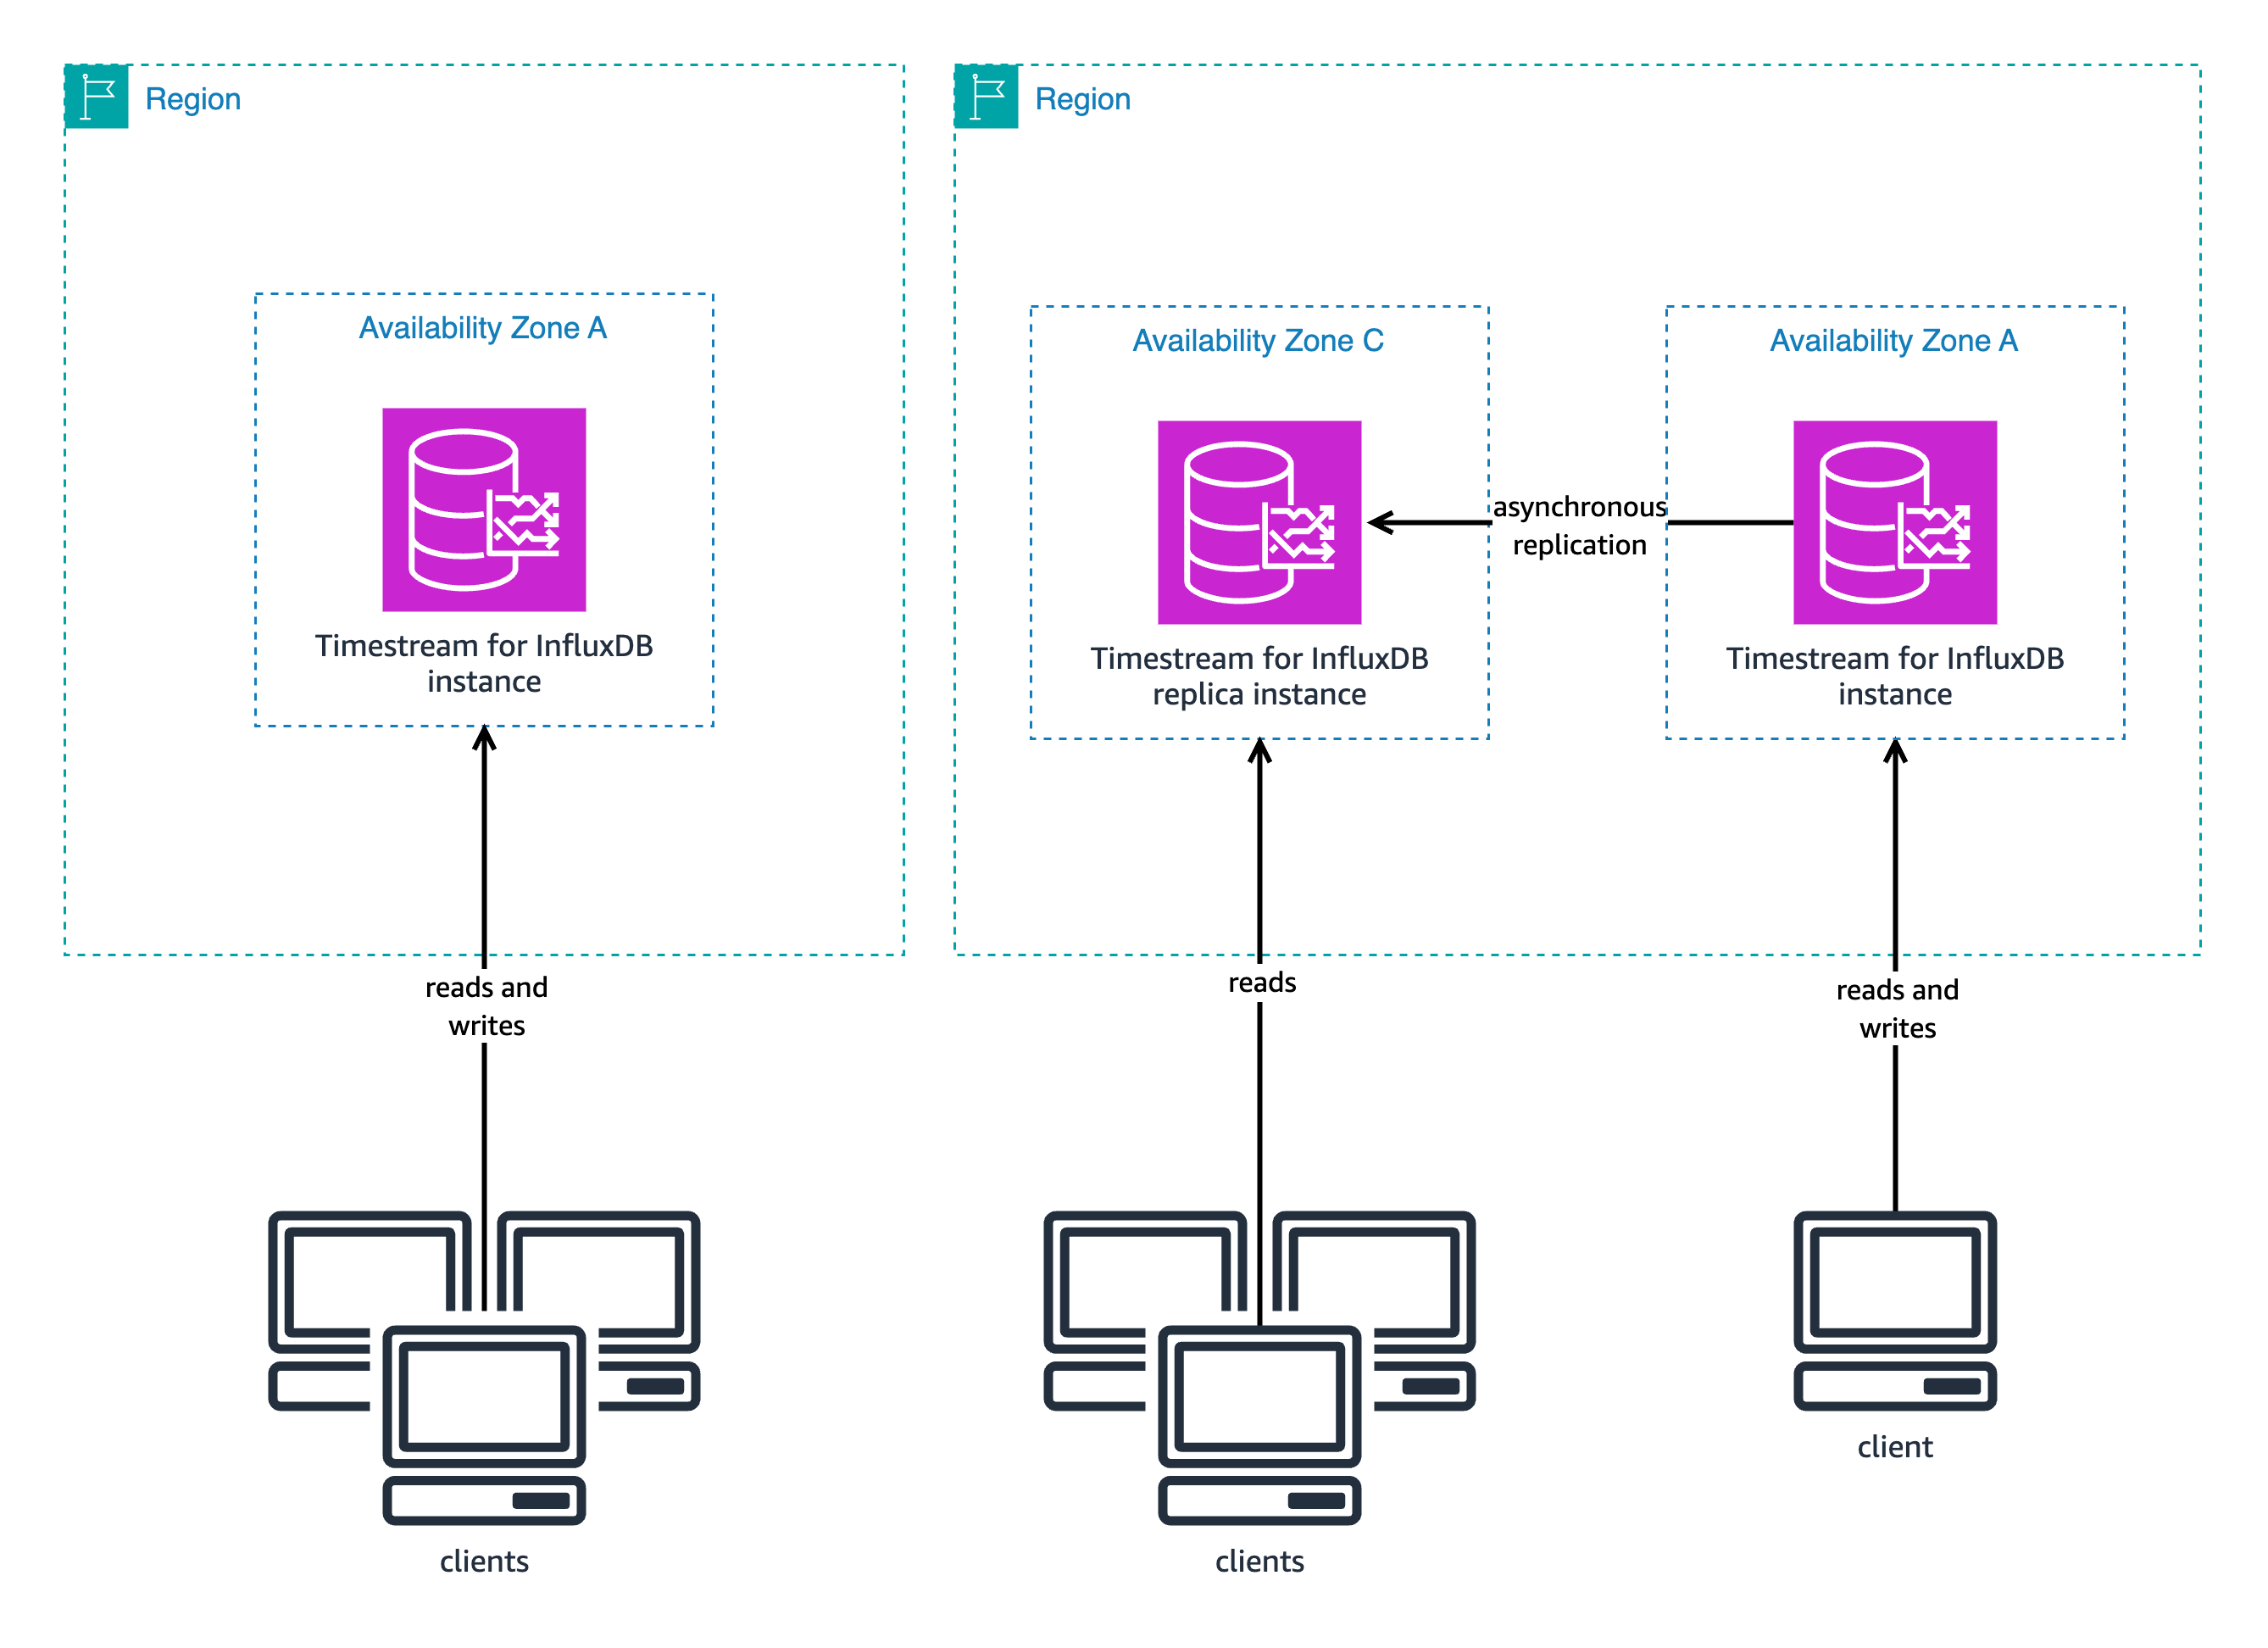
Read replicas are read-only copies of your primary database that help distribute read operations across multiple database instances. The following diagram shows the architecture of a single Timestream for InfluxDB instance (left) compared to the architecture of a Timestream for InfluxDB read-replica cluster (right).
Some time-series workloads require many more read operations than write operations. Read replicas offer an ideal solution for this imbalance. Each read replica maintains a copy of your data that updates automatically. Your application can distribute read requests across multiple replicas instead of overloading a single instance.
The replication process works behind the scenes through asynchronous replication. When your application writes data, the primary instance first saves and confirms the data locally. Only after this confirmation does the primary instance begin copying the data to your read replicas. The primary instance doesn’t wait for replicas to acknowledge receipt before responding to your application, allowing for faster write operations. After data is committed by the writer DB instance, it is replicated to the read replica instance almost instantaneously. For more information about replica lag, refer to Replica lag in read replica clusters.
With this launch, we are also introducing the concept of DB clusters. A DB cluster consists of one of more DB instances that are managed as a single entity. At launch, Timestream for InfluxDB only supports two-node clusters that are comprised of the primary (write and read node) and a secondary read replica (read-only node).
Changes that you want to introduce into your cluster configuration can affect all instances that are part of the cluster. Additionally, the only instance that can modify configurations or data is the primary instance. This means that you must use your primary for the following actions:
- Write data
- Create buckets, orgs, users, and access tokens
- Configure dashboards, task, alarms, and notifications
- Perform other actions that might change data
The focus of the read replicas is to extend your read capacity, so you can maintain write performance while expanding your read requirements.
Use cases in which a read replica cluster can better serve your needs
Timestream for InfluxDB read replicas are recommended for the following scenarios:
- Increasing read requirements – Your read requirements are growing faster than your write throughput and have started to impact the speed at which you can ingest data. By adding a secondary read replica, you can offload your queries to the replica so that the write performance of your primary remains unaffected.
- Dashboarding and analytics queries are impacting performance – You have a set of dashboarding or analytics queries that have started to impact query performance on the most critical alarm and notification queries. You can implement read replicas to fix this by keeping only your most critical alarm- and notification-related read workloads on the primary and offloading the dashboarding and analytical queries to your secondary.
- A large database serving many customers – Your database serves a large number of customers that send impromptu reads to your system. Imagine you’re a company tracking the performance of home-based solar cells and your customers can access dashboards from their apps to see their panel performance, payback costs, and usage-related savings. In this case, you can use read replicas to balance the query load, separating customers by region, product, or support tier.
- Minimal downtime requirement – Your business requires the shortest possible downtime when issues affect your primary instance. The automated failover capability quickly detects problems with your primary instance and promotes a read replica to become the new primary without your intervention. This fast, automatic process minimizes disruption to your applications and helps maintain service availability even during unexpected events. When monitoring critical infrastructure, high availability is an important characteristic of a time-series data store. Although we offer Multi-AZ instances that are synchronously replicated upon failure of your primary instance, your secondary InfluxDB needs to start up, because up to this point it will have been in standby mode. Although this approach offers the highest durability for your data, the time required for your instance to be up again will depend on many workload- and engine-related aspects, such as cardinality, the size of the database, and the rate of ingestion before the crash. These factors might let you extend downtime while your engine restarts. With Timestream for InfluxDB read replicas, although the asynchronous replica doesn’t offer the same level of durability as its Multi-AZ counterpart, it can provide faster failover regardless of the workload characteristics.
In summary, Timestream for InfluxDB read replicas can help you achieve your specific query or availability goals by offloading queries to the replica node to maintain performance of the primary node, balancing query load between the nodes according to workload characteristics, and providing faster failover regardless of workload compared to Multi-AZ instances.
How Timestream for InfluxDB read replicas work
Timestream for InfluxDB read replicas work in the following way:
- When you need to write data to your Timestream for InfluxDB database, you can only write to your primary node in your cluster. After you get the OK response from the API, it means that your write was accepted and persisted to disk, and is ready to be read.
- When records are persisted to the Write Ahead Log (WAL), the engine uses an optimized data-transfer method called WAL shipping to send these new entries to the replica.
- You can track the
ReplicaLagmetric in Amazon CloudWatch and create alarms to make sure it’s kept under control.
Read replica cluster performance
In this section, we discuss the performance you can expect from your read replica cluster in a few real-world scenarios.
Queries per second with simultaneous reads and writes
Read replica clusters can help you increase the query performance on your Timestream for InfluxDB workloads. Compared to single instances, clusters help you distribute your query load across your nodes, resulting in faster response times and improved throughput. This performance boost is particularly noticeable for high-concurrency scenarios and large-scale data analysis tasks. We compared the performance of a single db.influx.xlarge instance against a db.influx.xlarge read-replica cluster under the same workload. Five proxy servers aggregated IoT data of 100,000 trucks, writing data every 5 seconds in batches of 5,000-line protocol points. At the same time, 25 clients queried and retrieved 15-minute aggregates for different metrics over a 15-minute interval. For the single instance, all users wrote and queried from the same instance. For the read-replica cluster, all write requests were sent to the primary node, and read requests were divided between the primary and replica nodes.
The single instance averaged 59.46 queries per second, with all 25 clients sending query requests. The following diagram shows the number of requests sent to the single instance over time, as generated by the Goose testing framework.
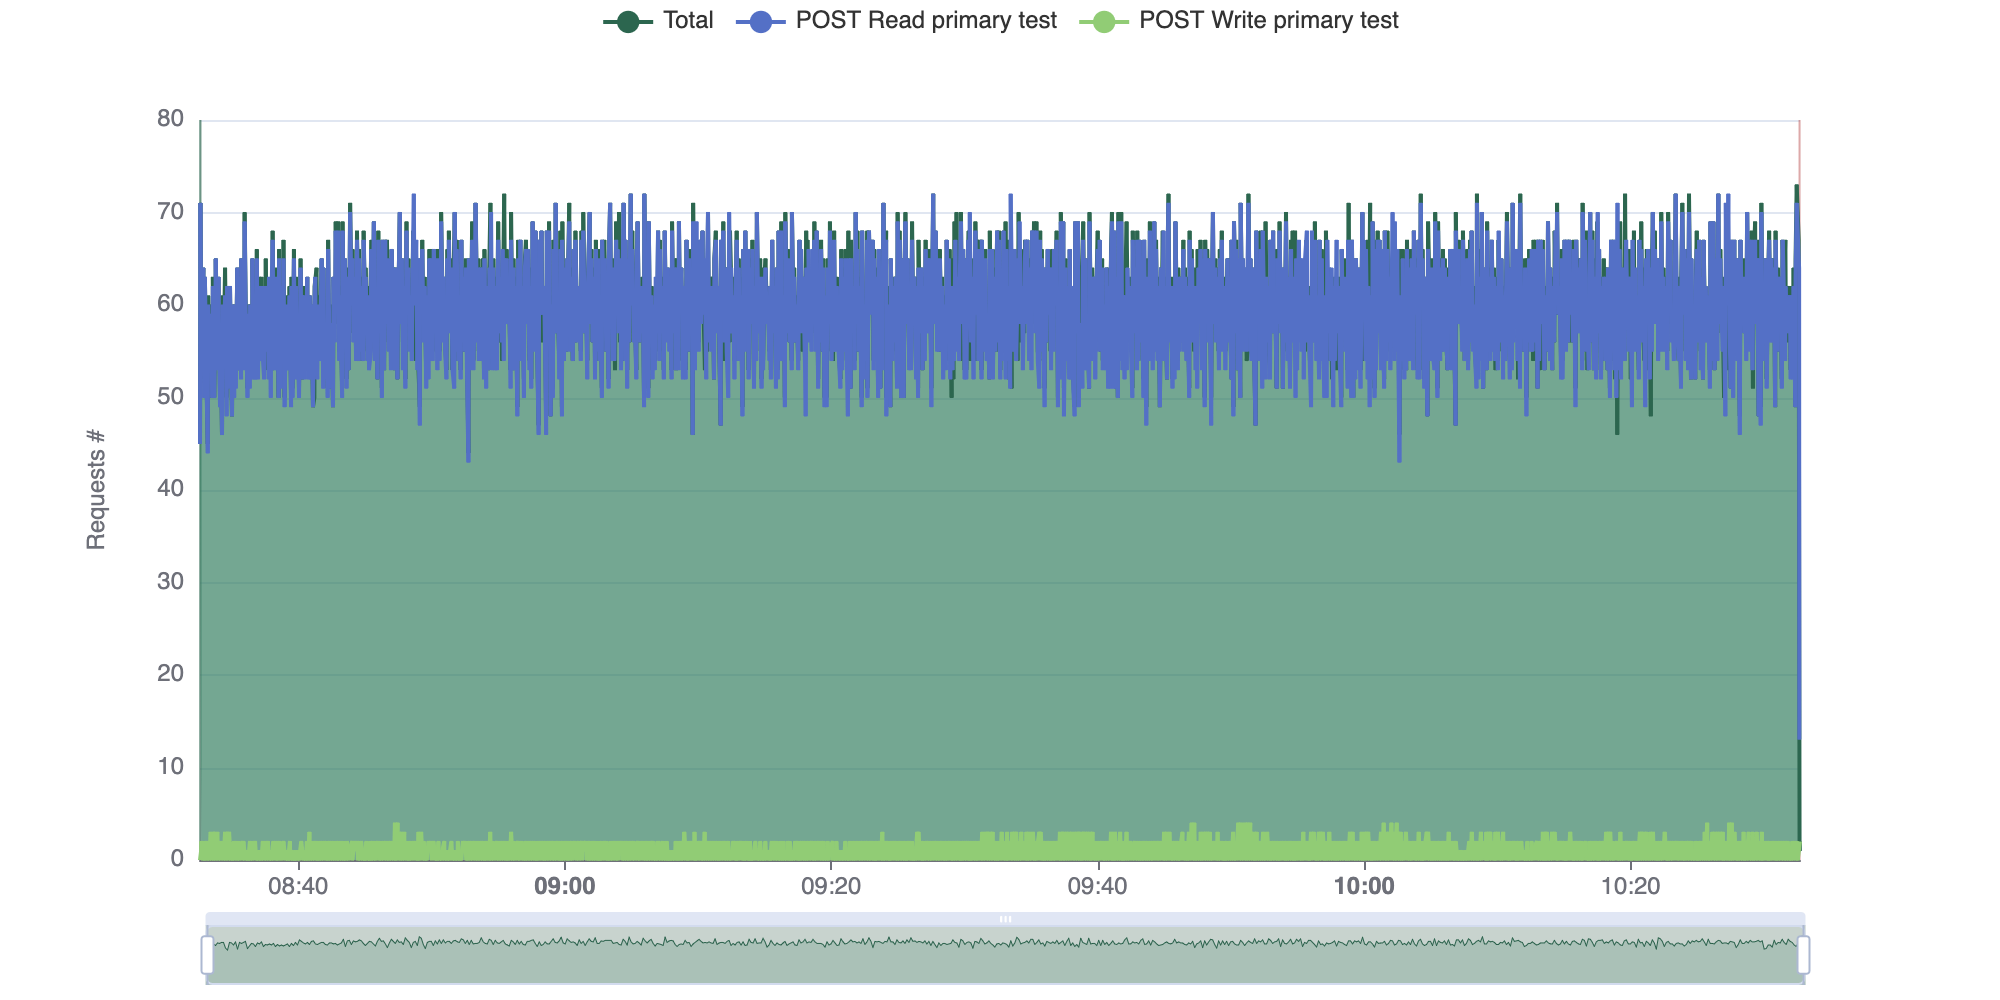
The read replica cluster averaged 105.52 queries per second, with 25 querying clients split between the primary and read-replica nodes. The following diagram shows the number of requests sent to the read replica cluster over time.
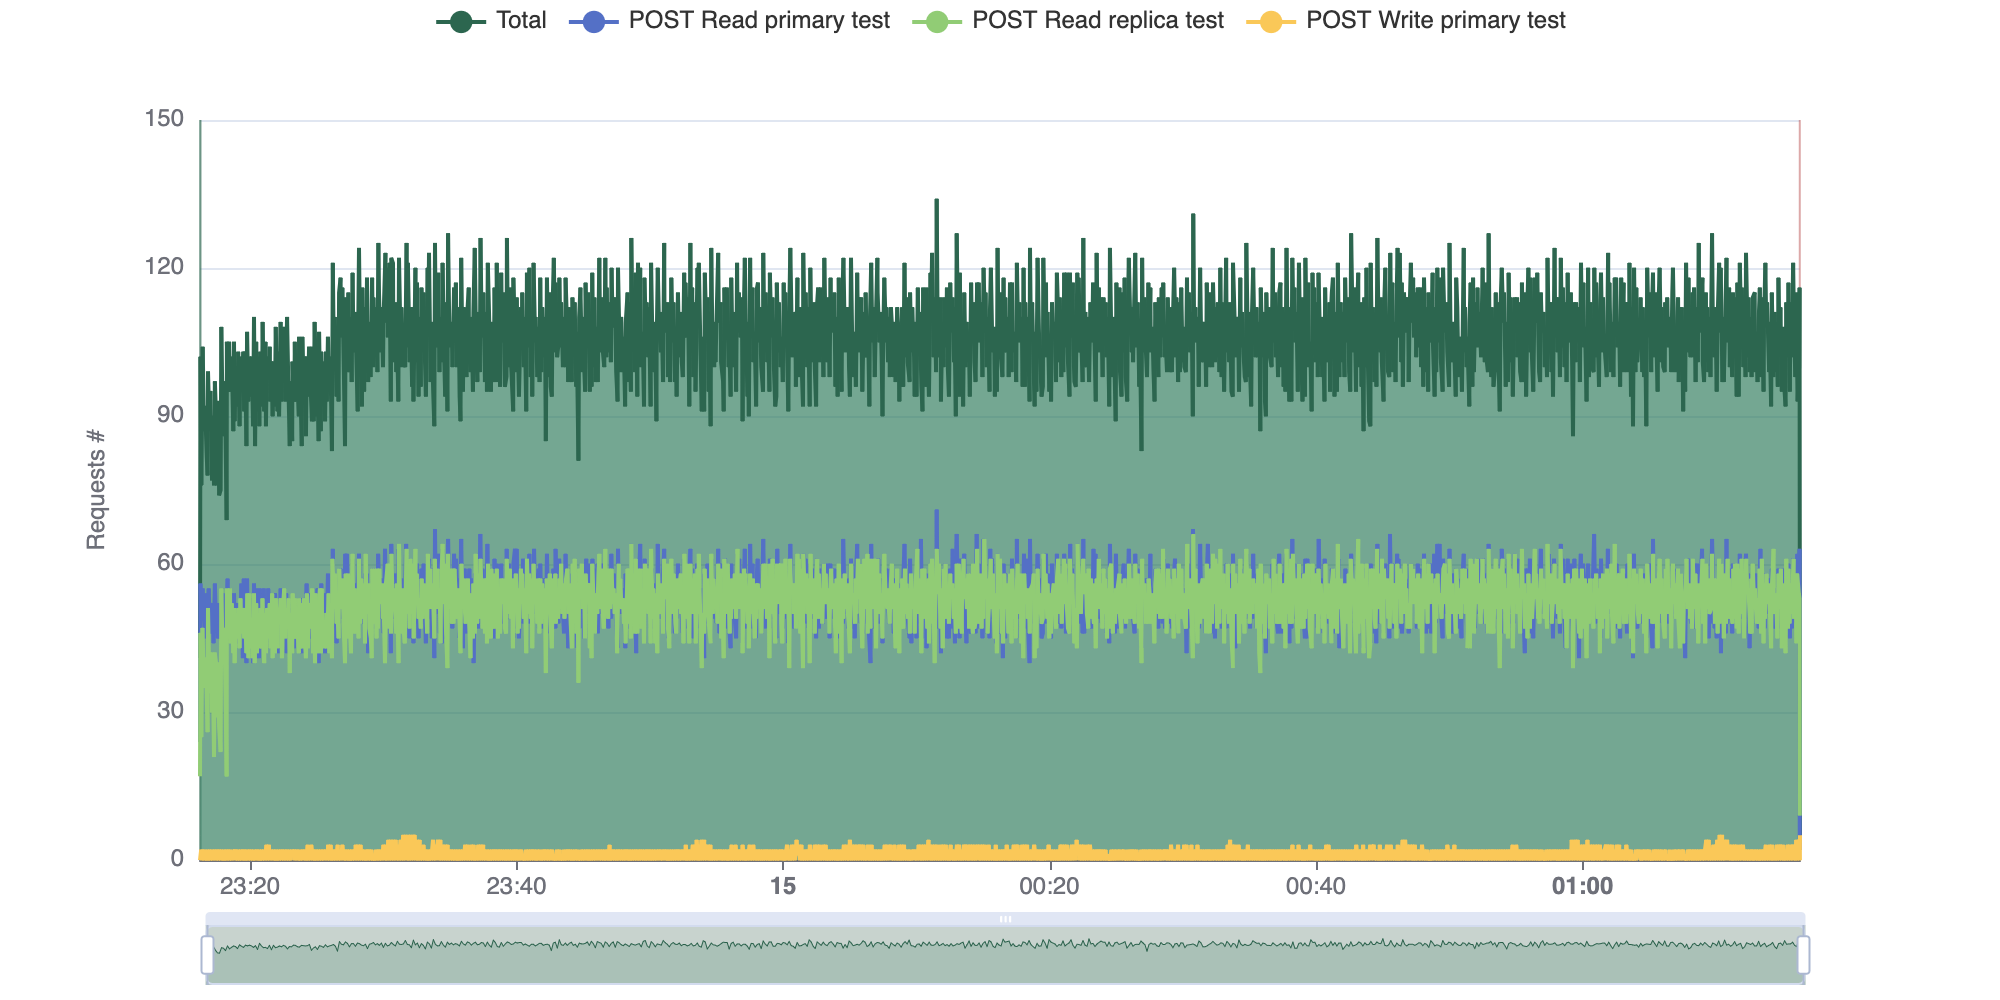
Compared to single-instance performance, this represents a 77.5% increase in read capacity.
Query CPU usage
Using the same dataset as the previous example, the following query analyzes the rate of change in truck load and fuel consumption over a 1-hour period:
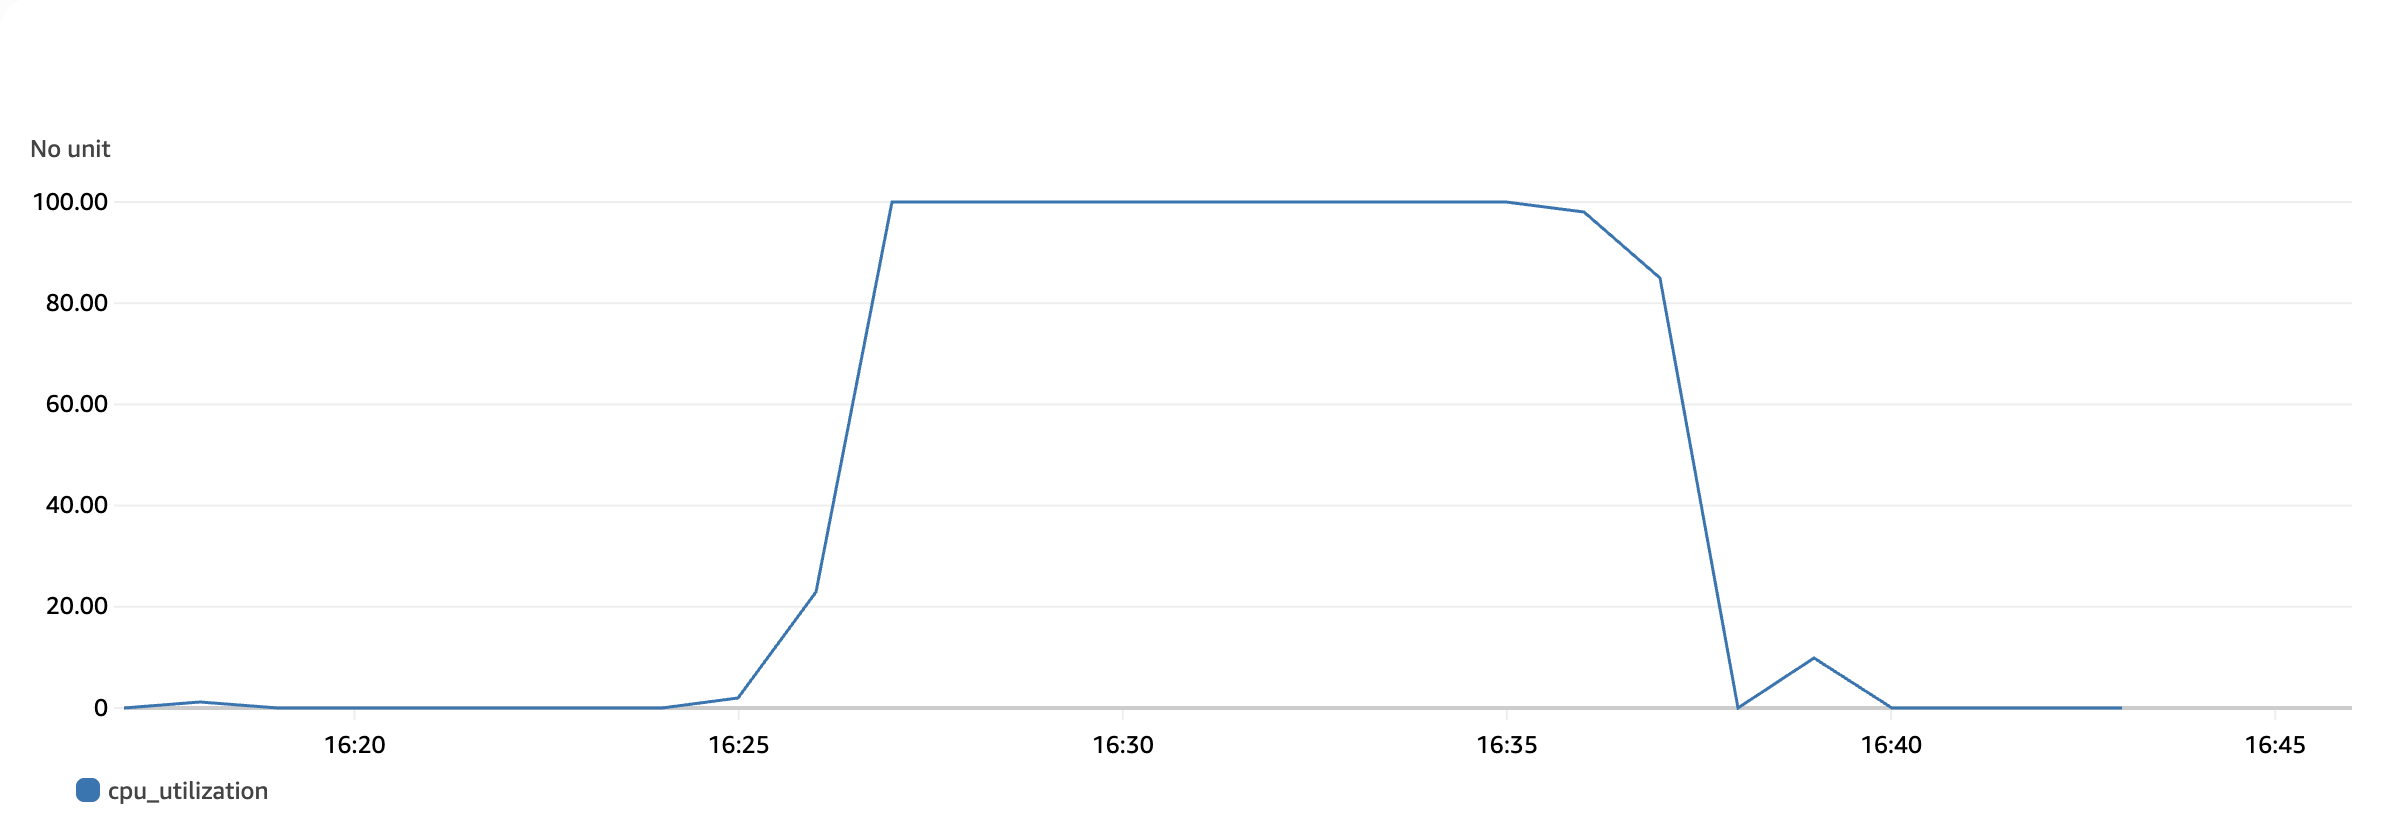
We compared the CPU usage of a single db.influx.xlarge instance against a db.influx.xlarge read-replica cluster under the same workload. Over 10 minutes, four clients sent the preceding CPU-intensive query as many times as possible. The single instance reached 100% CPU usage. The following screenshot shows the instance’s CPU utilization over a 30-minute period, as shown on the Timestream console. Note that the periods of 0% CPU usage are periods before and after testing.
The read-replica cluster, with the workload distributed evenly across instances, reached 46.33% CPU usage on its primary node. The following screenshot shows the primary node’s CPU utilization over a 30-minute period.

The read-replica’s replica node reached 54.41% CPU usage. The following screenshot shows the replica node’s CPU utilization over a 30-minute period.

The cluster handled a greater overall workload without overloading either instance, leaving capacity to handle additional requests.
Conclusion
With the Timestream for InfluxDB read replica feature, you can optimize your cluster for high query performance workloads. Where a normal Timestream for InfluxDB instance would be subject to the workload limitations of a single instance, the read replica feature allows for supporting additional load without affecting primary node performance by utilizing the additional read node.
Get started by deploying a Timestream for InfluxDB read replica cluster for your own use case, and share your feedback in the comments.