AWS Database Blog
Enhanced throttling observability in Amazon DynamoDB
Today, we’re announcing improved observability for throttled requests in Amazon DynamoDB. These enhancements provide developers with enriched exception messages, detailed Amazon CloudWatch metrics, and a new, more cost-effective mode for CloudWatch Contributor Insights. Together, these improvements make it straightforward to understand, monitor, and optimize your DynamoDB applications’ performance. In this post, we explore how these new features work, why they matter, and how to implement them effectively in your applications.
Understanding DynamoDB throttling
Before diving into the new features, let’s establish a clear understanding of throttling in DynamoDB. At its core, throttling is a protective mechanism that helps maintain consistent performance at any scale across applications using DynamoDB. Think of it like a traffic control system—when traffic gets too heavy in certain areas, signals slow down the incoming flow to prevent congestion and help ensure smooth operation for everyone.
When DynamoDB throttles a request, it’s slowing down the flow of incoming requests, but the reason for this slowdown can vary. Understanding these reasons is important for building resilient applications, and our new observability features help clarify why a request is throttled.
There are four potential reasons for DynamoDB to throttle a request, depending on the capacity mode and access pattern. These throttling reasons are consistent across tables and indexes and apply to both read and write requests.
Provisioned throughput exceeded exception
In provisioned mode, throttling can occur when request traffic exceeds the provisioned read or write capacity for the table or index, returning a ProvisionedThroughputExceededException. DynamoDB provides burst capacity by banking unused throughput for up to 5 minutes, but this is limited. Auto scaling can help adjust capacity, though it might lag during sudden spikes. Unless your workload is very stable with only predictable changes in load, on-demand mode provides the best experience due to its more responsive scaling.
Throttling exception and request limit exceeded
In on-demand mode, DynamoDB instantly scales with traffic, but you can set optional maximum throughput limits on your tables and global secondary indexes. Exceeding these limits returns a ThrottlingException. Furthermore, every resource in on-demand mode is subject to a soft limit of 40,000 read request units and 40,000 write request units per second, which can be adjusted using AWS Service Quotas. Exceeding this limit will result in a RequestLimitExceeded exception.
Every partition in a DynamoDB table or global secondary index is designed to deliver a maximum capacity of 3,000 read request units per second and 1,000 write request units per second, irrespective of the capacity mode of the resource. If a resource experiences a sudden surge in throughput, it can exceed partition limits and result in a ThrottlingException for resources in on-demand mode and a ProvisionedThroughputExceededException for resources in provisioned mode. This is often a result of low-cardinality keys, time-based keys, or skewed access patterns. Amazon CloudWatch Contributor Insights is the most effective tool to detect hot keys and skewed access patterns, we discuss this in more detail later in this post.
GSI back-pressure
While these throttling reasons apply to both reads and writes across tables and global secondary indexes (GSIs), we want to highlight one specific form of throttling: GSI back-pressure. When an application writes to a DynamoDB table, the GSIs on that table are updated asynchronously, using an eventually consistent model. Insufficient write capacity on the index can cause every new write request to the base table to be throttled. This insufficient write capacity can be a result of low-cardinality partition keys on the index, which concentrate write activity on a small number of partitions and can exceed the index’s throughput limits. It can also occur if the index is under-provisioned for the volume of writes it receives. It is important to choose a schema with high-cardinality keys for both the base table and GSIs to avoid uneven load distribution and throttling.
New structured exceptions for throttled requests
Throttled request to a DynamoDB dataplane API returns an HTTP status code 400 with one of the three exception types mentioned previously: ProvisionedThroughputExceededException, ThrottlingException, or RequestLimitExceeded. However, the exception type and the exception message aren’t always accurate and might not map one-to-one to the throttling reasons we outlined earlier.
Starting today, every throttled request will contain a new field: ThrottlingReasons. This field will contain a list of unique reasons and the Amazon Resource Names (ARNs) that caused the throttling for the specific request. Here’s an example of the new exception format:
To protect backwards compatibility, the error code and message will not be altered. The ThrottlingReasons list typically contains a single entry per throttled request. However, batch requests, transactions, or requests that involve multiple GSIs might result in multiple throttling reasons being returned.
The Reason field is a concatenation of three parts: resource type (table or index), request type (read or write), and throttling type (described in the following table):
| Reason | Explanation |
| ProvisionedThroughputExceeded | Traffic exceeds the provisioned capacity on a table or a global secondary index in provisioned mode. |
| MaxOnDemandThroughputExceeded | Traffic exceeds the configured maximum throughput on a table or index in on-demand mode. |
| AccountLimitExceeded | The table-level read/write throughput limit for the account is exceeded by a table or a global secondary index in on-demand mode. |
| KeyRangeThroughputExceeded | A small part of the keyspace (corresponding to a single partition) exceeds the internal limit of 3,000 read requests or 1,000 write requests per second. |
By using these structured fields, you can obtain a precise diagnosis and corresponding mitigation instantly. Whether it’s a misconfiguration on a GSI, a hot partition, or a capacity planning oversight, you can now see the exact reason DynamoDB is asking your application to slow down, and respond accordingly.
New CloudWatch metrics for detailed throttling reasons
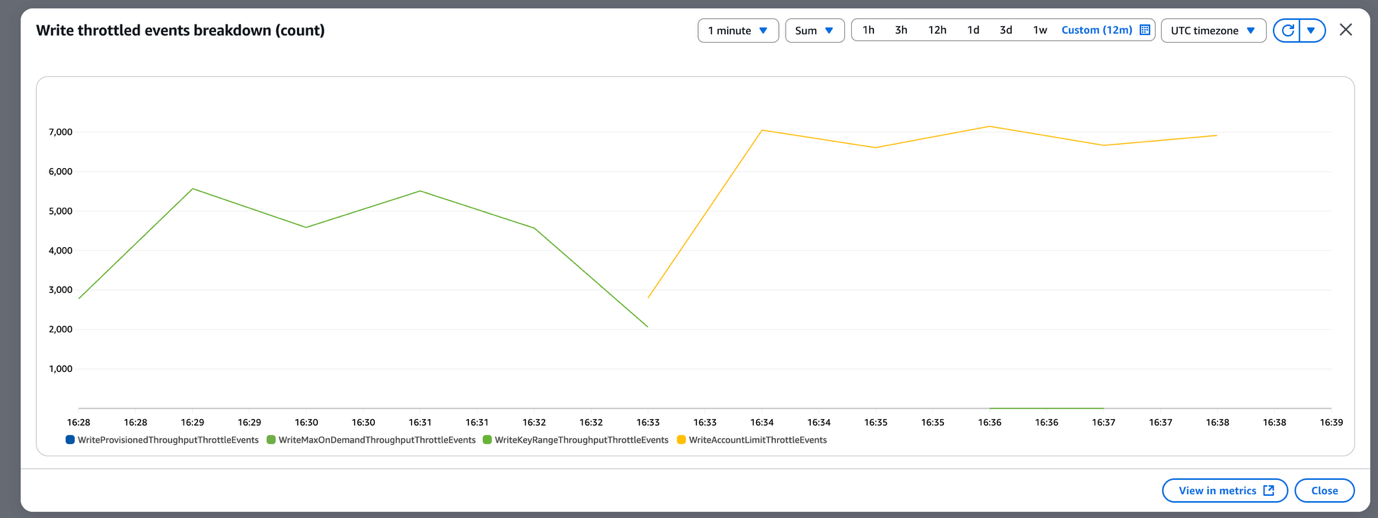
Every DynamoDB table and GSI already publishes CloudWatch metrics for ReadThrottleEvents and WriteThrottleEvents, which are incremented when a request causes a throttle event on the resource. Today, we’re introducing eight new metrics—one for reads and writes for each of the four different types of throttling:
ReadProvisionedThroughputThrottleEventsWriteProvisionedThroughputThrottleEventsReadMaxOnDemandThroughputThrottleEventsWriteMaxOnDemandThroughputThrottleEventsReadAccountLimitThrottleEventsWriteAccountLimitThrottleEventsReadKeyRangeThroughputThrottleEventsWriteKeyRangeThroughputThrottleEvents
The screenshot below shows the new throttle events breakdown graph available in the DynamoDB console:
Mitigating DynamoDB throttling
You can use the changes we’re making today to mitigate throttling on your DynamoDB resources within minutes. The specific steps to take depend on the throttling reasons.
If the throttling reason is ProvisionedThroughputExceeded, the next step is to identify which resource—table or index—was throttled and increase its provisioned read or write capacity using the UpdateTable API. You can also consider enabling Application Auto Scaling to manage capacity automatically, or switching to on-demand mode for the best operational experience.
To mitigate MaxOnDemandThroughputExceeded, increase or remove the maximum on-demand throughput on the table or index using the UpdateTable API.
In case of AccountLimitExceeded, request an increase for the table-level read or write throughput limit for the account using AWS Service Quotas (quota code L-CF0CBE56 for reads and L-AB614373 for writes).
The most difficult type of throttling to mitigate is KeyRangeThroughputExceeded. It covers two distinct cases: either your traffic temporarily exceeded the warm throughput of the table or index, or the traffic is not uniformly distributed over the key range. In the former case, DynamoDB will scale your resource and the throttling should be temporary. To prevent these throttles going forward, use the UpdateTable API to pre-warm your table or index ahead of time. If the throttling persists, it’s probably falling into the latter category. In this case, make sure that your schema follows best practices and your table or index doesn’t have hot keys. The recommended way to investigate this is by using CloudWatch Contributor Insights for DynamoDB, which helps identify the specific partition keys experiencing the most throttling. In the next section, we cover a recent launch that significantly improves access to these insights in a more cost-effective way.
Detect hot keys instantly with CloudWatch Contributor Insights—now optimized for throttling events
Diagnosing non-uniform access patterns has historically been one of the more challenging aspects of working with DynamoDB. While throttling metrics and exception messages can help indicate a problem, pinpointing which specific keys are receiving disproportionate traffic requires deeper visibility. That’s where CloudWatch Contributor Insights for DynamoDB comes in.
Previously, when you enabled CloudWatch Contributor Insights on a DynamoDB table or index, an event was emitted for every data plane operation, reporting all accessed keys and all throttled keys to CloudWatch. Today, we are announcing a new mode for Contributor Insights: throttled-keys-only. If you select this mode for your table, only throttled key events will be reported to CloudWatch. This means you get near real-time visibility into the partition keys that are driving throttling without incurring monitoring costs when your application is running smoothly.
Here’s how it works:
- The new Contributor Insights mode specifically aims to improve visibility into throttling, while minimizing monitoring costs.
- When DynamoDB detects throttling on a table or index, metrics are automatically emitted that show the top contributors involved in those throttled requests.
- These metrics are published to CloudWatch only during throttling events, so you pay only when insights are generated.
This new throttling-focused mode makes CloudWatch Contributor Insights a low-risk, high-reward addition to every production DynamoDB table. It can be enabled in the AWS Management Console or using CloudFormation, AWS Command Line Interface (AWS CLI), and AWS SDKs. CloudWatch Contributor Insights introduces no performance impact and delivers immediate value when performance issues occur. If no throttling is observed, there’s no data ingestion and no cost.
We recommend enabling Contributor Insights in throttled-keys-only mode on all tables, particularly those with uneven access patterns or variable workloads. With throttling observability now baked into both your exception handling and your monitoring pipeline, you’ll be equipped to diagnose and resolve issues before they impact your users.
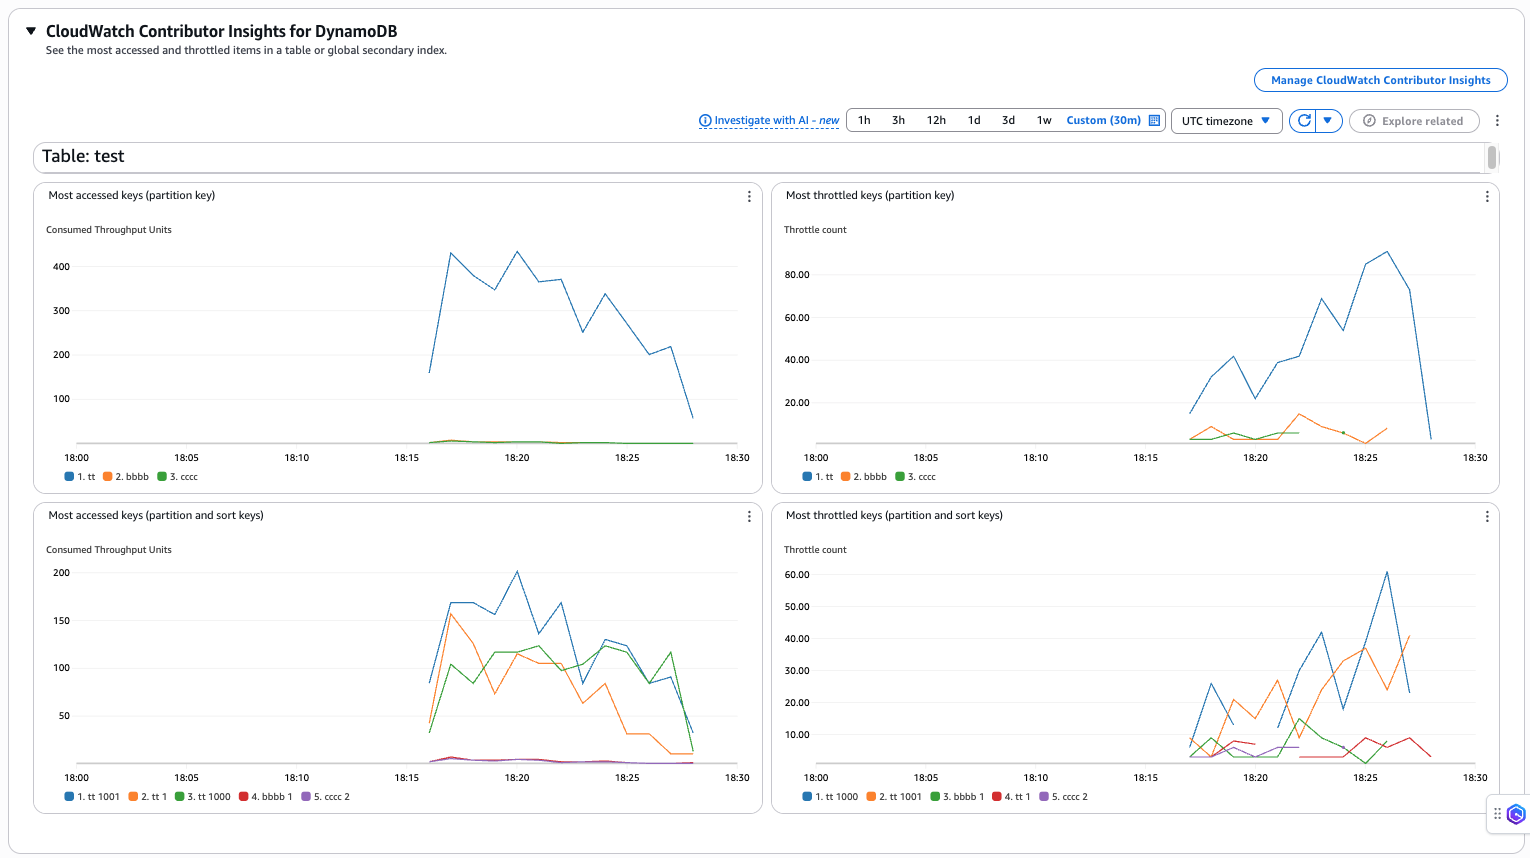
The following screenshot shows Contributor Insights enabled using the default configuration, which tracks the most accessed and throttled partition keys:
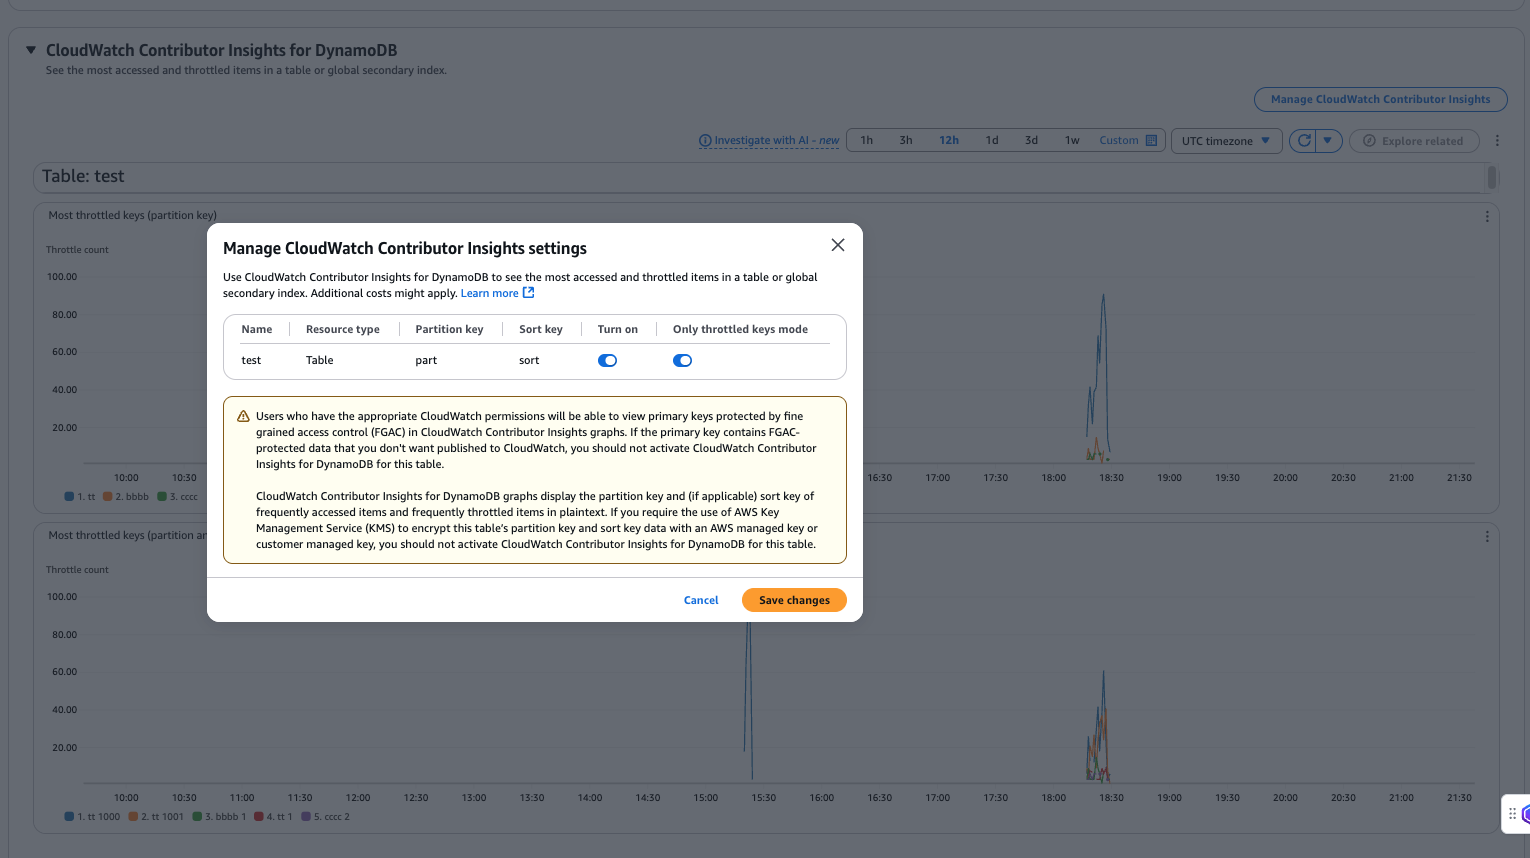
To use throttled-keys-only mode, toggle the “Only throttled keys mode” setting in the CloudWatch Contributor Insights configuration, as shown below:
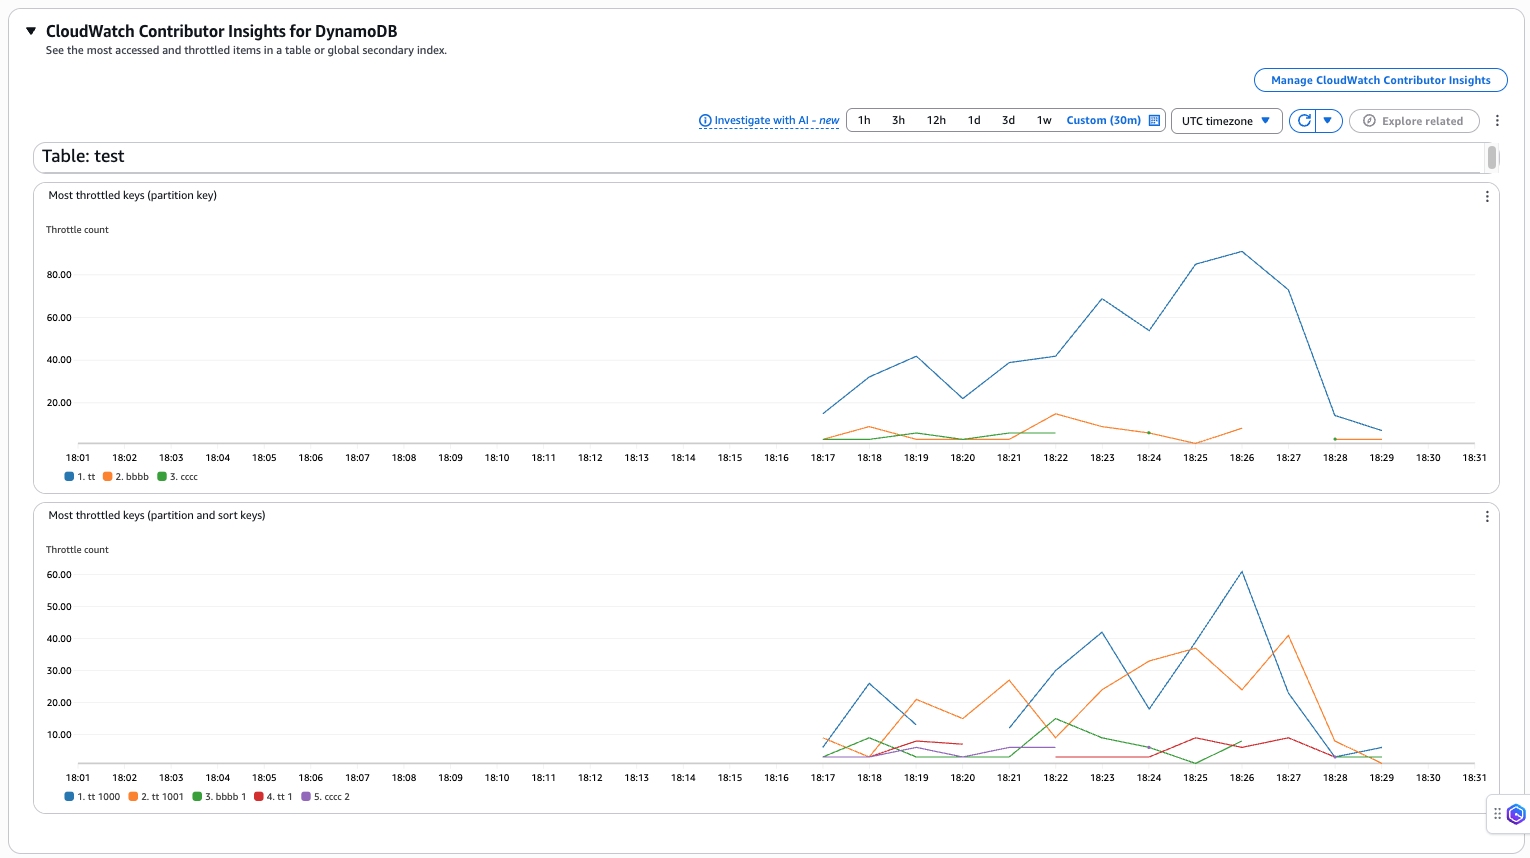
Once throttled-keys-only mode is enabled, the dashboard displays only throttling metrics, as shown in the screenshot below:
Considerations: ThrottlingException is now a modeled exception in strongly typed AWS SDKs
As of the SDK release published today, DynamoDB has updated how it models one specific error type, the ThrottlingException in strongly-typed SDKs, such as the AWS SDK for Java 2.x. This change brings more accurate exception modeling and better support for handling throttling-related errors in your applications.
Previously, when a throttling event occurred, the error was represented as a generic DynamoDbException object, even though the underlying error code was ThrottlingException. For example:
With the latest SDK, ThrottlingException is now modeled as a distinct class that extends DynamoDbException, and includes additional context such as specific throttling reasons and affected resources:
What this means for your code
This change improves the developer experience and observability, but it might also impact applications that rely on exact class matching in exception handling. For example, if your code looks like the following:
It might no longer catch the new ThrottlingException, which is now a subclass of DynamoDbException. To make your code resilient to this change, update it to use instanceof instead:
Who is affected?
This change affects applications that use strongly-typed SDKs, such as Java, .NET, or Go, and are configured with on-demand (pay-per-request) throughput for their tables or indexes. It does not affect applications using provisioned throughput, nor does it impact SDKs for dynamically-typed languages like Python (Boto3), or the AWS CLI, where exceptions are not modelled as specific classes.
If you’re using Java or another strongly-typed SDK, we recommend reviewing your exception handling code before upgrading to the latest SDK version.
Conclusion
The new features of DynamoDB provide developers with tools to better understand throttling and optimize their applications’ performance accordingly. By combining our new throttle-only mode for CloudWatch Contributor Insights to understand hot keys with detailed exception messages, you get comprehensive visibility into your DynamoDB workloads whenever you experience throttling.
The key benefits these features deliver include:
- Immediate root cause identification: New exception fields tell you precisely why and where throttling occurred
- Cost-effective hot key detection: CloudWatch Contributor Insights now activates only during throttling events, making it practical for all production tables
- Granular monitoring capabilities: New CloudWatch metrics provide detailed breakdown of throttling events by type
To get started with these enhancements:
- Enable the new throttle only CloudWatch Contributor Insights mode on your tables.
- Update your SDK to the latest version to access the enriched exception messages.
- If you’re experiencing throttling on a table or index, refer to the DynamoDB console to view the new CloudWatch metrics for detailed throttling reasons.
The enhanced exception messages and the CloudWatch metrics are provided at no additional charge. CloudWatch Contributor Insights follows standard CloudWatch pricing, with the new throttle only mode significantly reducing costs by emitting data only when throttling occurs. For detailed implementation guidance, see the CloudWatch Contributor Insights for DynamoDB documentation. Start using these enhanced observability features today to build more resilient applications and deliver consistent performance at any scale. The next time you need to troubleshoot a throttling event, this precise information will help you resolve issues faster and keep your customers happy.