AWS Database Blog
Announcing Valkey GLIDE 2.0 with support for Go, OpenTelemetry, and batching
AWS recently announced, in collaboration with Google Cloud and the Valkey community, the general availability of Valkey General Language Independent Driver for the Enterprise (GLIDE) 2.0, the latest release. Valkey GLIDE is multi-language client library designed for reliability and performance. It is a multi-vendor open source project and one of the official client libraries for the Valkey project. Valkey is the most permissive open source alternative to Redis and is stewarded by the Linux Foundation, meaning it will always be open source. With this latest release, Valkey GLIDE 2.0 extends support to Go developers (contributed by Google Cloud), improves observability through integration with OpenTelemetry, and optimizes performance with support for pipeline batching.
In this post, we discuss what Valkey GLIDE is and its key benefits, and then dive into its new enhancements.
Valkey GLIDE: a modern client solution delivering enterprise-grade performance and reliability
Valkey GLIDE was developed to address frequent requests by developers using Valkey and Redis OSS for an enterprise-grade, reliable, performant, and feature-rich client to meet the requirements of large scale, multi-language environments. The Amazon ElastiCache and Amazon MemoryDB team at AWS spent more than a decade helping customers achieve operational excellence with the clients by configuring best practices and resolving operational challenges such as inconsistent error handling, inefficient connection management, and a lack of feature parity across client libraries. Additionally, managing multiple client libraries in environments with multiple programming languages often led to fragmented logic and inconsistent behavior.
Valkey GLIDE is an official open source Valkey client library designed to provide a consistent, reliable, and performant experience for Valkey and Redis OSS users across multiple programming languages. Built on a Rust core and extended through lightweight language-specific wrappers, GLIDE supports all Valkey and Redis commands while incorporating best operational practices. This architecture provides consistent behavior across languages, reduces development overhead, and simplifies connection management, error handling, and cluster topology updates.
Valkey GLIDE offers the following key benefits:
- Reliability – Automatic handling of cluster topology changes, node failures, and reconnections provides seamless application performance
- Performance – Read-from-replica support and new pipeline capabilities optimize latency and throughput in high-frequency workloads
- Multi-Language Support – Consistent API behavior is available across Java, Python, Node.js, and now Go, with more languages planned
- Operational excellence – Preconfigured connection handling, error management, and failover strategies reduce the likelihood of outages.
Now let’s dive into the three new major enhancements provided by GLIDE 2.0.
Support for Go
Valkey GLIDE 2.0 extends its multi-language support to Go, joining Java, Python, and Node.js to provide a consistent, fully compatible API experience across all four languages—with more on the way. Go developers can now take advantage of GLIDE’s set of robust, enterprise-grade features capabilities, including automatic cluster topology discovery, advanced connection management, and read-from-replica support. These shared features provide consistent, reliable performance across all supported languages, simplifying multi-language deployments and reducing operational overhead.
The Valkey GLIDE Go client is designed to deliver high performance without sacrificing simplicity. It follows a synchronous API model, aligning with Go’s standard key-value store patterns while providing full thread safety for concurrent usage. Under the hood, the client uses a single multiplexed connection per node, allowing multiple commands to be pipelined efficiently, minimizing socket overhead and optimizing system resources. Although the API is currently synchronous, it is specifically optimized for concurrent execution through Go’s native goroutines, enabling developers to handle multiple requests without blocking.
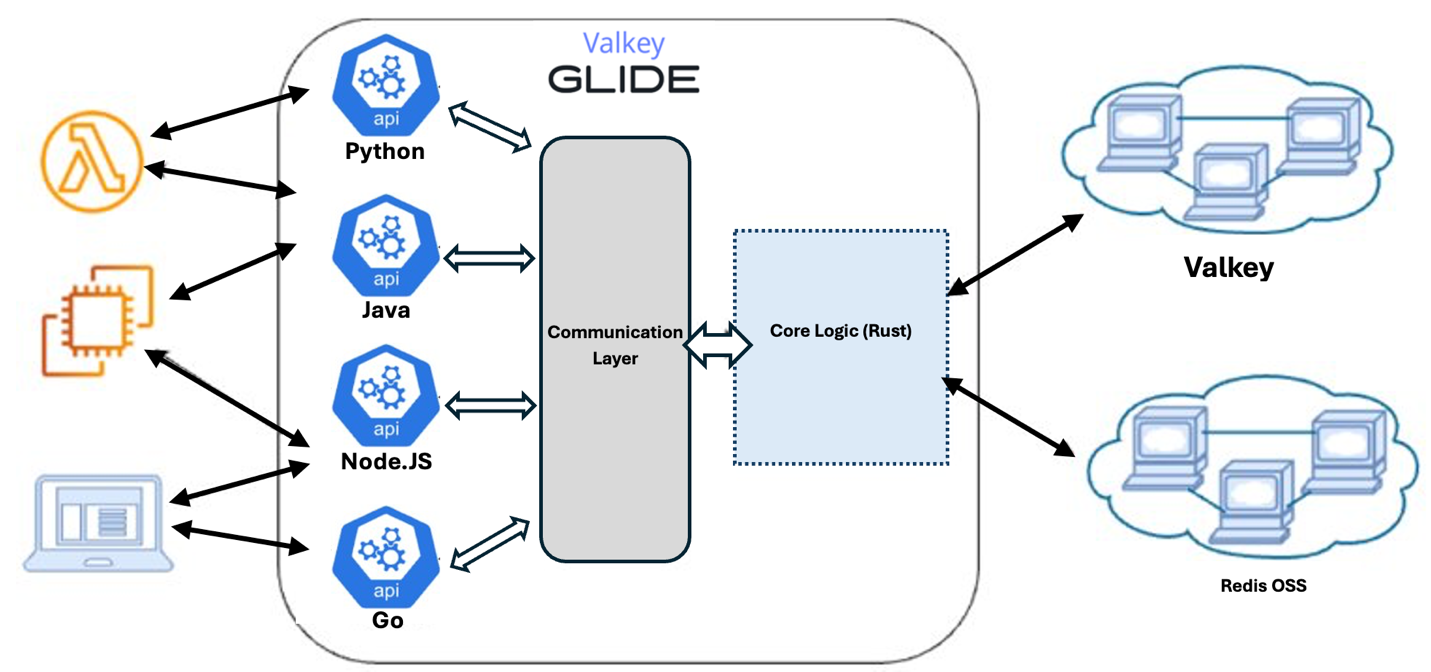
The Valkey GLIDE Go client is built on a Rust core engine that handles connection pooling, node communication, and retry logic with memory-safe concurrency. The Go wrapper provides a lightweight, idiomatic interface with structured error handling and native support for Go routines. A unified communication layer links the Go wrapper to the Rust core, providing consistent behavior across supported languages and minimizing feature disparity.
Support for Go was contributed by Google Cloud and is a great example of the rapid innovations made possible by open source collaboration. To get started the new Go wrapper or to contribute to the project, check out the Valkey GLIDE Go client GitHub repository and refer to the README for examples of running standalone and cluster deployments.
The following diagram shows how applications written in different languages connect to GLIDE, which routes requests through a shared communication layer to a unified Rust-based core. This architecture ensures consistent behavior across languages when interacting with the Valkey backend.
Enhanced observability with OpenTelemetry
Observability is consistently one of the top feature requests by customers. Valkey GLIDE 2.0 introduces support for OpenTelemetry, enabling developers to gain deep insights into client-side performance and behavior in distributed systems. OpenTelemetry is an open source and vendor-neutral framework that provides APIs, SDKs, and tools for instrumenting applications to generate, collect, and export telemetry data such as traces, metrics, and logs. It supports multiple programming languages and can be integrated with various observability backends like Prometheus, Jaeger, and commercial solutions such as Amazon CloudWatch.
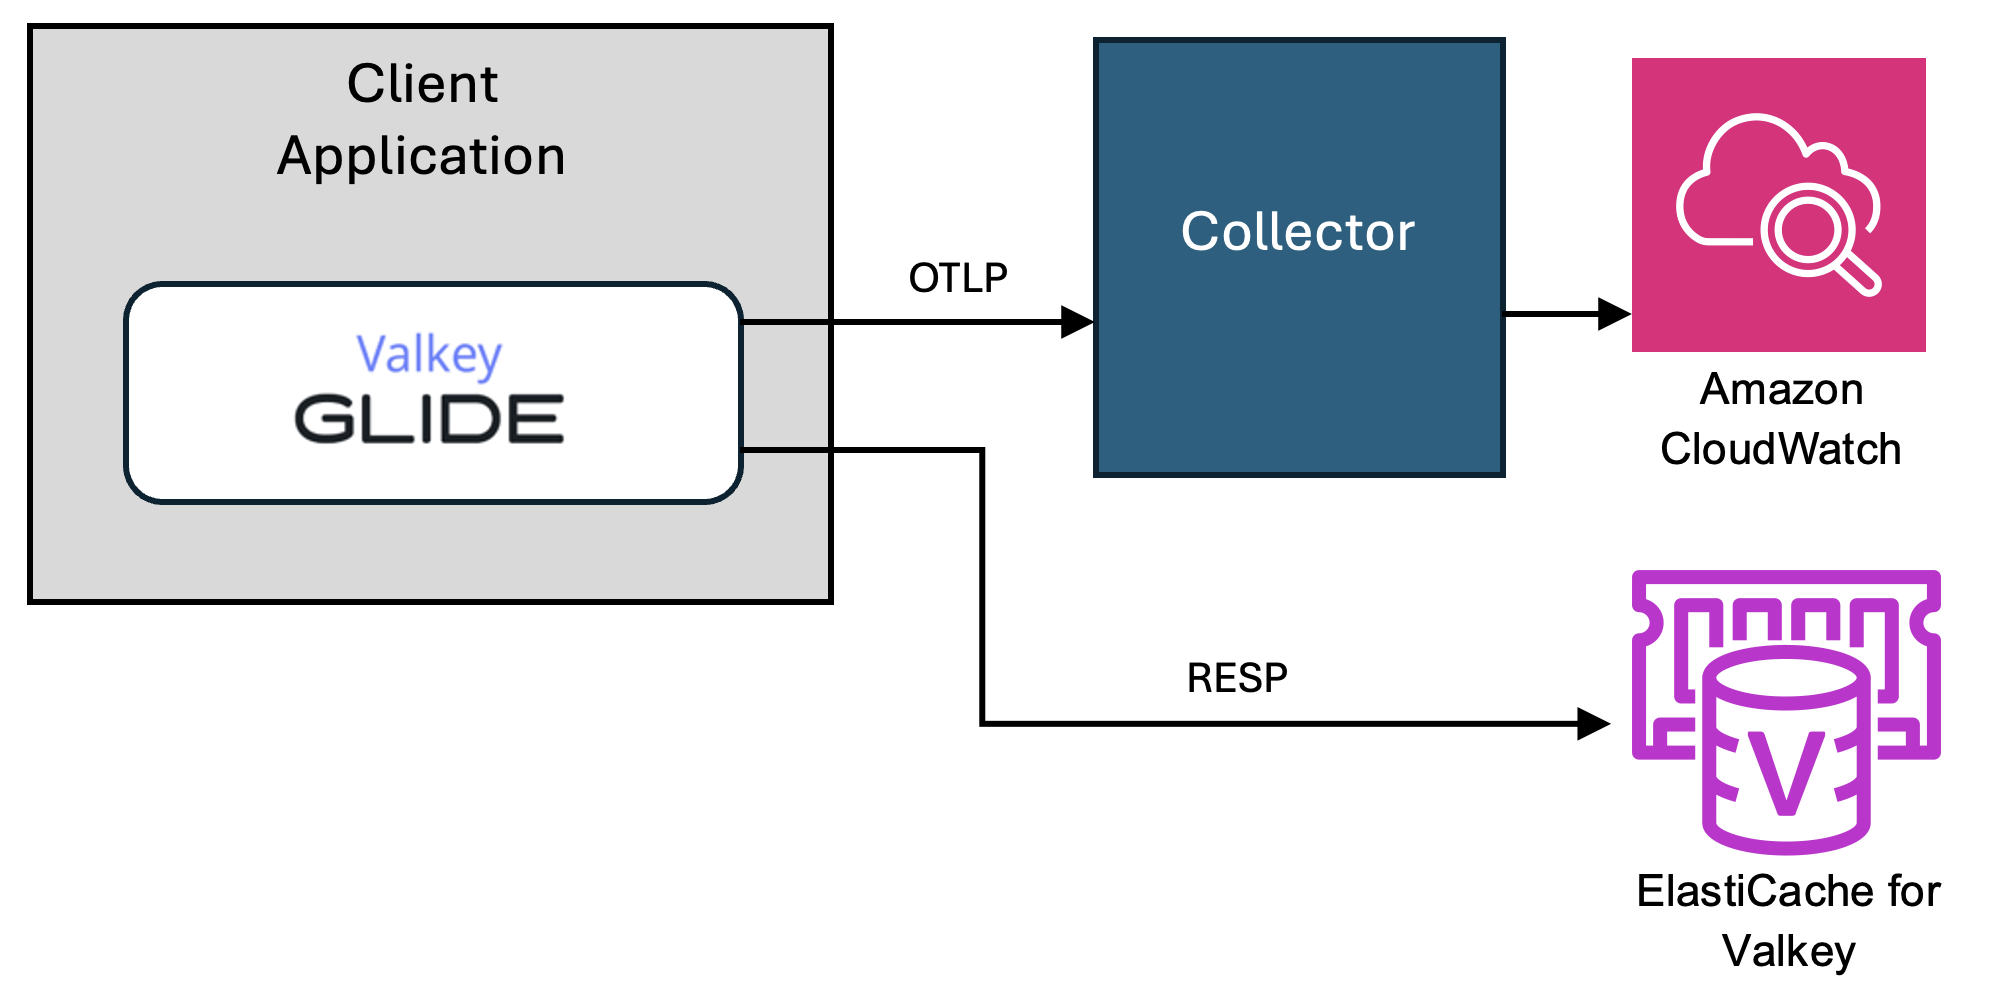
The following diagram illustrates how GLIDE integrates with OpenTelemetry to provide observability across languages. Telemetry data is exported via the OTLP protocol to an OpenTelemetry collector, which then forwards the data to CloudWatch or any other supported backend. Meanwhile, application requests flow through GLIDE’s language-specific wrappers to a shared communication layer that interacts with Valkey using the RESP protocol. This architecture delivers both consistent Valkey access and unified telemetry across environments.
Using GLIDE’s OpenTelemetry integration is straightforward and allows you to adopt observability best practices without disrupting existing workloads. After you initialize the OpenTelemetry configuration with the endpoint to their external collector, GLIDE begins emitting default metrics—with no additional client-side code changes required.
Metrics overview
The following metrics are available out of the box. These metrics can be consumed directly from your telemetry backend and used to build dashboards, set alerts, and analyze trends.
- Timeouts – Counts the number of requests that exceeded their configured timeout duration
- Retries – Tracks how many times operations were retried due to transient errors or topology changes
- Moved errors – Captures how often a
MOVEDresponse was received from the server, indicating key reallocation
Tracing integration
GLIDE automatically creates a trace span for each supported Valkey command, providing fine-grained visibility into client-side execution latency. This span tracks the lifetime of the request—from the moment it is created to the moment a response is received or the command fails.
Each command-level span also contains a nested child span named send_command, which specifically measures the time spent sending the command to the Valkey server and waiting for a response. With this information/data, you can distinguish between local queuing delays and server-side communication latency.
Additionally, every span includes a status field (OK or Error), making it straightforward to analyze request success rates, identify patterns in failure modes, and troubleshoot problems across distributed environments.
You have full control over how much tracing data is collected through the samplePercentage setting. This configuration determines what percentage of commands are sampled for tracing. For production environments, a lower sampling rate (such as 1–5%) is typically recommended to maintain a balance between detailed observability and minimal performance overhead.
Getting started
To begin collecting telemetry data with GLIDE 2.0, you just need an OpenTelemetry collector endpoint. This endpoint serves as the destination for traces and metrics emitted by the client. The collector acts as an intermediary, forwarding data to your observability backend such as CloudWatch, Prometheus, Jaeger, or even a local file for development or debugging.
You can use the following protocols for your collector endpoint:
- http:// or https:// – Send data over HTTP or HTTPS
- grpc:// – Use gRPC for more efficient communication
- file:// – Write telemetry data to a local file (useful for local development)
Prerequisites
Before starting, make sure you have the following:
- An OpenTelemetry collector configured and running
- A destination backend (such as CloudWatch, Prometheus, or Jaeger) receiving data from the collector
- Alternatively, you can configure GLIDE to export telemetry data directly to a local file for development or debugging purposes, without requiring a running collector.
GLIDE does not directly export telemetry to third-party services—it pushes data to your collector, giving you full flexibility over where and how telemetry is processed and stored.
Example configurations
The following are two examples of configuring OpenTelemetry in GLIDE.
This Python setup enables both tracing and metrics with a sampling rate of 10% and a flush interval of 1 second:
This Go configuration sends telemetry data to the local OpenTelemetry Collector at 1-second intervals, with 10% sampling for traces:
By incorporating OpenTelemetry, GLIDE 2.0 enables full visibility into your Valkey client interactions without having to rewrite application logic. With minimal setup and full compatibility with the OpenTelemetry ecosystem, you can quickly gain operational insights, improve reliability, and monitor performance at scale. You can also expect future enhancements to observability with GLIDE, including more metrics, additional spans, richer attributes, and more. To learn more and get started with OpenTelemetry on Valkey GLIDE 2.0, see the Valkey GLIDE documentation.
Streamlining high-throughput workloads with batching
Customers running high-throughput workloads, such as bulk ingestion, large-scale caching, and real-time analytics, often need a way to reduce the network overhead of issuing many commands in rapid succession. To address this, Valkey GLIDE 2.0 introduces batching, which allows clients to send multiple commands in a single request. Previously, each command to Valkey would trigger its own request-response cycle, introducing round-trip latency for every call. With batching, commands can be queued and sent together without waiting for responses. The client then reads the responses in one pass, reducing network overhead, improving resource utilization, and significantly increasing throughput.
Performance comparison: Batching compared to non-batching
To illustrate how batching can outperform an asynchronous-futures approach under a more complex, real-world workload, we benchmarked two implementations that issue hundreds of HMGET calls per batch against a Valkey cluster. One approach uses individual asynchronous futures, and the other uses GLIDE’s ClusterBatch pipelining. Both run the same logic:
- Generate 400 distinct hash keys (
hXXXXXXXXXX) of length 10. - Generate 5 field names (
fXXXXXXXX) of length 8. - Issue 400
HMGETcommands to retrieve those 5 fields from each key.
The following Java code is the baseline (futures-based) version of CustomCommand, which submits HMGET calls as individual futures and waits for them to complete:
In contrast, the pipelined (batch-based) version queues all 400 HMGET calls into a single ClusterBatch. When exec(batch) is invoked, GLIDE sends one network request per node to fetch all 400 commands in a single pass:
We tested both implementations under a fixed QPS cap of 45 requests/sec (18,000 HMGET operations/sec) across increasing levels of concurrency and found that across all concurrency levels, pipelining delivered consistently lower latency with identical throughput, demonstrating its advantage for high-volume, multi-key workloads. We performed the same test with unlimited QPS, which produced the same latency improvements but with 190% – 257% higher throughput. Here’s how GLIDE’s pipelined approach (ClusterBatch) performed compared to individual async futures:
- 1 client, 1 thread
- Average latency reduced by 47% from 6,073ms to 3,211ms
- P99 latency reduced by 55% from 7,427ms to 3,649ms
- 3 clients, 3 threads
- Average latency reduced by 51% from 10,360ms to 5,131ms
- P99 latncy reduced by 42% from 19,621ms to 11,286ms
- 5 clients, 5 threads
- Average latency reduced by 60% from 17,504ms to 6,998ms
- P99 latency reduced by 64% from 35,640ms to 12,884ms
- 10 clients, 10 threads
- Average latency reduced by 61% from 36,779ms to 14,032ms
- P99 latency reduced by 65% from 77,701ms to 26,598ms
Cluster batch example
The following code is another cluster mode example highlighting batching patterns you can use in production with examples of both atomic and non-atomic operations. This snippet demonstrates cluster-specific batching, but Valkey GLIDE also supports standalone-mode batching.
The code contains the following key components:
- Client and options – We build a
GlideClusterClientpointing to one node; GLIDE auto-discovers all shards. We set a singleClusterBatchOptionstimeout (3,000 ms) for the entire batch. - Atomic cluster batch (transaction) – Using
new ClusterBatch(true), GLIDE wraps commands in aMULTI/EXECtransaction on one slot. We force both keys (acct:{1}:balance) into the same slot using a hash tag. - Non-atomic cluster batch (pipeline) – Using
new ClusterBatch(false), GLIDE splits commands across nodes by slot and pipelines them without atomicity. Responses arrive in command order (for example,["OK", "online", "OK", "offline"]).
Atomic compared to non-atomic: Trade-offs and best practices
Consider the following when choosing atomic or non-atomic mode:
- Atomic (transaction) mode:
- Use case – When multiple commands must be sent as a single, atomic unit, without interruptions (for example, debit and credit operations on the same account).
- Requirements – All keys must map to the same hash slot.
- Behavior – Commands are wrapped in a
MULTI/EXECblock.
- Non-atomic (pipeline) mode:
- Use case – When you want to push a high volume of independent commands as fast as possible, tolerating partial failures on per-command granularity. You can minimize round-trip latencies by sending all commands at once.
- Requirements – No special slot alignment is needed; GLIDE will group commands by slot behind the scenes.
- Behavior – Commands might be processed on different slots or nodes (in cluster mode), and other operations from different clients might interleave during execution.
By enabling batching, GLIDE 2.0 helps applications scale more efficiently under heavy workloads, reducing latency and improving overall system performance. Whether you’re updating millions of cache entries, ingesting high volumes of time-series metrics, or populating a distributed leaderboard, batching can dramatically reduce your network‐bound bottlenecks.
To learn more and get started with batching, see the Valkey GLIDE documentation on batching.
Summary
With the release of GLIDE 2.0, Valkey continues to push the boundaries of client-side operational excellence, delivering critical new features that address the needs of high-performance, multi-language environments. By extending support to Go, GLIDE now offers a consistent and reliable client experience across four major languages, simplifying multi-language deployments while maintaining Valkey’s reliability and performance.
The integration of OpenTelemetry further elevates GLIDE’s capabilities, empowering you to gain deeper insights into client-side operations with built-in metrics and flexible telemetry export options. Meanwhile, the introduction of pipeline batching addresses a key customer pain point, dramatically reducing network overhead and latency for high-throughput workloads.
As an open source project backed by AWS and Google Cloud, Valkey GLIDE is not only built for operational excellence but is also shaped by contributions from a growing community of developers. We invite you to explore the new capabilities, provide feedback, and contribute to the future of GLIDE. Valkey GLIDE is compatible with versions 7.2, 8.0 and 8.1 of Valkey, as well as versions 6.2, 7.0, and 7.2 of Redis OSS. Valkey GLIDE 2.0 is available now. To get started, visit the Valkey GLIDE GitHub repository and join the collaboration. For more information about Valkey’s official client libraries, visit the Valkey website.