Containers
Deep Dive: Amazon EKS Dashboard for Visibility into Multi-Cluster Operations and Governance
This blog post was jointly authored by Carlos Santana, Sr. Solution Architect, Containers; Sriram Ranganathan, Sr. Product Manager, Kubernetes; Sabari Sawant, Product Marketing Manager, Kubernetes; and Frank Carta, Sr. GTM specialist, Containers.
As organizations grow their Kubernetes infrastructure across AWS Regions and accounts, they face increasing challenges in maintaining oversight of their Kubernetes clusters. Without centralized visibility, teams often discover clusters running outdated software, miss security updates, execute unplanned upgrades, and encounter unexpected extended support costs. The Amazon Elastic Kubernetes Service (Amazon EKS) Dashboard addresses these challenges by providing a centralized interface that enables cloud architects and cluster administrators to maintain organization-wide visibility across their Kubernetes clusters.
The visibility challenge in multi-cluster Kubernetes management
As organizations expand their Kubernetes footprint to meet diverse business needs—such as improving availability, reducing latency, enforcing workload isolation, or making sure of data residency—they often deploy multiple EKS clusters across AWS Regions and accounts. Although this distributed model brings architectural and operational benefits, it also introduces a new class of challenges that can hinder governance and operational efficiency at scale:
- Cluster sprawl: Without centralized controls, clusters proliferate rapidly across teams, accounts, and AWS Regions. Platform teams often lose track of Kubernetes infrastructure inventory, leading to unmanaged environments and a lack of governance.
- Security risks: Clusters may run on unsupported Kubernetes versions or house outdated add-ons. These vulnerabilities expose environments to security risks and compliance violations, while the absence of organization-wide tracking makes timely remediation difficult.
- Operational inefficiencies: Manual coordination of upgrades and maintenance across clusters slows down operations. Teams lack central visibility into upgrade readiness insights, which results in inefficiencies in upgrading clusters.
- Rising support costs: Clusters that exceed their support lifecycle accrue even more extended support charges. Without cost forecasting or visibility into version lag, organizations face avoidable expenses and budgeting surprises.
These challenges underscore the need for a comprehensive, organization-wide view into the Kubernetes infrastructure—a capability the Amazon EKS Dashboard is purpose-built to deliver.
Introducing the Amazon EKS Dashboard
To address the visibility, compliance, and operational challenges introduced by distributed Kubernetes environments, Amazon EKS now includes a centralized dashboard experience. This native AWS console feature provides a unified view of Kubernetes resources—clusters, managed node groups, and Amazon EKS add-ons—across all AWS accounts and Regions in your organization. The Amazon EKS Dashboard enables platform engineers and cluster administrators to monitor cluster health and Kubernetes version status, identify clusters scheduled for end-of-support auto-upgrades, forecast cost implications for clusters using extended support, and pinpoint node groups and add-ons in need of version updates. Consolidating metadata such as version distribution, node types, support lifecycle, and configuration allows the Amazon EKS Dashboard to minimize the need for custom tooling or third-party solutions to get visibility across all of your Kubernetes clusters. This comprehensive interface allows platform teams to operate with confidence and clarity, making sure of proactive governance across their Kubernetes clusters. This interface provides functionality to:
- Monitor cluster health and Kubernetes version status
- Identify clusters approaching end of support auto upgrades
- Forecast financial implications of running older cluster versions
- Streamline inventory tracking without the need for third-party tools or custom scripts
The dashboard is available as a native Amazon EKS console feature, making sure of a seamless user experience and eliminating the burden of external tool maintenance, as shown in the following figure.

Getting started with Amazon EKS Dashboard
Users can access the Dashboard in the Amazon EKS console through the AWS management and delegated administrator accounts. The setup process is direct and includes enabling trusted access as a one-time setup in the Amazon EKS console’s Dashboard settings page, as shown in the following figure. Enabling trusted access enables the management account to view the Dashboard in the Amazon EKS console. For more information on setup and configuration, organizations can refer to the official AWS documentation.
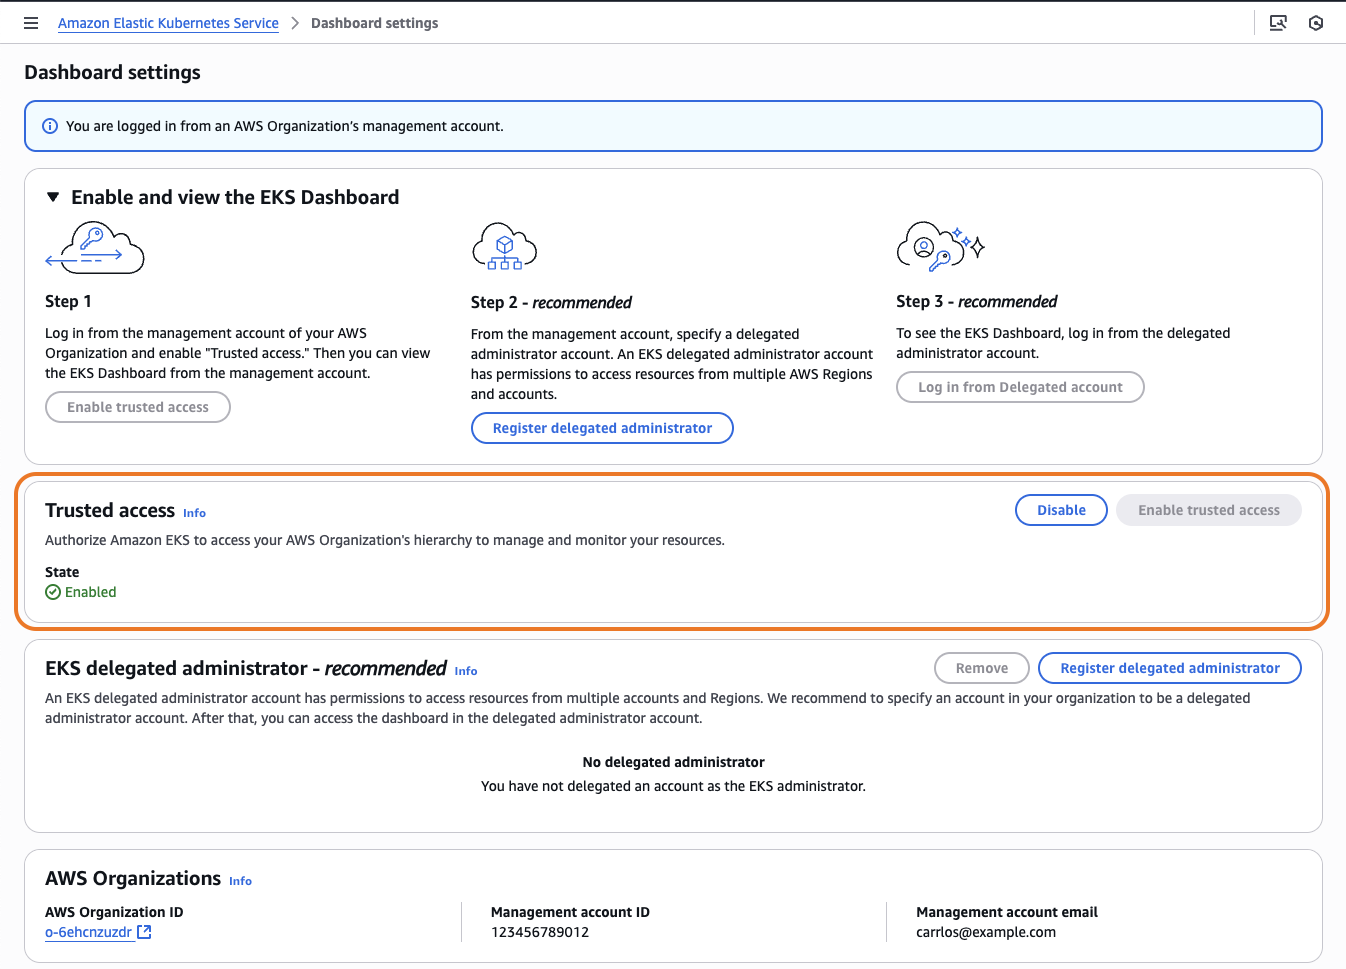
Figure 2: Dashboard settings
For organizations preferring to use the Amazon EKS Dashboard from a non-management account, any member account in their Organizations can be enrolled as the delegated administrator account for Amazon EKS to view the dashboard. Through the dashboard settings page in the management account, organizations can register any member account in Organizations as the delegated administrator for Amazon EKS, as shown in the following figure. When the registration is completed, users can access the Dashboard by logging in to the delegated administrator account and navigating to the Dashboard link on the left sidebar of the Amazon EKS console.

Figure 3: Register delegated administrator

Figure 4: Provide any Organizations member account as delegated administrator for Amazon EKS

Figure 5: Access Dashboard using link in Amazon EKS console
The Amazon EKS multi-cluster Dashboard provides visibility into three key resource types:
Clusters: View aggregated information about EKS clusters such as:
- Clusters with upgrade insights
- Cluster distribution based on support type
- Breakdown of clusters by Kubernetes version
Managed node groups: View aggregated information about managed node groups such as:
- Node groups by Amazon Machine Image(AMI) type, such as Amazon Linux or Bottlerocket
- Node group auto-repair configuration
- Instance type distribution
Amazon EKS add-ons: View aggregated information about Amazon EKS add-ons such as:
- Number of installations per add-on
- Version distribution per add-on
- Add-ons with health issues
Amazon EKS Dashboard use cases
In the following sections we explore some common operational scenarios where the Amazon EKS Dashboard enables several operational scenarios.
Use case 1: Version lifecycle and cost forecasting
Cluster administrators can use the dashboard to identify clusters that are enrolled in extended support. The following visualization presents a breakdown of clusters in the organization based on their support type configuration between standard and extended support.

Figure 6: Dashboard widget of Clusters by support type
Users can also visualize which clusters are nearing end-of-support auto-upgrades grouped by Kubernetes cluster version. A flexible dropdown menu allows users to choose different time periods, such as the next 30 days or other predefined intervals, as shown in the following figure. Teams can view which clusters are set for end-of-support auto-upgrades, enabling proactive tracking and planning for Kubernetes cluster upgrades while minimizing infrastructure disruption.

Figure 7: Filterable view showing clusters scheduled for auto upgrade over selected timeframes
Beyond version management, organizations can also use the dashboard to project potential costs associated to EKS clusters when clusters are not upgraded within the recommended timelines, as shown in the following figure. A tracking widget monitors the number of days that clusters remain on older versions and provides clear estimates of the financial implications of delayed upgrades. This enables organizations to align infrastructure maintenance with fiscal planning, making sure of both operational resilience and cost efficiency.

Figure 8: Cost forecasting widget estimating extended support charges
Although tracking Kubernetes versions and forecasting extended support costs provides strategic oversight for your organization, making sure of the operational health of your clusters and node groups is equally critical for maintaining a robust infrastructure.
Use case 2: Cluster and node group health
2.1 Upgrade readiness: Cluster administrators use the Dashboard to filter and display clusters with upgrade insight severity issues, as shown in the following figure. The dashboard presents an upgrade readiness view that highlights clusters based on the number and severity of upgrade insights. These insights flag potential incompatibilities or configurations that could interfere with a successful version upgrade. Using this data allows administrators to proactively address issues before initiating upgrades, thereby making sure of smoother transitions, minimizing disruptions, and maintaining system integrity throughout the upgrade lifecycle.

Figure 9: Resource view showing upgrade insights severity issues per cluster
2.2 Node group health: Although upgrade readiness focuses on cluster-level health, equally important is the health of individual node groups. Cluster administrators analyze node group configurations across accounts and AWS Regions to detect those with auto-repair disabled. The dashboard presents a visual breakdown highlighting how many node groups have this critical feature turned off, as shown in the following figure. Auto-repair minimizes downtime by automatically replacing unhealthy nodes, making sure that services remain available during instance failures. Identifying and remediating node groups without auto-repair enabled allows organizations to strengthen fault tolerance, support high availability goals, and reduce manual intervention during recovery scenarios.
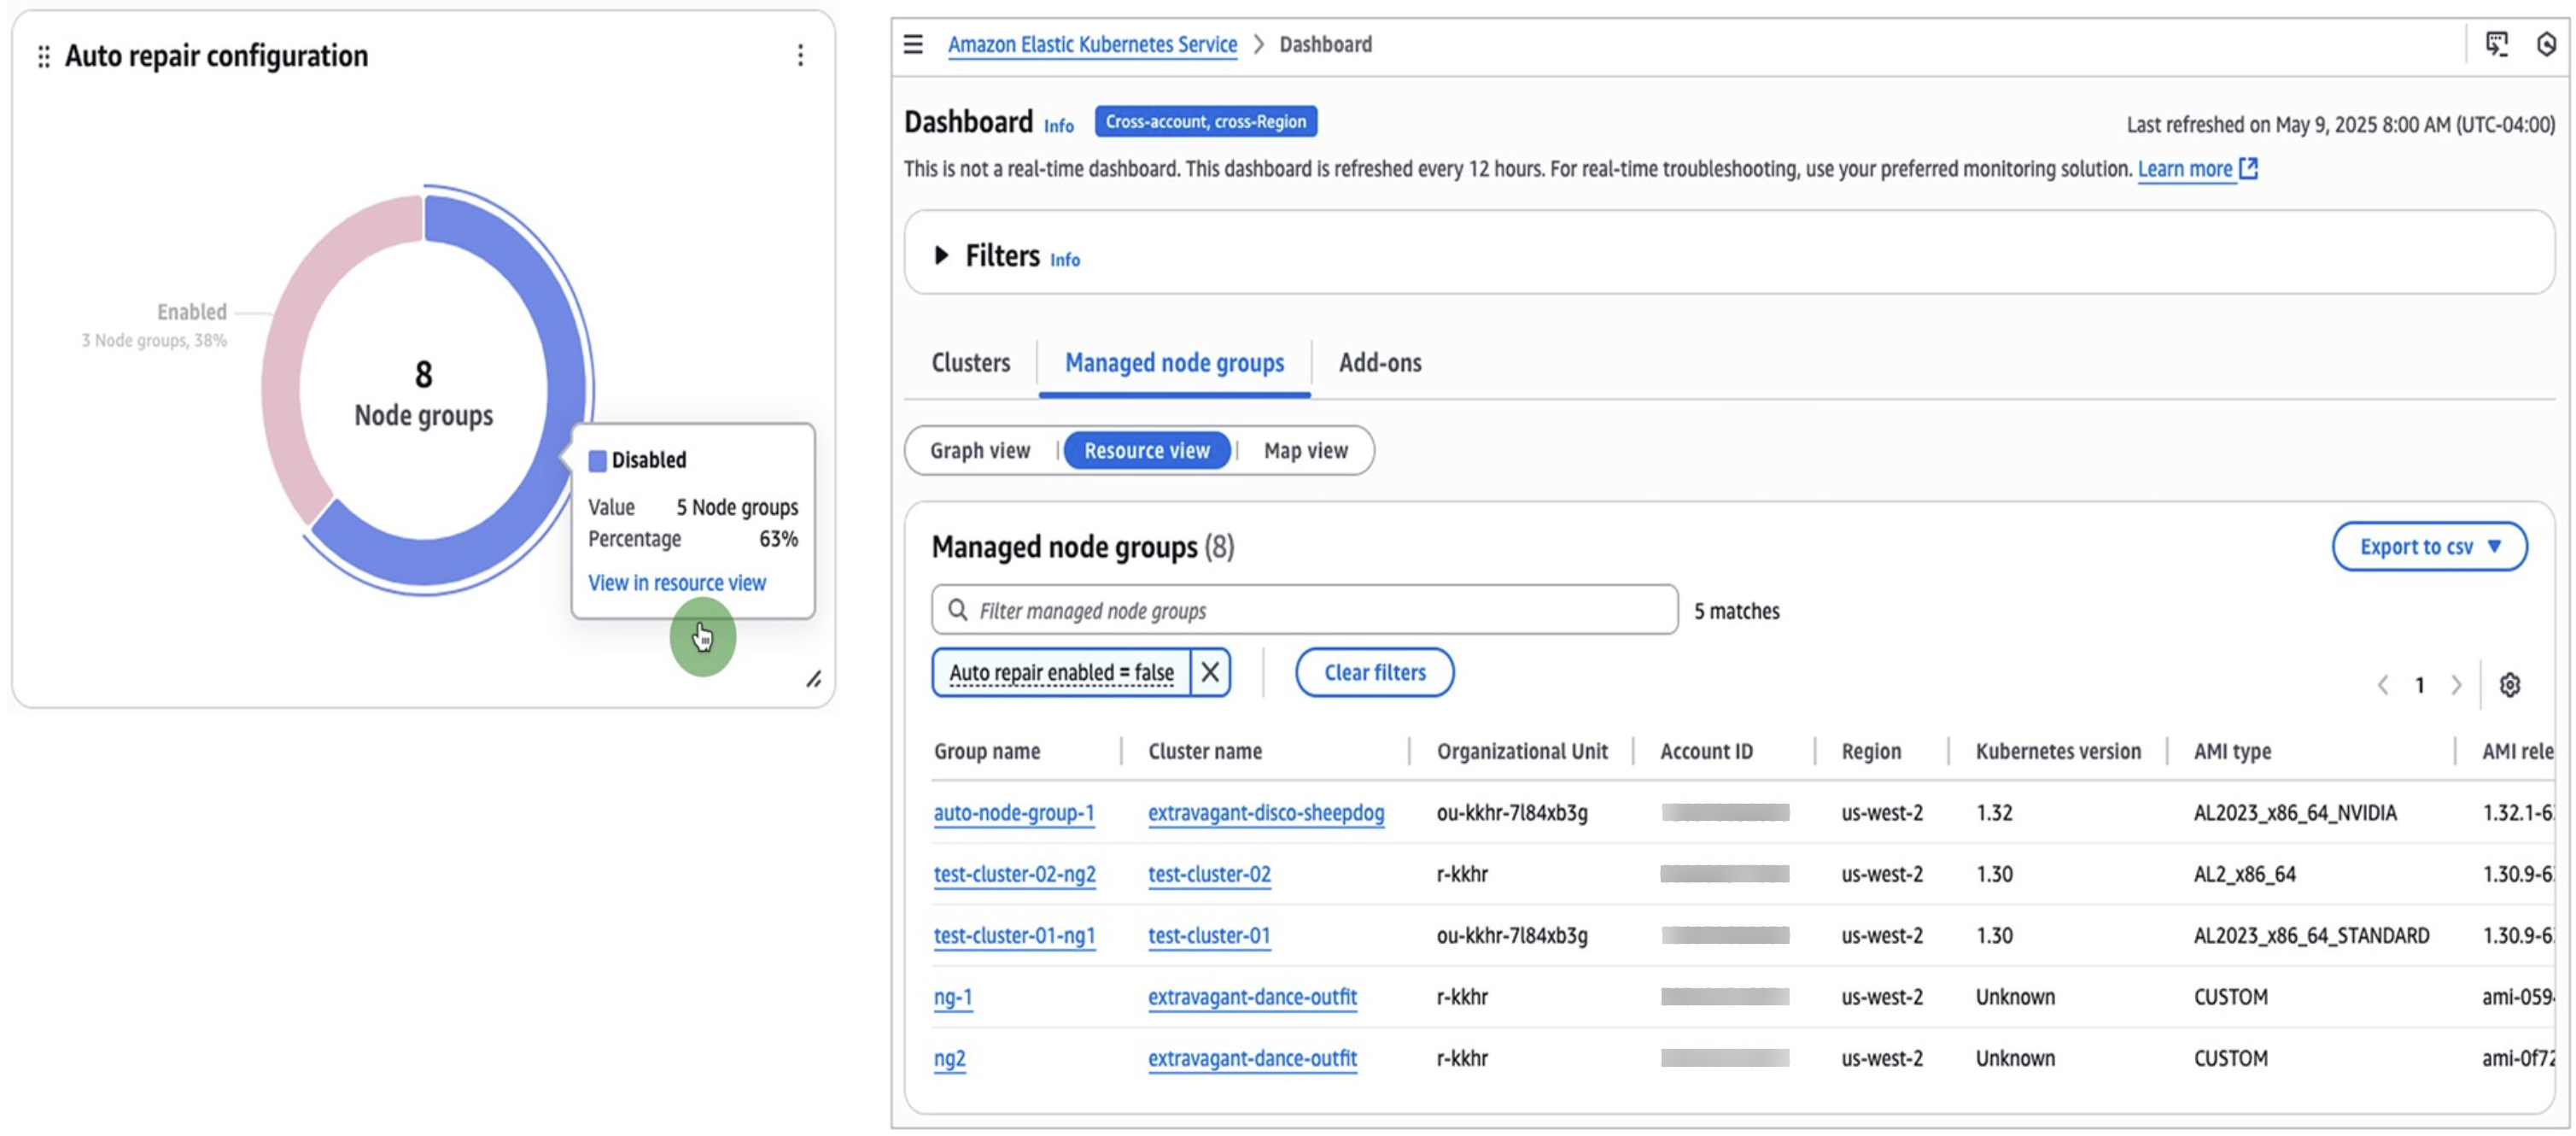
Figure 10: Resource view filtered by auto repair disabled
Beyond maintaining cluster and node group health through features such as auto-repair and upgrade readiness checks, organizations must make sure of consistent management of their Amazon EKS add-ons across their entire infrastructure to maintain security and compliance standards.
Use case 3: Amazon EKS Add-ons governance
Teams use the dashboard to streamline Amazon EKS add-ons management across multiple AWS accounts and Regions through a centralized version distribution view, as shown in the following figure. Administrators choose specific add-ons to view their version distribution, enabling efficient identification of clusters needing upgrades. This capability is particularly valuable when addressing security vulnerabilities or compliance mandates. The view resources feature enables teams to pinpoint clusters running outdated add-on versions, thereby facilitating targeted maintenance planning. This centralized visibility allows organizations to maintain consistent add-on versions across their clusters.

Figure 11: Amazon EKS add-ons version distribution
With operational monitoring, health management, and Add-on governance established through the dashboard, organizations can use comprehensive reporting capabilities to gain deeper insights into their Kubernetes infrastructure across AWS Regions and accounts. This enables data-driven decision making and compliance verification.

Figure 12: Resource view for Amazon EKS add-ons filtered by name and version
Use case 4: Reporting and extended insights
4.1 Data export and integration: Teams use CSV export functionality to extract both complete and filtered data sets from the dashboard. Organizations use this export feature for multiple purposes, such as uploading to storage services such as Amazon S3, sharing inventory information with auditors, and integrating with custom reporting platforms. This flexibility enables teams to extend cluster and infrastructure insights beyond the dashboard interface for advanced analysis, as shown in the following figure.
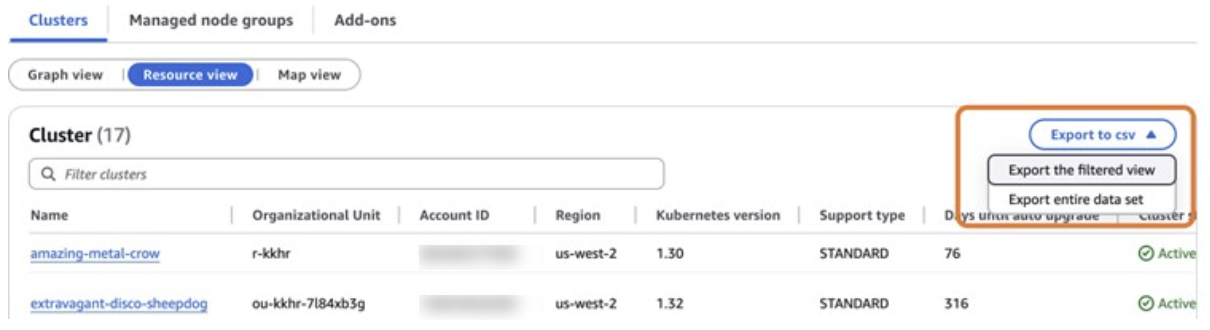
Figure 13: Choose Export to csv to download a csv file
4.2 AWS Regional resource compliance views: To complete the analytical picture, teams access a global map view to monitor resource distribution across AWS Regions for compliance and regulatory requirements. The Dashboard enables single-click access to filtered views of resources, allowing organizations to verify that clusters in specific AWS Regions meet business regulatory requirements, as shown in the following figure.

Figure 14: Global view shows cluster per AWS Region, choosing a Region shows the number of clusters
4.3 Historical trend analysis: Platform teams track critical Kubernetes infrastructure trends through historical data visualization. The dashboard displays cluster inventory growth, Kubernetes version adoption, and support type enrollment patterns over time, as shown in the following figure. This visibility enables teams to make data-driven decisions while monitoring their organization’s Kubernetes ecosystem progression.

Figure 15: Historical trend
Give Amazon EKS Dashboard a spin!
Amazon EKS Dashboard operates from the us-east-1 (N. Virginia) AWS Region, aggregating EKS cluster metadata from all commercial AWS Regions at no extra cost. Teams can begin visualizing their Kubernetes clusters by visiting the Amazon EKS console and enabling the new dashboard experience.
Check out our containers roadmap!
If you have ideas about how we can improve Amazon EKS Dashboard or other aspects of our container services, then please use our containers roadmap to provide us feedback and review our existing roadmap items.