AWS Business Intelligence Blog
Transforming business meetings to get real-time answers to data questions using Amazon Q in QuickSight
| All your trusted BI capabilities of Amazon QuickSight now come with powerful new AI features that integrate chat agents, deep research, and automation in one seamless experience with Amazon Quick Suite! Learn more » |
Business meetings often rely on data to make informed decisions, but waiting for follow-up reports or dashboard updates can slow down decision-making. Amazon Q in QuickSight offers a solution by helping teams ask questions in natural language and receive real-time, multi-visual answers. This post shows how to use Amazon Q during your meetings to obtain immediate, data-driven insights, making your team’s decision-making process faster and more efficient.
Solution overview:
With Amazon Q in QuickSight, business users can explore their data by asking questions in plain English—no technical expertise or dashboards required. The system instantly returns multi-visual answers that might include bar charts, KPI cards, tables, trend lines, and explanatory text, to give users a complete view of the data at a glance. This generative BI experience helps teams ask follow-up questions, dive deeper into trends, and get decision-ready insights during meetings, making business conversations more interactive, efficient, and data-driven.
In this post, we walk through how to use Amazon Q in QuickSight to analyze sales performance using the built-in Product Sales topic, which includes fields like Sales, Profit, Region, Segment, and Order ID. This dataset helps demonstrate how Amazon Q can provide immediate insights into business performance across different regions, customer segments, and categories.
We deploy and explore the solution through the following steps:
- Set up Amazon Q using the built-in
Product Salessample topic in a supported AWS Region. - Ask natural language questions and receive multi-visual, AI- generated insights.
- Refine questions in real-time using follow-ups questions to uncover additional insights.
- Use suggested questions to explore historical trends and performance shifts you might have missed.
- Drill into comparative metrics and understand trends across time, customer segments, and geography for interactive exploration.

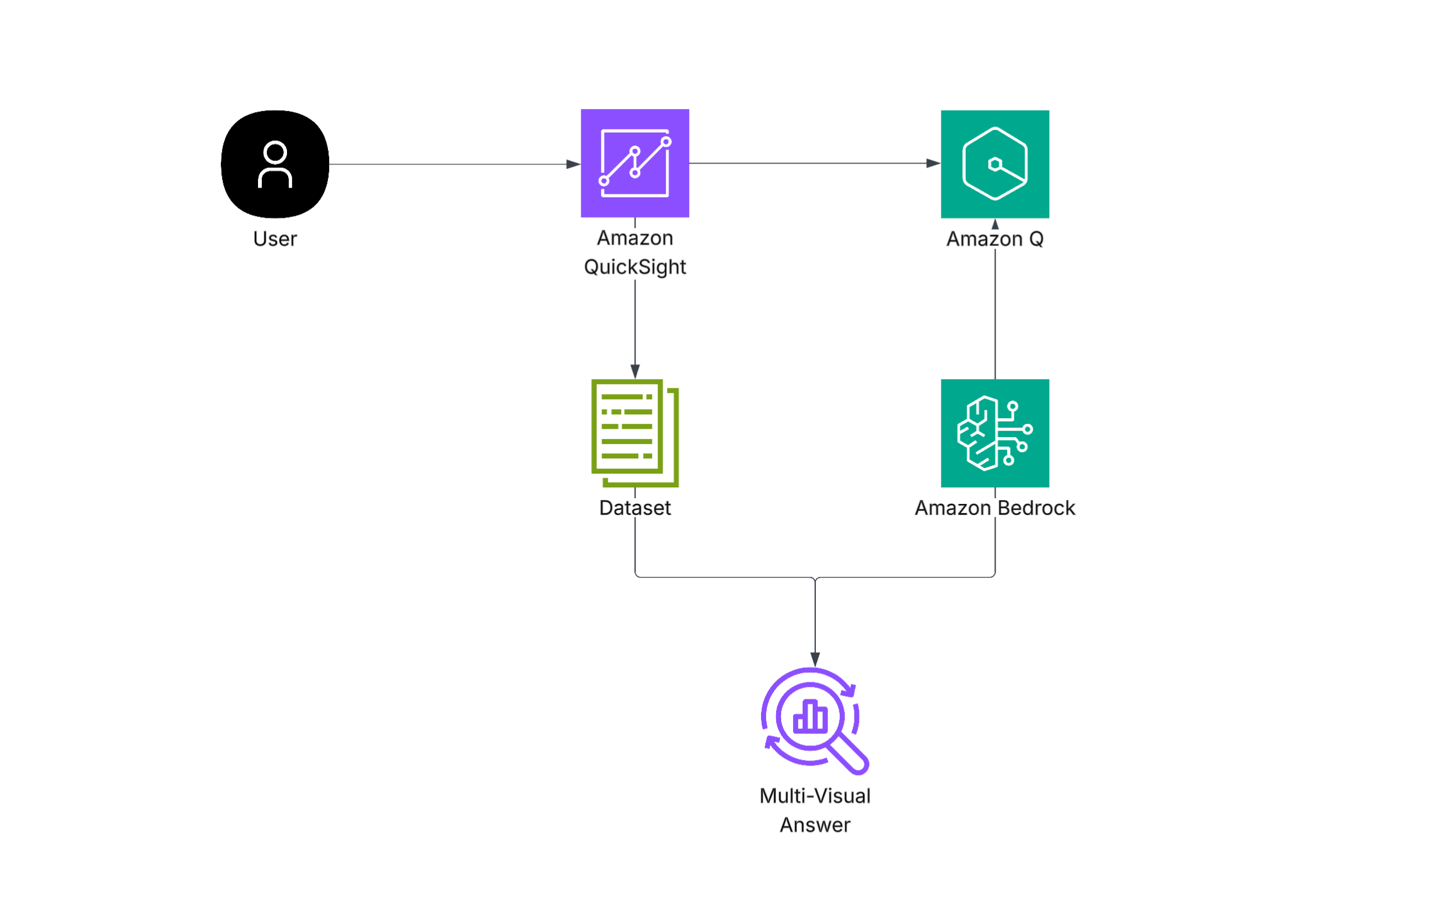
This solution enables business users to ask natural language questions directly in Amazon Q in QuickSight and receive real-time, multi-visual answers, without building dashboards or writing SQL. It combines intuitive BI exploration with foundation model (FM) reasoning through Amazon Bedrock, powering both Amazon Q in QuickSight topics and scenarios in the background.
The process works as follows:
- A user enters a question into the Amazon QuickSight Q interface.
- Amazon Q interprets the question, identifies relevant fields, and queries the dataset.
- If needed, Amazon Q invokes large language models (LLMs) hosted on Amazon Bedrock to support interpretation or scenario simulation.
- The final result — a multi-visual answer — is generated and shown directly in the QuickSight interface to support live business discussions.
The following diagram illustrates this architecture:
Prerequisites
Before starting this step-by-step guide, make sure you have the following in place:
- An active AWS account configured for Admin Pro, Author Pro, or Reader Pro roles in QuickSight
- A QuickSight subscription (for new users, refer to Setting up for Amazon QuickSight.)
- The
Product Salessample topic available on your QuickSight console. - Necessary AWS Identity and Access Management (IAM) roles to allow access to QuickSight and associated datasets.
Make sure to deploy the solution in a supported Region for Amazon Q in QuickSight.
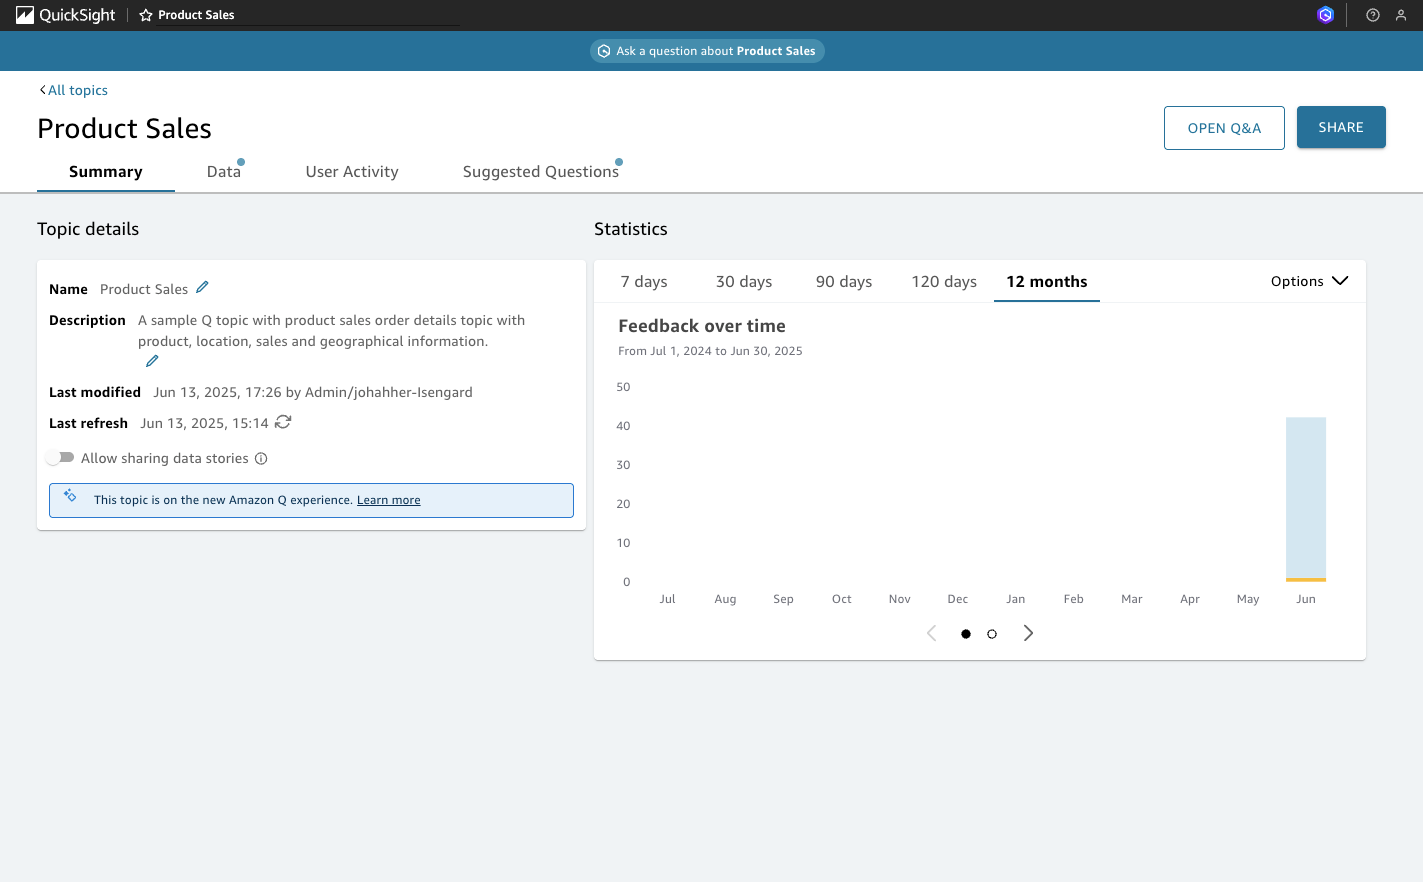
Configure the Amazon Q in QuickSight topic
To use Amazon Q in QuickSight in a sales review meeting, you must first enable the built-in Product Sales topic. Follow these steps:
- Sign in to QuickSight console in a supported Region.
- In the navigation pane, choose Topics.
- Choose New sample topic.
- Rename the topic to
Product Sales(it might default toSoftware Sales). - Verify fields like
Sales,Product,Region, andProfitare included. - Confirm that your account has Q Pro access to enable natural language querying and visual exploration.
The following screenshot shows the configured topic.
Ask a question for immediate insights
During your meeting, start by asking a straightforward business question in natural language to quickly understand performance across key categories. For example: “Show sales and profit by product category.”
Amazon Q in QuickSight immediately generates a multi-visual response, interpreting the query as “Total Sales and total Profit by Product.” The answer includes the following information:
- A summary card noting the total number of unique products, total sales ($2,404,670), and total profit ($294,625)
- A table listing each product and its associated sales value
- A scatter plot visualizing total sales, profit, and quantity by product
- A data panel with recent order details including order date, customer, product, segment, and industry
- A “Did you mean” suggestion to explore profit by industry, showing the service’s conversational awareness
This single natural language question yields multiple, meaningful perspectives on business performance — all on one page.
Refine queries in real time
As the meeting progresses, you can dig deeper into performance trends by refining your original questions or exploring time-based comparisons. This enables your team to analyze changes over time and uncover momentum shifts across product lines or regions. For example: “How did sales change by region last year compared to the year before?”
Amazon Q in QuickSight interprets this as a year-over-year comparison and returns a multi-visual response, including the following information:
- A summary insight explaining that 2021 saw the highest increase in sales ($339,944), while the most recent year experienced a decrease of -$454,383
- A year-over-year KPI card displaying the net difference (-$454,383)
- An area chart showing sales difference over time, from 2021 to 2025
- A line chart visualizing the trend of year-over-year sales difference
- A data table listing the most recent orders by customer, product, segment, and industry
Use suggested questions for deeper insights
In addition to manually entering queries, you can use the suggested questions to explore data more intuitively. These data-driven suggestions use available fields to uncover hidden insights and patterns that users might otherwise overlook, helping them discover valuable information they might not have thought of immediately.
For example, when reviewing your Product Sales sample topic, Amazon Q in QuickSight might suggest the question “How many unique cities by order id?”. This question reveals geographic distribution and order density, which is helpful for assessing industry coverage or fulfillment strategy.
Drill deeper with comparison queries
To analyze performance across customer groups, you can ask comparative questions that reveal how different segments, regions, or products stack up against each other. For example: “Which customer segments had the highest profit ratio?”
Amazon Q in QuickSight interprets this as a profitability comparison and delivers a multi-visual response with the following information:
- Profit by segment bar chart (SMB: $138,000, Strategic: $94,000, and Enterprise: $62,000)
- Total profit KPI ($294,625) and number of segments (three)
- A line chart showing segment profit trends over time
- AI-generated narrative summary, noting key insights such as:
- SMB was the most profitable segment
- 255.87% day-over-day growth on October 12, 2025
- 30.8% month-to-date profit increase for the SMB segment
- An order details table that provides context on recent transactions by customer, product, and industry
This type of query helps surface top-performing customer groups and illustrate when and why they excel, making it ideal for strategic planning discussions.
Clean up
You can clean up the resources that you created to avoid unnecessary charges. Make sure to delete unused datasets and Amazon Q topics after use to avoid ongoing costs.
Conclusion
In this post, we showed how to use Amazon Q in QuickSight to transform business meetings into fast-paced, insight-rich discussions. By asking natural language questions and receiving instant, multi-visual responses, teams can collaborate more effectively, uncover insights in real time, and make confident, data-driven decisions—all without writing SQL or building dashboards.
Amazon Q in QuickSight helps users explore data conversationally, making analytics more accessible, intuitive, and actionable. By incorporating it into your next meeting, you can elevate discussions and make sure decisions are timely and strategic.
To learn more about using Amazon Q in QuickSight, refer to the Using Generative BI with Amazon Q in QuickSight.
About the authors
 Johana Hernandez Herrera is a Solutions Architect based in Arlington, Virginia, with over two years of experience designing and implementing cloud solutions for independent software vendors (ISVs). She helps cloud customers optimize their applications and infrastructure on AWS, with a keen interest in leveraging analytics and business intelligence capabilities.
 Eila Markandey is a Solutions Architect Intern based in Arlington, VA. She is a rising senior studying Data Science at the University of Pittsburgh. She is currently exploring generative AI solutions focused on practical enterprise applications.