AWS Business Intelligence Blog
Transforming B2B intelligence: Tradeshift’s journey with Amazon QuickSight and Amazon Q
| All your trusted BI capabilities of Amazon QuickSight now come with powerful new AI features that integrate chat agents, deep research, and automation in one seamless experience with Amazon Quick Suite! Learn more » |
This is a guest post co-authored by Tradeshift.
Tradeshift is a global leader in e-invoicing and accounts payable (AP) automation, connecting buyers and sellers across 190 countries through a dynamic network with 1.5 million connections, 10 million documents exchanged monthly, and a total historical GMV of $1.4 trillion. Our platform facilitates seamless business operations, with a particular focus on e-invoicing compliance and AI-driven innovations. Our Product and Engineering team, led by a talented group of data engineers and product managers, works to deliver high-impact solutions that enhance user experiences across our network.
In this post, we share how we transformed our analytics capabilities by implementing Amazon QuickSight and Amazon Q to deliver powerful, embedded analytics solutions for both buyers and sellers across our e-invoicing and AP automation platform.
The challenge
Our previous analytics solution, an in-house developed tool called Insight Center, served its purpose but couldn’t keep pace with our growing needs. Though functional, it required extensive resources for maintenance (50% of a full-time employee), while supporting only up to 10,000 rows, 25MB for scheduled reports, and a maximum data history of six months, limiting its ability to handle large-scale data analysis. We needed a solution that could handle vast amounts of data efficiently while providing an intuitive user experience for our diverse user base.
Why QuickSight
After evaluating several alternatives, we chose QuickSight for three primary reasons:
- Its exceptional big data processing capabilities and scalability empower us to handle massive datasets 1M to 100M+ rows while delivering insights in seconds
- The integration of Amazon Q provides an intuitive natural language interface, so users can explore data without technical expertise
- QuickSight offers enhanced flexibility and efficiency in building, managing, and customizing data assets and reports
Solution overview
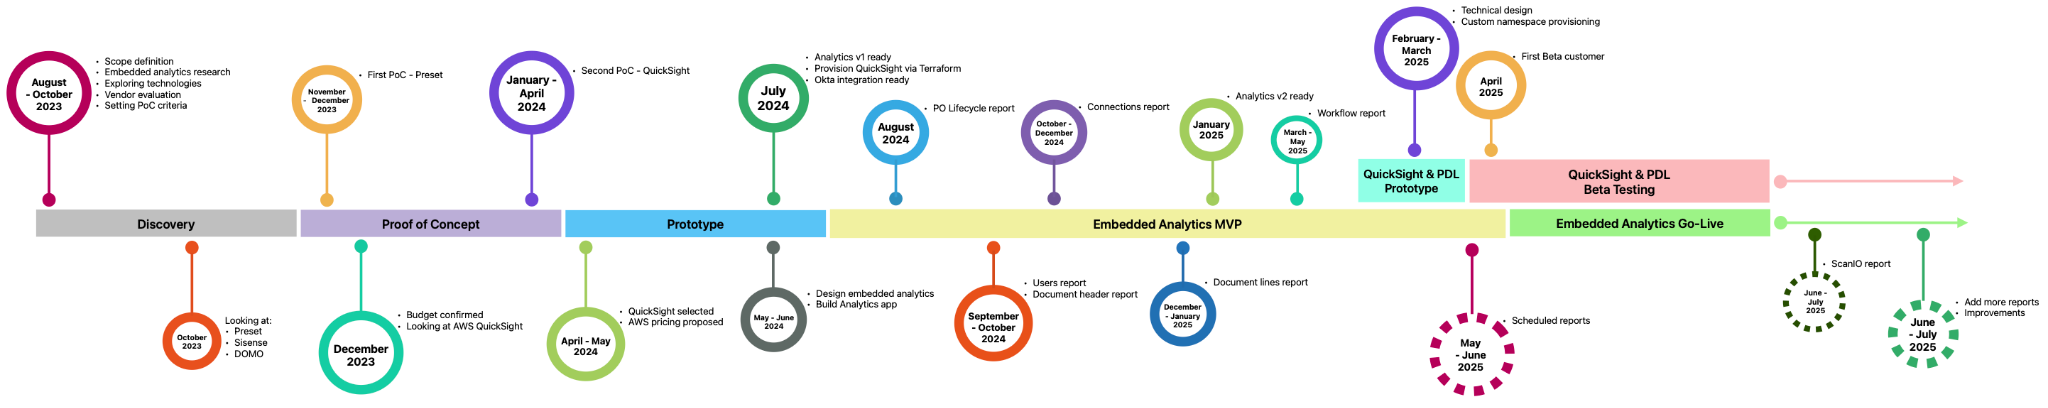
Our deployment strategy focuses on a phased rollout beginning in May 2025. We launched the Payment Predictor Report for approximately 200 eligible sellers, followed by embedded dashboards and reports for 110 enterprise buyer accounts in June 2025. Concurrent with the dashboard rollout, we enabled Amazon Q across all accounts and introduced automated report delivery through the Scheduled Reports feature.
The following figure illustrates our development timeline.
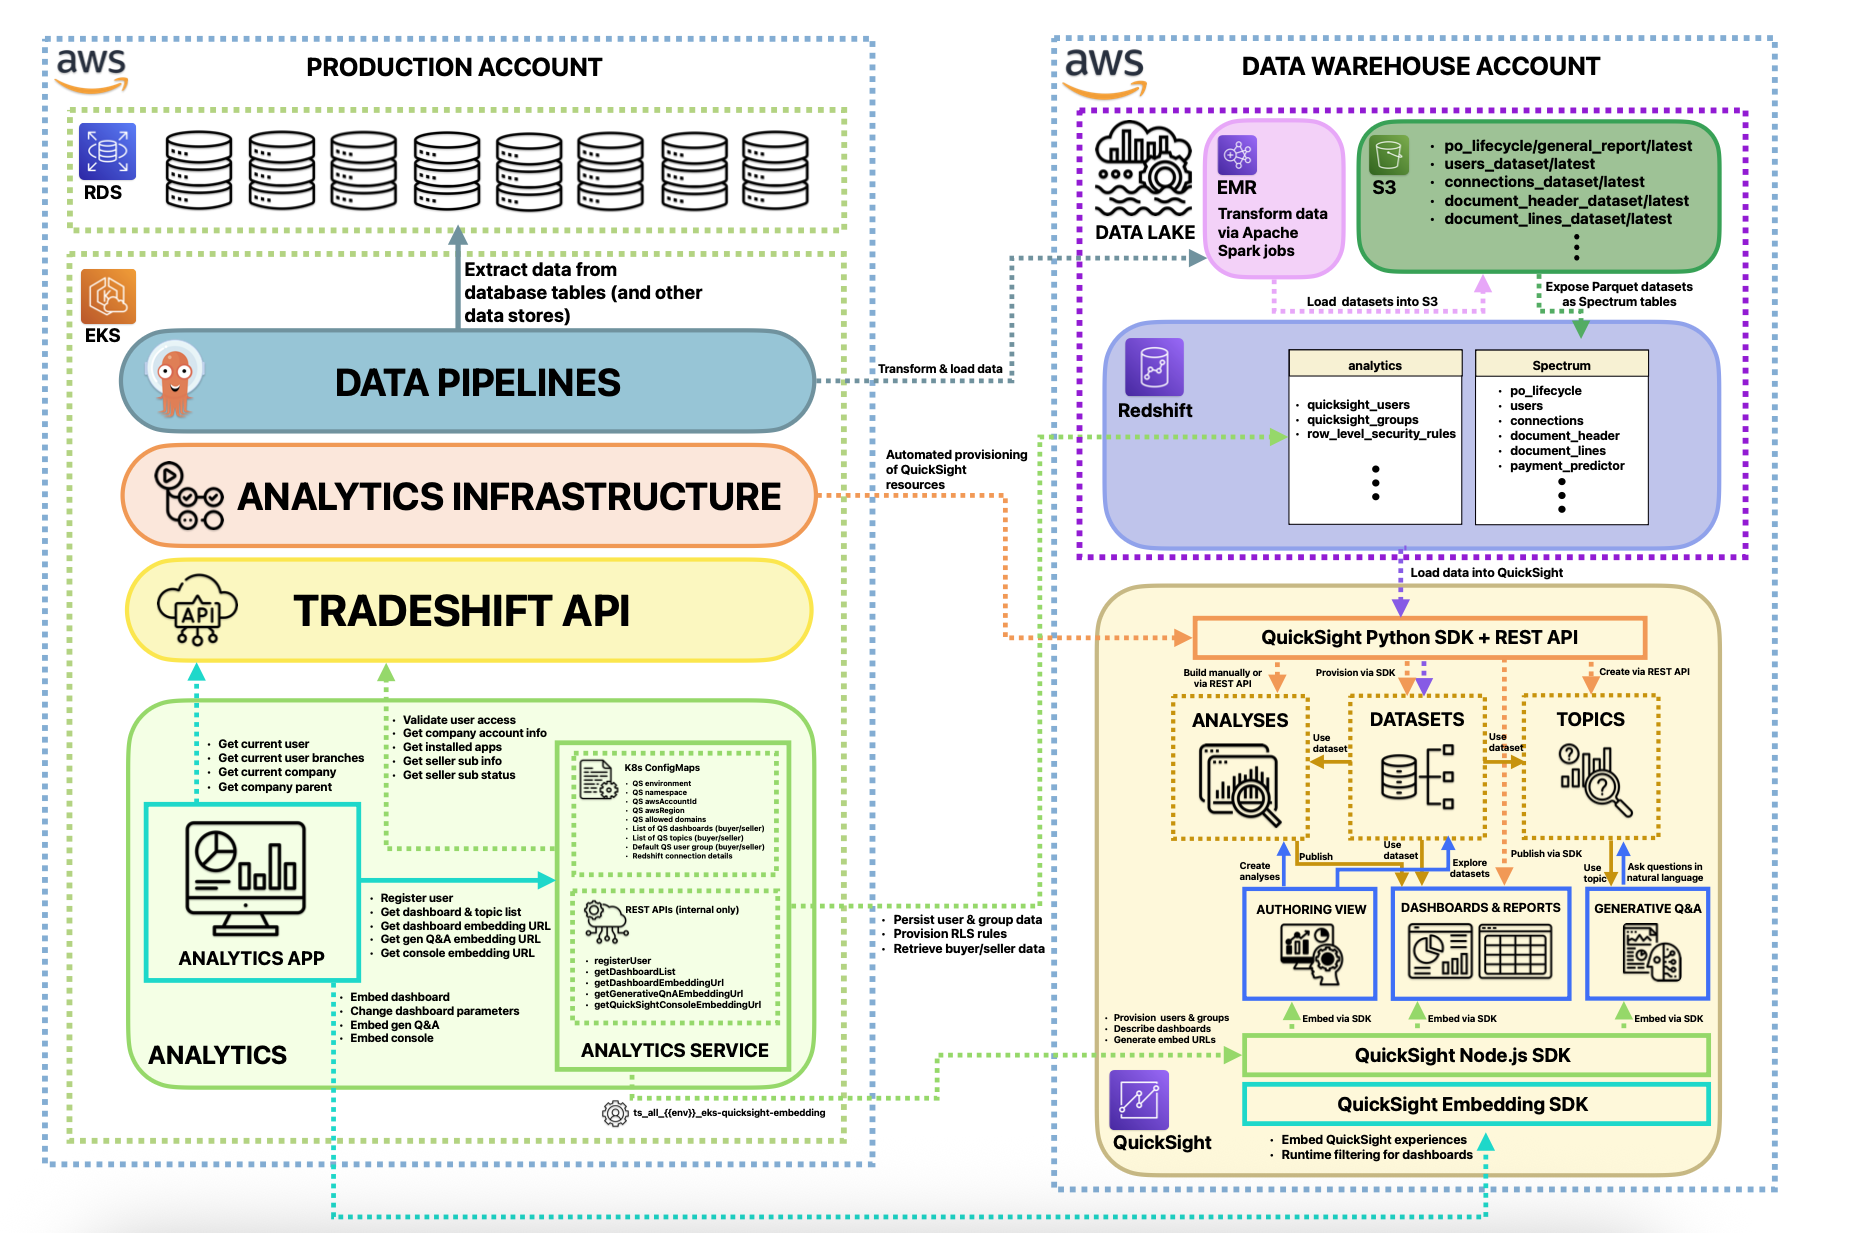
The solution pulls data from our Production PostgreSQL database, with our Data Engineering team providing several standard datasets, including invoice headers, users, invoice lines, and workflow information. Most datasets are refreshed using SPICE (Super-fast, Parallel, In-memory Calculation Engine) for fast, interactive performance, while a few of the largest (exceeding 1 billion rows or 1 TB) leverage Direct Query to ensure up-to-date access. This hybrid approach allows users to work with responsive dashboards and access current data, with refresh speeds tailored to the size and nature of each dataset.
The following diagram illustrates the solution architecture.
Embedded analytics experience
We’ve fully embedded QuickSight within the Tradeshift platform as a dedicated Analytics application, available through our App Store. This integration provides a seamless experience for both buyers and sellers, with access controlled by user permissions. Users can access a curated list of dashboards and reports tailored to their specific roles and business needs, within the familiar Tradeshift UI, through the Analytics app designed to serve both sides of the network, offering sellers a machine learning–powered Payment Predictor report and providing buyers with insights into purchase orders, document-level data, user activity, workflows, and network connections.
In the same space, they can also leverage Amazon Q in QuickSight, a Generative AI feature in QuickSight, to ask questions about the data, making insights more accessible than ever. This innovative capability is one of the ways Tradeshift is pioneering the use of AI to enhance user experience and decision-making.
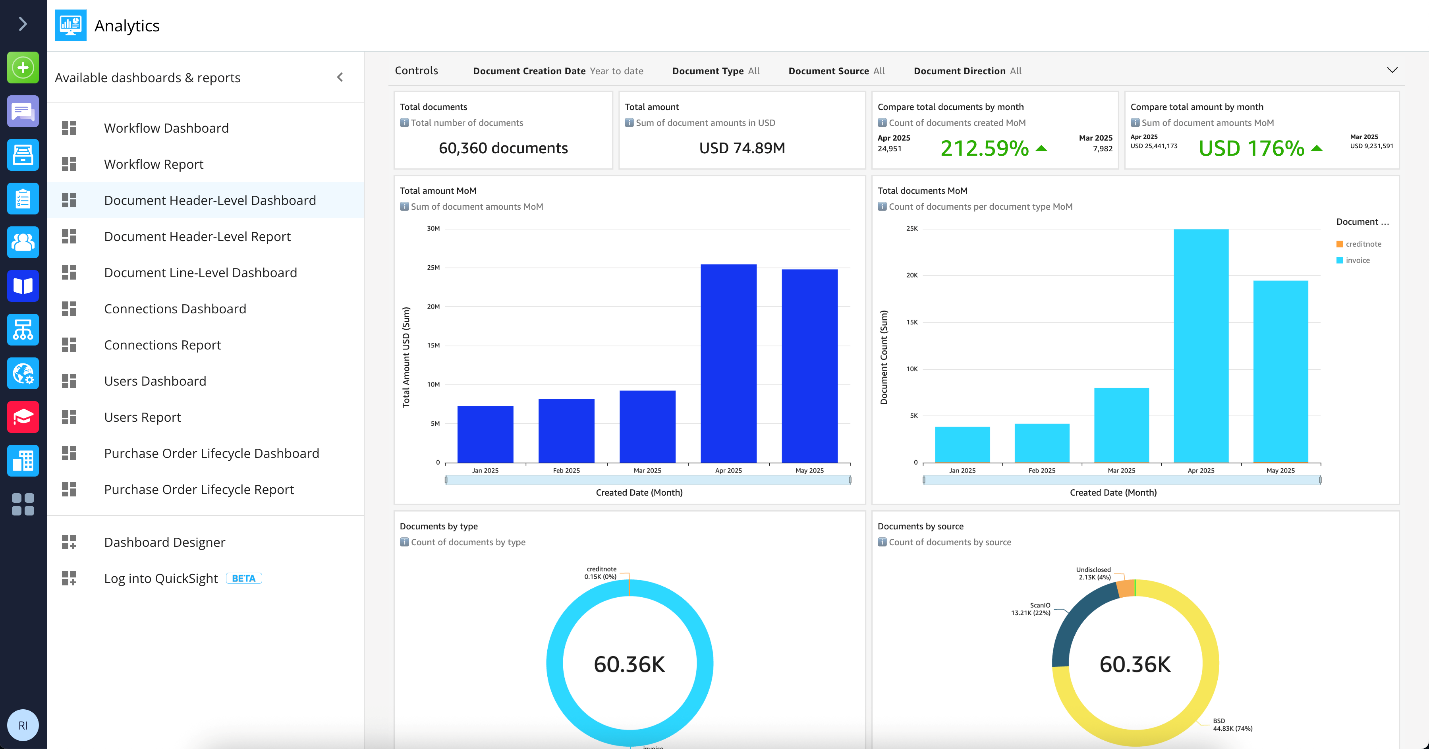
The following screenshot shows reports embedded on the Tradeshift platform with a view on the buyer side.
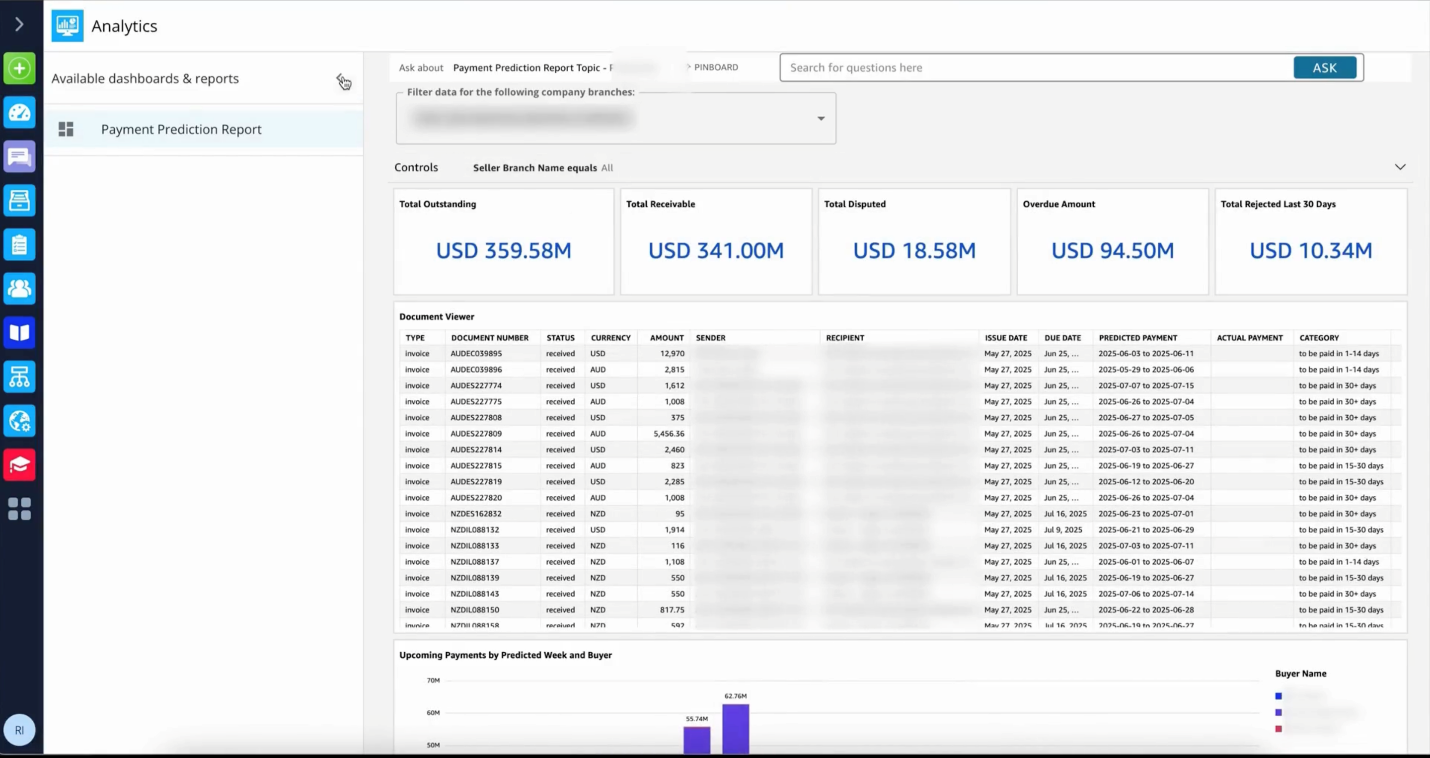
The following screenshot shows a report embedded on the Tradeshift platform with a view on the seller side.
Impact and benefits
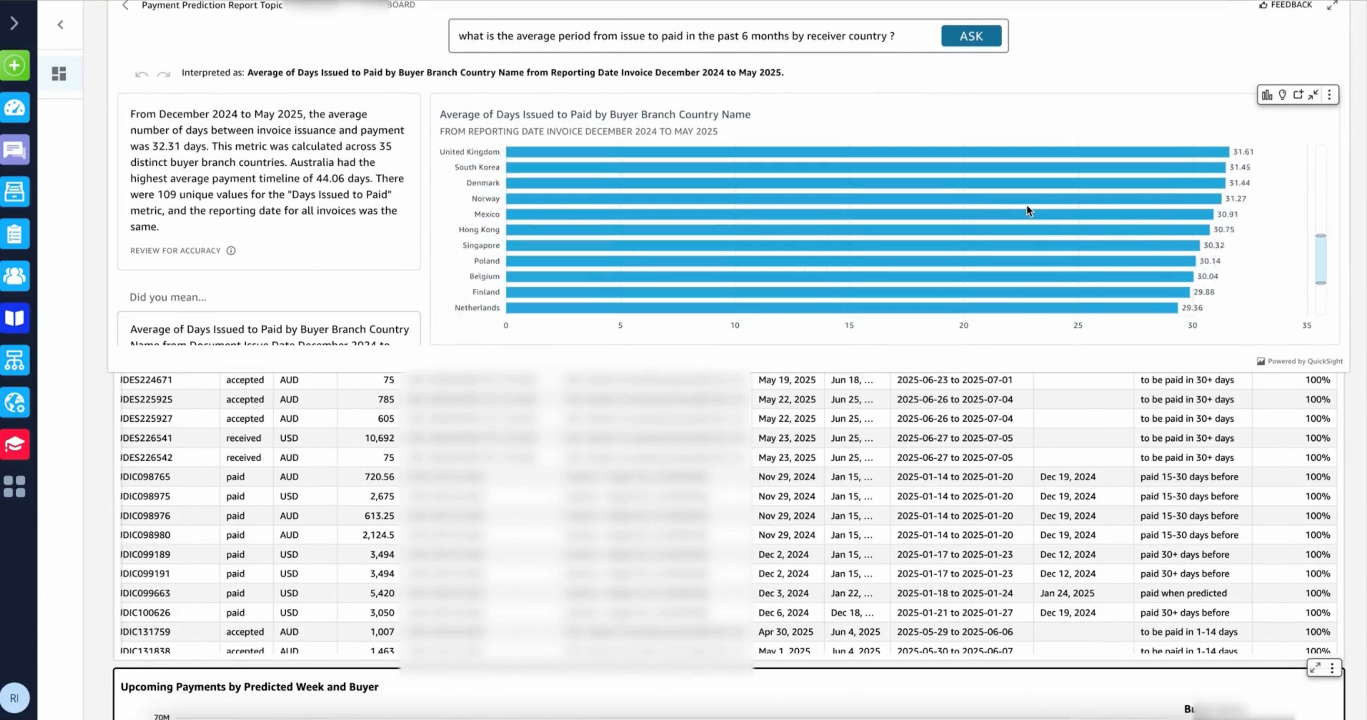
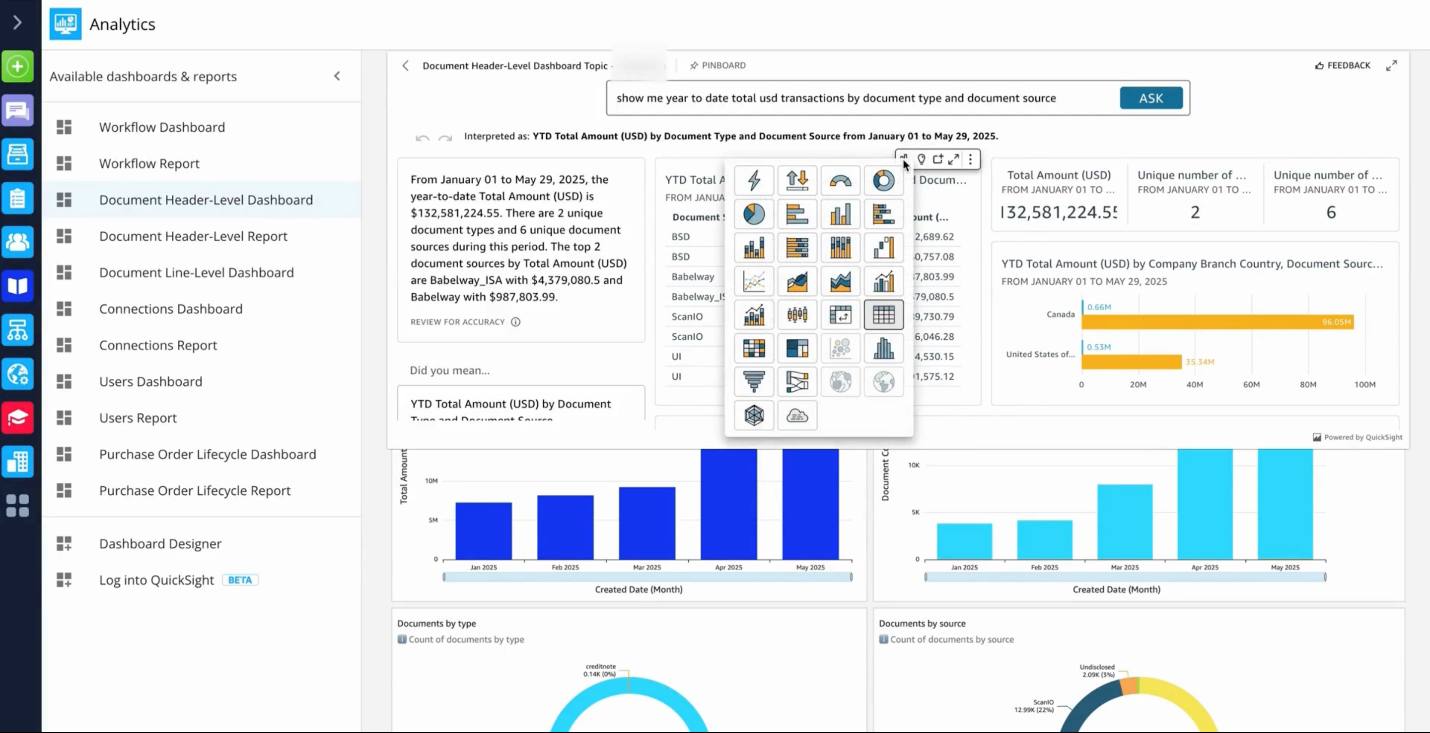
Our analytics solution serves both sides of our network effectively and is built to handle massive datasets ranging from 1 million to over 100 million rows. Buyers gain comprehensive insights into purchase orders, document-level analytics, user activity, workflow, and network connections, while sellers benefit from innovative features like the Payment Predictor Report, which leverages machine learning to forecast payment dates based on historical patterns.The integration of Amazon Q has delivered remarkable results. Users can now explore data through natural language questions directly within the Analytics application, democratizing data access across organizations regardless of technical expertise. This capability has fundamentally changed how our users interact with their data, making advanced insights accessible to everyone. Sellers can explore payment trends by asking questions like, “What is the average time from invoice issue to payment over the past six months, broken down by receiving country?” Meanwhile, buyers can gain insights into their transaction volumes with queries such as, “Show me the year-to-date total USD transactions, grouped by document type and source.”
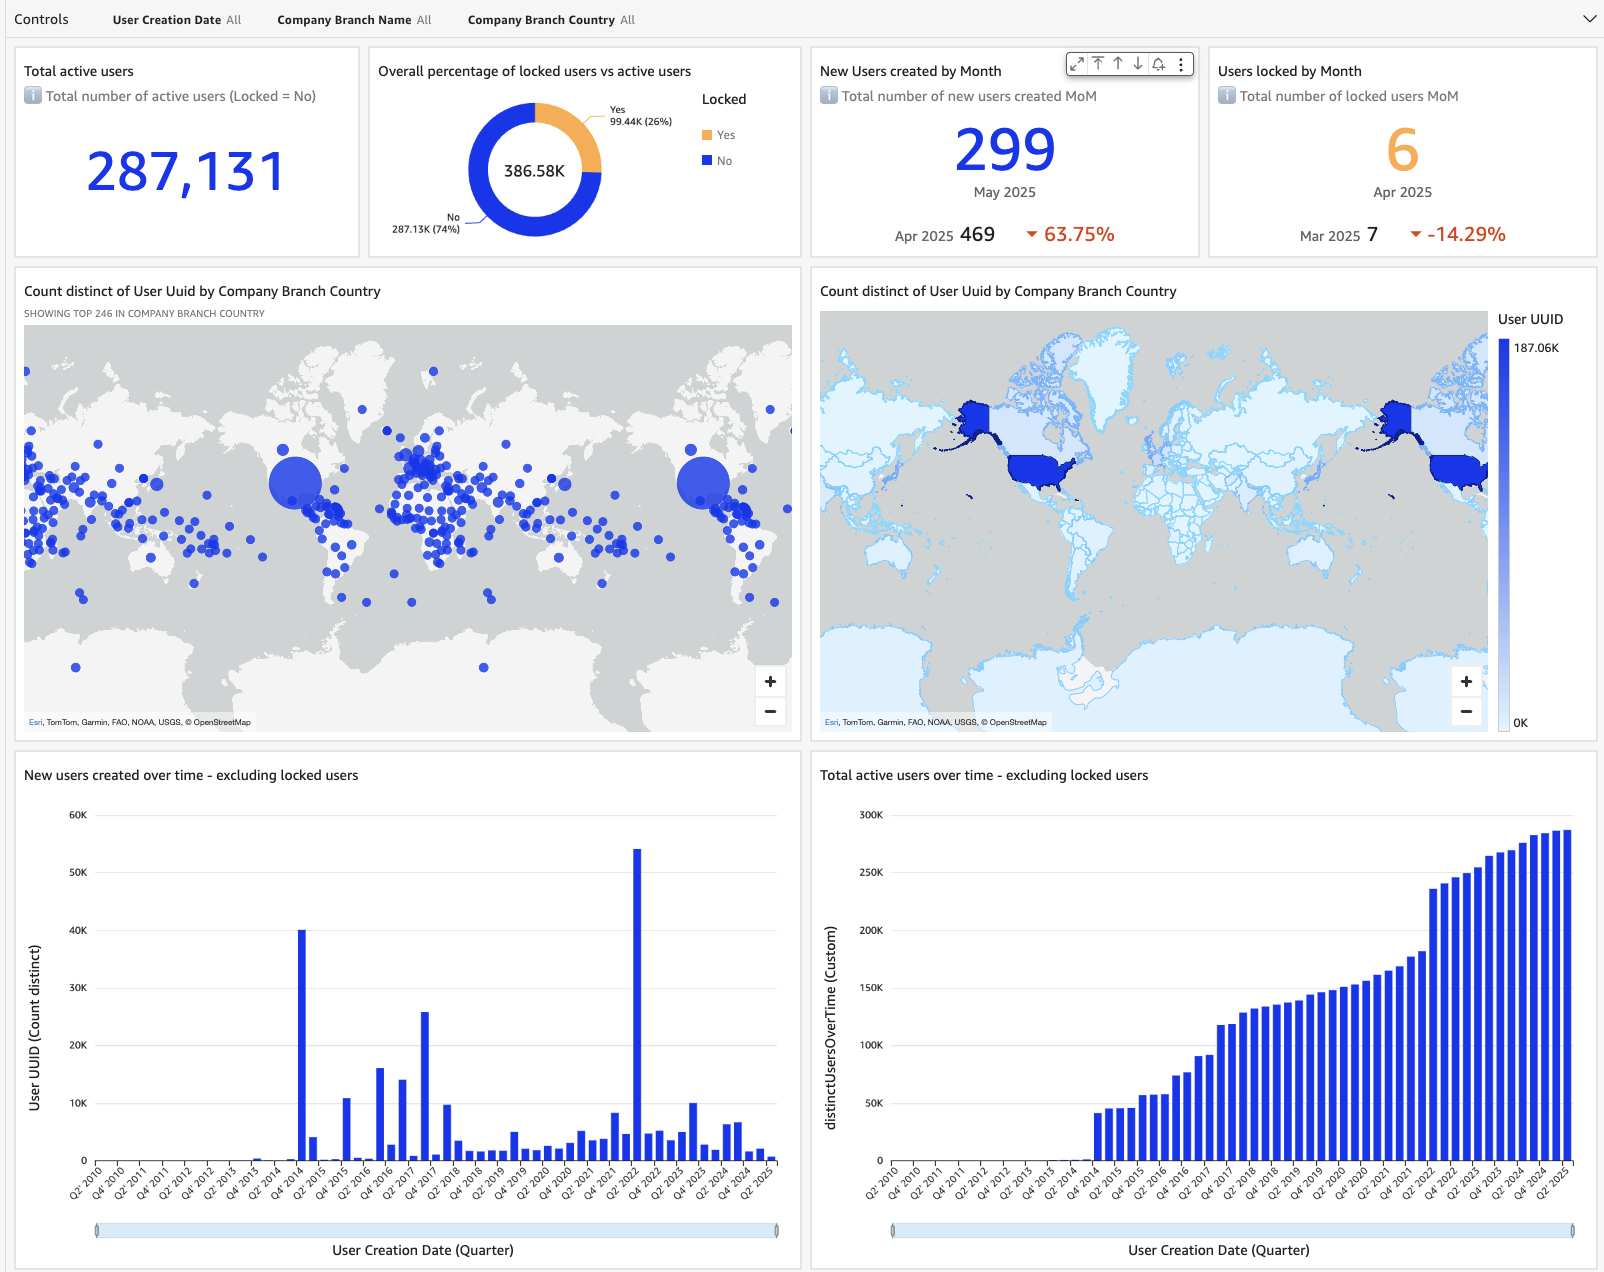
The following screenshot shows a dashboard with a focus on Tradeshift platform user-related metrics.
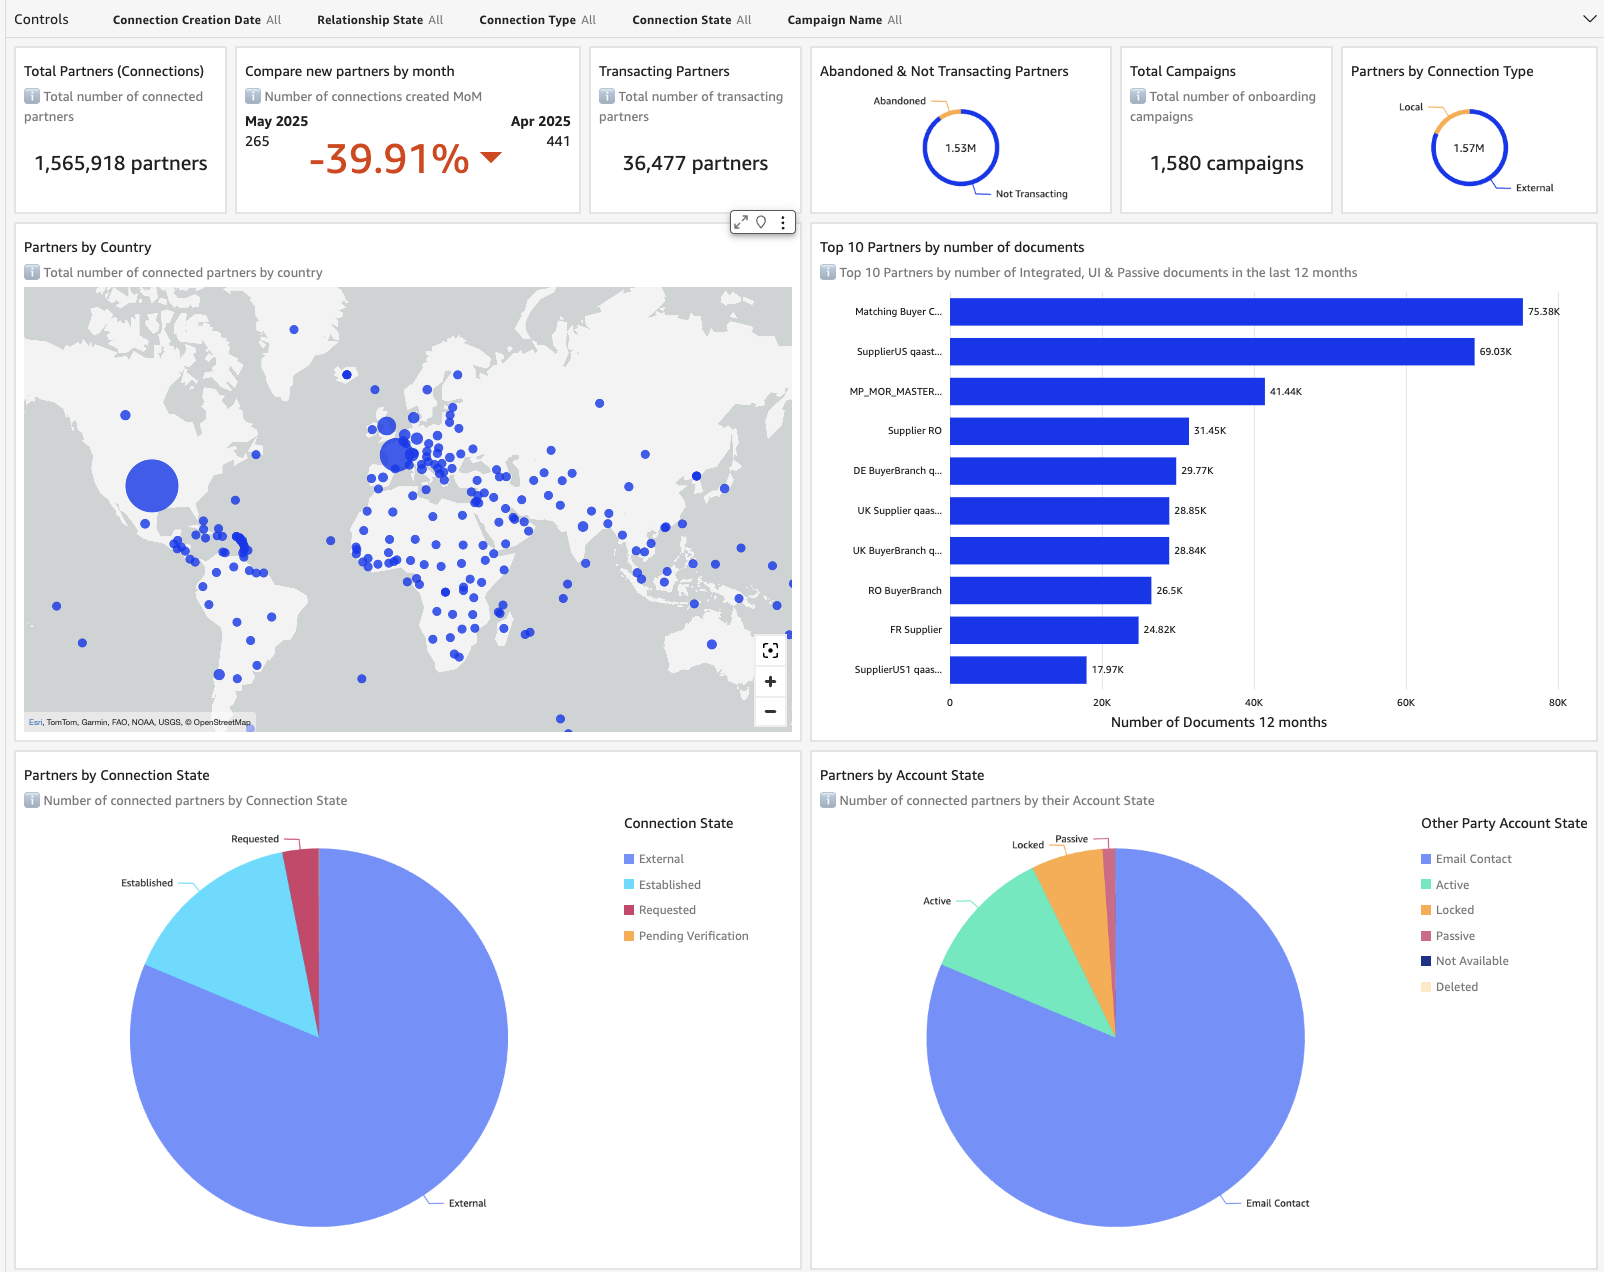
The following screenshot shows a dashboard with a focus on platform connections (buyers and sellers) and onboarding-related metrics.
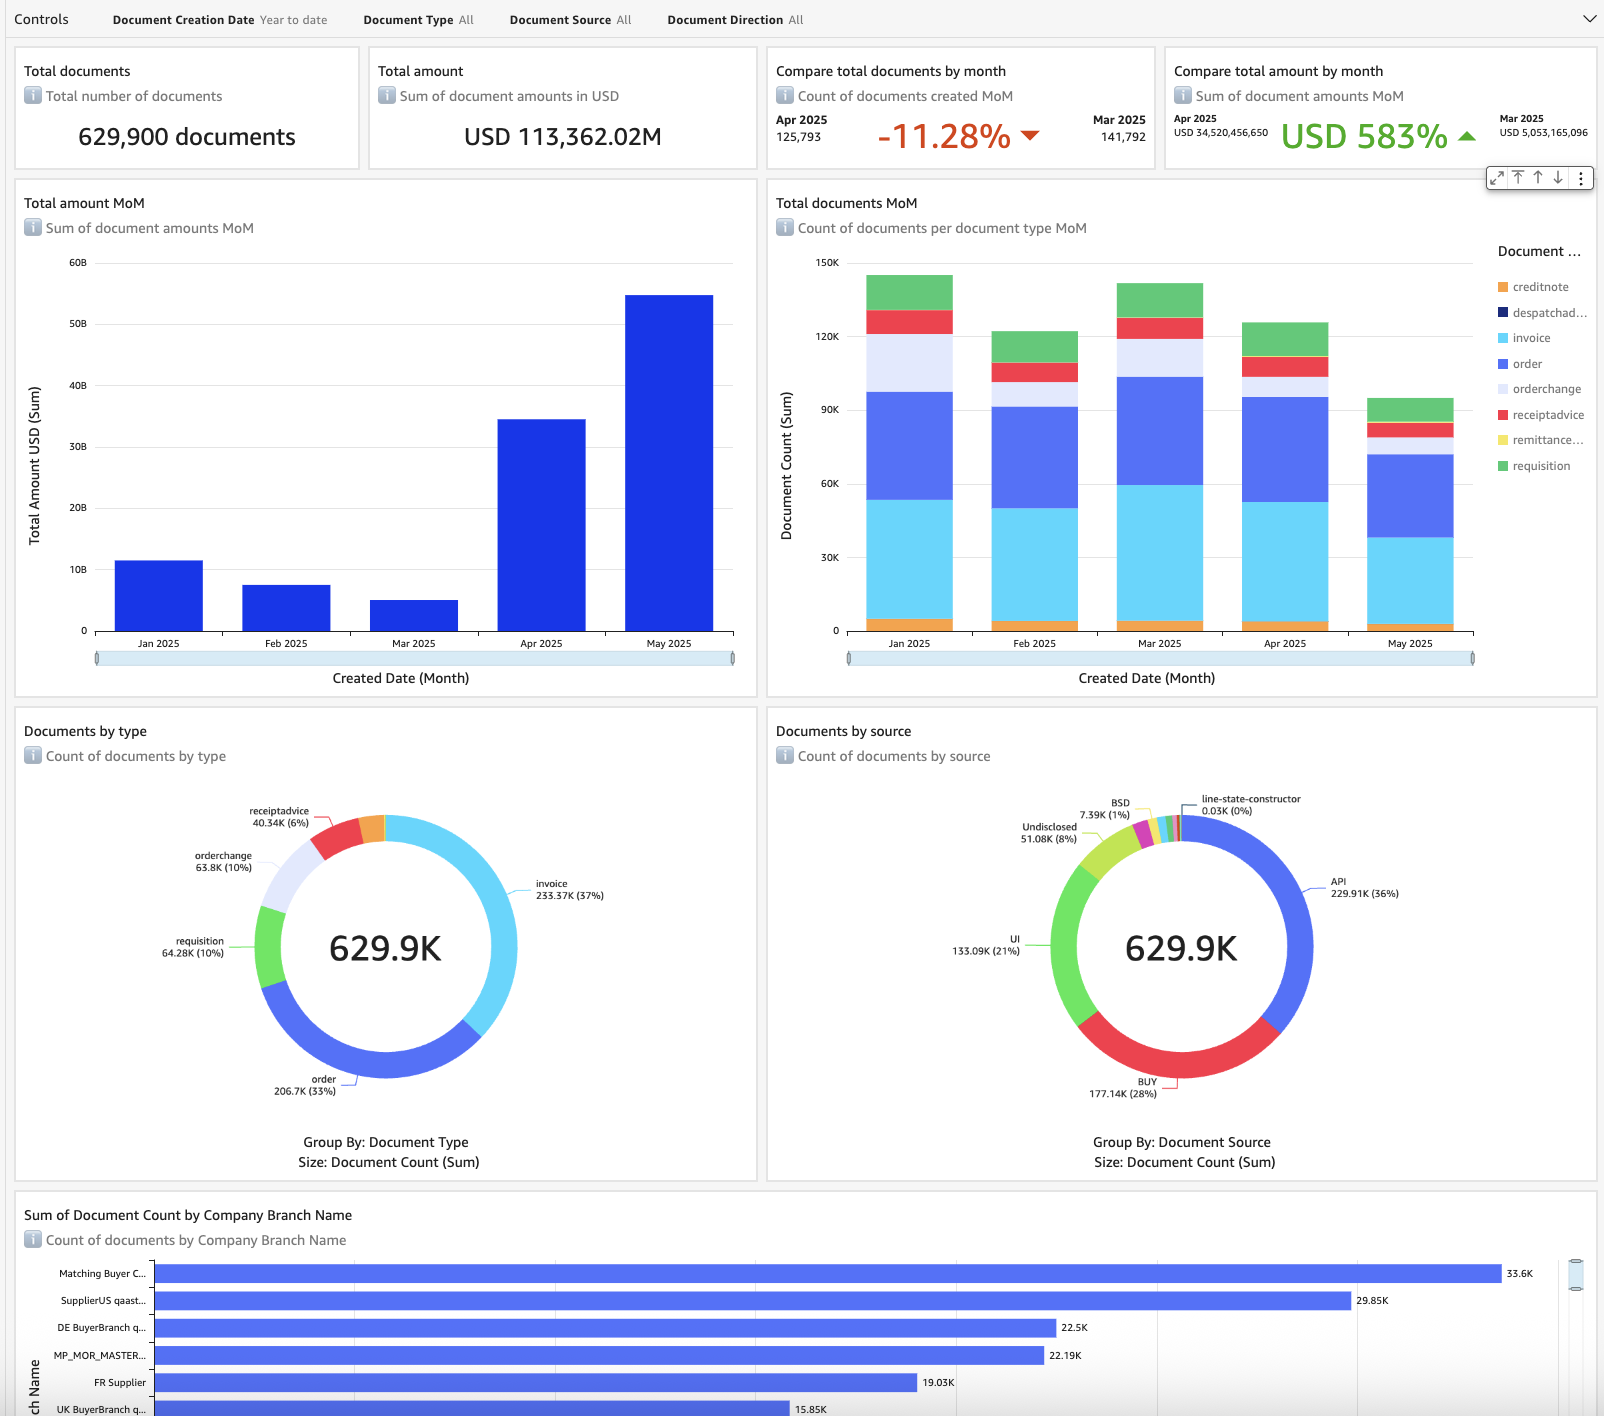
The following screenshot shows a dashboard with a focus on Tradeshift documents (all types of documents and total or aggregated amounts).
The following screenshot shows an example of Q functionality for Sellers.
The following screenshot shows an example of Q functionality for Buyers.
Although we’re still in the early stages of our full rollout, we anticipate measuring success through various metrics, including increased adoption of analytics features, improved customer satisfaction, and stronger retention rates. The solution has already demonstrated its value in reducing dependency on engineering resources and improving the overall user experience.
Looking ahead
Our journey with QuickSight is just beginning. Following our June 17 launch, we plan to expand our dashboard and report offerings, making sure they deliver meaningful insights for both buyers and sellers. Our vision is to make data-driven decision-making an integral part of daily operations across the Tradeshift network.The integration of Amazon Q represents a significant step forward in democratizing data access. By enabling natural language queries, we’re making advanced analytics accessible to users regardless of their technical expertise. This combination of powerful analytics and user-friendly interfaces positions us well for future growth and innovation in the B2B commerce space.
Conclusion
The implementation of QuickSight and Amazon Q has transformed how we deliver analytics to our users. By combining robust data processing capabilities with intuitive UIs and embedded functionality, we’ve created a solution that truly serves the diverse needs of our network. As we continue to expand and enhance our analytics offerings, QuickSight will remain a cornerstone of our strategy to deliver value to both buyers and sellers across the Tradeshift platform.
Ready to revolutionize your analytics experience? Discover how QuickSight and Amazon Q can enhance your business intelligence with powerful embedded analytics and streamlined data processing. Schedule a demo today to see how AWS solutions can transform your organization’s data insights. Visit Amazon QuickSight to begin your analytics journey and join leading businesses already benefiting from the capabilities of QuickSight.
About the authors
 Raphael Bres is the Chief Product & Technology Officer at Tradeshift, where he leads strategic product innovation and technological transformation across the company’s suite of B2B ecommerce and fintech solutions. With over 25 years of experience in enterprise financial applications and B2B SaaS, Bres has held senior leadership roles at companies including Oracle, Microsoft, Workday, and Certinia, and previously served as Chief Product Officer at Tradeshift before rejoining the company in 2024 after a 2-year tenure at Spiff, which was acquired by Salesforce in December 2023.
 Adina Iordache is a Senior Engineering Manager at Tradeshift, where she has led software development teams since 2017, focusing on people management, project planning, and technical design. Her most recent role is leading the Data and Analytics team, working to improve the user experience for customers through powerful, insight-driven analytics.
 Anca Andone is the Senior Product Manager for Data and Analytics at Tradeshift. She is focused on supporting the strategic growth in AI and innovation areas and on integrating AI tools for operational excellence.
 Ioana Ploesteanu is the Senior Product Marketing Manager at Tradeshift. As part of the Product team, Ioana works at the intersection of product, marketing, and engineering to shape the positioning and user engagement strategy for AI-powered functionalities, e-invoicing compliance, and B2B integration solutions. She drives global alignment across teams, supports product development with market insights, and leads strategic initiatives to boost adoption and visibility.