AWS Business Intelligence Blog
Deliver Amazon QuickSight pixel-perfect reports to multiple customer groups
| All your trusted BI capabilities of Amazon QuickSight now come with powerful new AI features that integrate chat agents, deep research, and automation in one seamless experience with Amazon Quick Suite! Learn more » |
Amazon QuickSight is a fully managed, cloud-based business intelligence (BI) service that makes it straightforward to create and share data visualizations, perform analysis, and quickly get business insights from your data. As a serverless platform, QuickSight automatically scales to tens of thousands of users without requiring infrastructure management. This helps organizations connect to a wide variety of data sources, including AWS services like Amazon Redshift and Amazon Simple Storage Service (Amazon S3) and third-party databases and applications. You can create interactive dashboards, embed analytics into your applications, and share insights through pixel-perfect reports with both internal teams and external stakeholders. With built-in machine learning (ML) capabilities through Amazon Q in QuickSight, you can also use natural language querying to explore your data.
The QuickSight pixel-perfect reports feature helps organizations create, schedule, and share highly formatted business documents at scale. You can design and distribute personalized reports containing business-critical data to hundreds of thousands of end-users—all without infrastructure setup, maintenance overhead, up-front licensing, or long-term commitments. When combined with the robust security features of QuickSight, organizations can efficiently manage multi-tenant reporting needs by delivering personalized pixel-perfect reports to different user groups with varying data access levels, all using a single dashboard and schedule.
In this post, we show how to set up and schedule QuickSight pixel-perfect reports with row-level security for multiple customer groups.
Use case overview
AnyCompany is a global provider of business process outsourcing and customer data management services across various industries. The organization handles millions of transactions daily, including consumer sales promotions, customer service interactions, and payments through their global facilities. They provide comprehensive services to multiple brands, encompassing marketing, order management, order fulfillment, payment processing, and document presentment services.
The company’s current reporting infrastructure requires developers to create separate schedules for each customer’s permission set. With 50 customers averaging four different permission levels each, this approach has resulted in managing hundreds of individual schedules, each requiring specific filters to deliver the same report format with customer-specific data.
To streamline their reporting process, AnyCompany aims to implement an enterprise solution that can broadcast personalized reports to all customers while maintaining data segregation. Their goal is to simplify this complex scheduling environment with a single dashboard and schedule configuration. AnyCompany currently uses Amazon Redshift as their enterprise data warehouse platform and QuickSight as their BI solution.
AnyCompany seeks to optimize their reporting infrastructure with the following key requirements:
- It’s straightforward to build and maintain with a single dashboard or schedule to cater to each of its customers’ permission sets.
- They can restrict the number of schedules created and make sure all end-users across customers receive the same report containing data specific to their entitlement. This maintains data security and access controls at the customer level and reduces operational overhead in report management and distribution.
This solution can enable rapid implementation and adoption, taking advantage of their team’s familiarity with the existing QuickSight environment. This post goes through the steps AnyCompany took to enable this functionality using pixel-perfect reports of QuickSight with entitlements delivered using QuickSight functionalities.
Solution overview
This solution uses the following AWS services:
- Amazon Redshift – A data warehouse that stores fact and dimension datasets related to business process outsourcing
- Amazon QuickSight – A BI service that delivers pixel-perfect paginated reports, implementing row-level security for data access control
Although this solution uses Amazon Redshift as the data store, a similar approach can be implemented with other databases or data sources.
The following diagram shows the workflow to deliver reports by email using QuickSight.
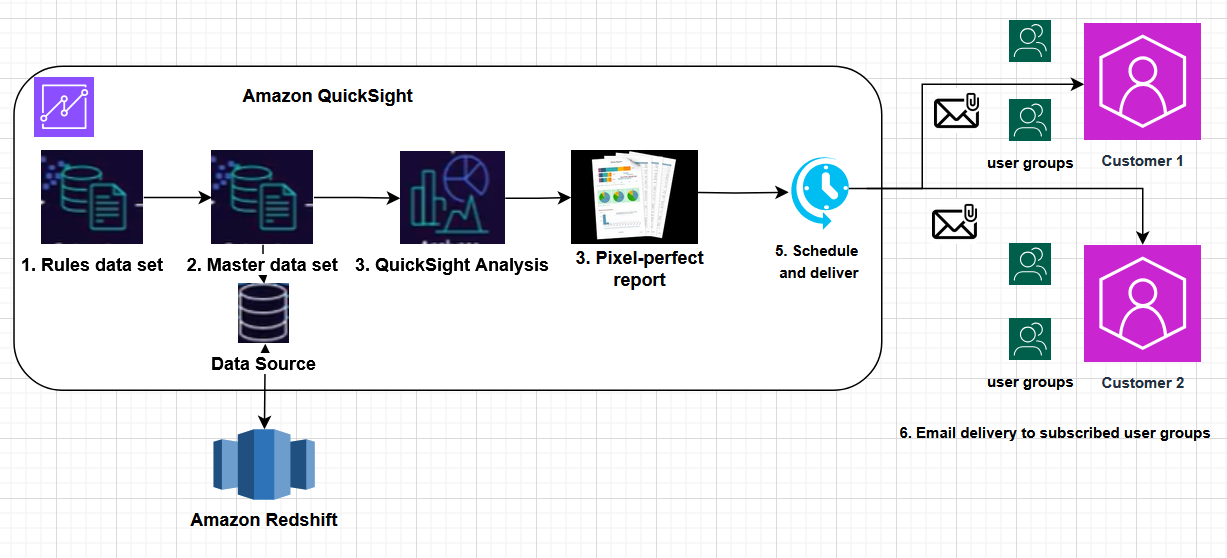
The workflow consists of the following steps:
- The solution begins with creating a rules dataset that contains the columns, starting with group Amazon Resource Name (ARN) or group name, followed by columns that are used to filter the data for each customer and groups within the customer.
- This rules dataset is attached to the primary dataset used for reporting.
- The QuickSight author uses the primary dataset to create an analysis.
- One of the sheets in the analysis is a pixel-perfect report.
- This dashboard is shared with groups across customers to whom the report needs to be published. The QuickSight author creates a schedule for the pixel-perfect report and assigns the schedule to required groups across customers.
- This report is delivered by email to all users who have access the report based on their row-level permissions.
In the following sections, we walk through the steps to deploy the solution.
Prerequisites
To implement this solution, you must have the following resources:
- An AWS account with QuickSight Enterprise Edition and pixel-perfect report subscription
- QuickSight administrator privileges to enable pixel-perfect reporting and create groups
- A Redshift cluster or preferred data store with sample data
- QuickSight groups configured for each customer
Create a rules dataset for row-level security
We create a rules dataset using a CSV file containing the following columns: GroupArn, Customer_ID, Country, and Industry. GroupArn is the unique identifier of a QuickSight group that needs to be assigned required access. Customer_ID, Country, and Industry are columns that exist in the primary dataset used by QuickSight.
We use the rules dataset to enable row-level security. For more details, see Using row-level security with user-based rules to restrict access to a dataset.
To create the rules dataset, complete the following steps:
- Sign in to the QuickSight console.
- Choose Datasets in the navigation pane.
- Choose New rules dataset.
- Upload the CSV file with the following structure. This could also be a database table.
The following table contains sample records in the row-level security dataset.
| GroupArn | Customer_id | Country | Industry |
| arn:aws:quicksight:us-east-1:111111111111:group/default/customer_1_group_1 | 1 | Argentina | Energy |
| arn:aws:quicksight:us-east-1:111111111111:group/default/customer_1_all_access | 1 | ||
| arn:aws:quicksight:us-east-1:111111111111:group/default/customer_2_group_1 | 2 | US | Communications |
| arn:aws:quicksight:us-east-1:111111111111:group/default/customer_2_all_access | 2 |
In the preceding example, each row in the dataset defines specific access permissions:
- Row 1 –Restricts data for country Argentina, industry Energy, and customer ID 1 for customer 1, group 1
- Row 2 –Provides all data for customer ID 1 for customer 1’s group with all access
- Row 3 –Restricts data for country US, industry Communications, and customer ID 2 for customer 2, group 1
- Row 4 –Provides all data for customer ID 2 for customer 2’s group with all access
Create a primary dataset in Amazon Redshift
This is the primary dataset from Amazon Redshift or your preferred data source used by QuickSight as the source for the analysis. We enable row-level security for this dataset by assigning the rules dataset. For demonstration purposes, this dataset currently has Customer_ID, Country, Industry, and Sales columns.
To set up row-level security, complete the following steps:
- On the QuickSight console, choose Datasets in the navigation pane.
- Open the primary dataset.
- In the Summary section, choose Row-level-security and Edit.
- Turn on user-based rules, attach the rules dataset, and choose Apply rules dataset.
Create a QuickSight analysis
To create a QuickSight analysis using the sample dataset, complete the following steps:
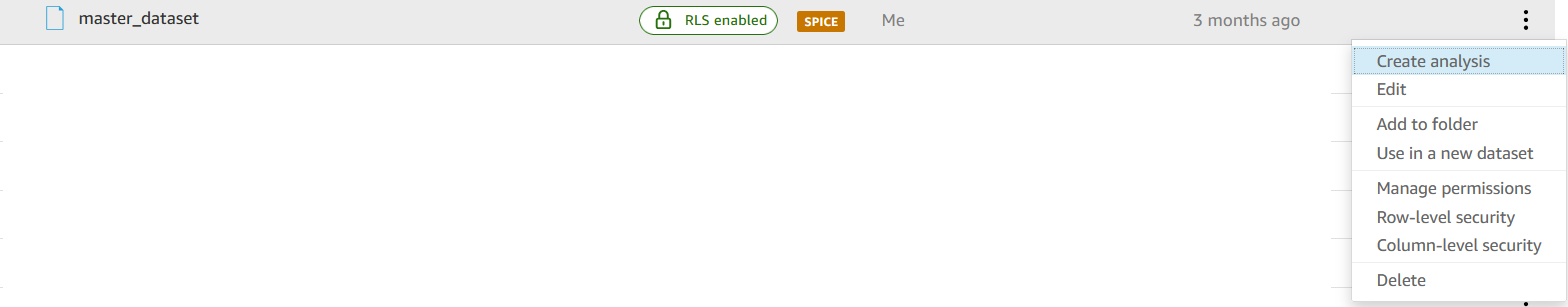
- On the QuickSight console, open the primary dataset.
- On the options menu (three vertical dots), choose Create analysis.
Create a pixel-perfect report sheet in the analysis
To create a pixel-perfect report sheet in the analysis, complete the following steps:
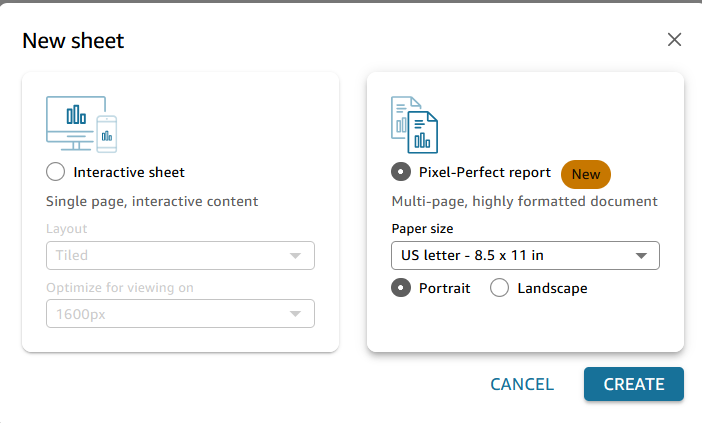
- For New sheet, select Pixel-Perfect report, then choose Create.
- Create a table visual using Country, Industry and Customer_id as columns and Sales as the value with an aggregation of sum.
- Specify KPI, bar, and donut charts to create a section with four visuals.
- Repeat these steps using Country and Industry for the “Total Sales” and “Sale Details” visuals.

Now you can publish the dashboard and share it with your user groups.
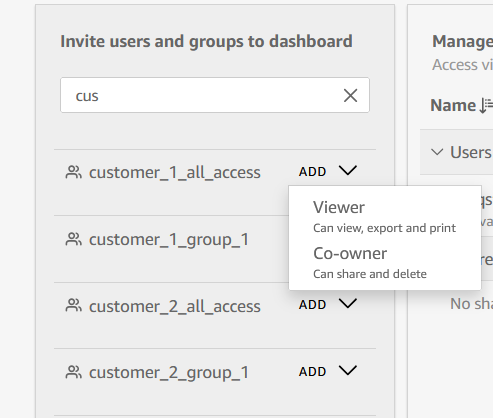
- On the top right of dashboard, choose the share icon.
- Search for the group name under Invite users and groups to dashboard.
- Next to the group name, choose Add and then choose Viewer.
Set up scheduling and delivery
To set up scheduling and delivery, complete the following steps:
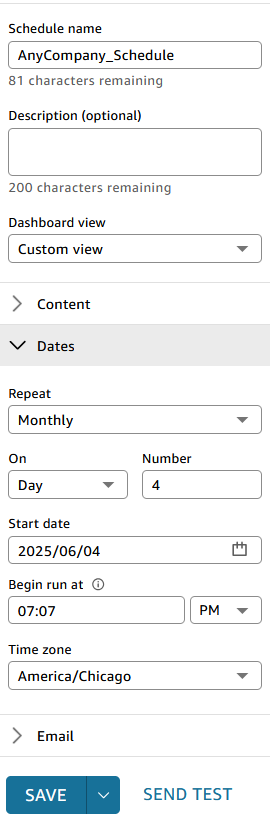
- Create a schedule by choosing the pixel-perfect sheet in the dashboard with content type as PDF.
- Under Dates, enter an appropriate scheduling frequency.
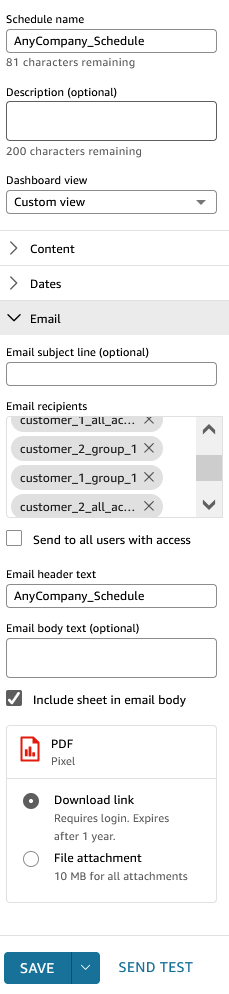
- Under Email, add the four groups that were provided access to the dashboard as email recipients.
- Choose Save.
Deliver emails to subscribed user groups
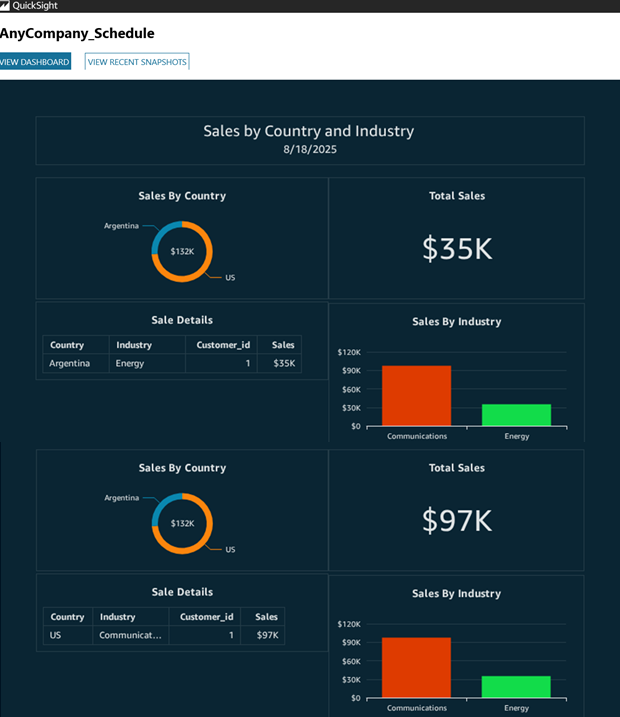
Each of the users in the groups will receive an email with a link to the dashboard as well as an attachment. Users will view data only specific to the customer ID and restrictions based on the row-level security.
In this example, we sent an email to a user with access to customer 1, Country column access set to All, and Industry column access set to All. A link to the report is also provided with the View dashboard option, as shown in the following screenshot.
Clean up
To avoid ongoing charges, delete the following resources if you no longer need them:
- QuickSight schedules, dashboards, and analysis
- QuickSight primary dataset and rules dataset
- QuickSight users and groups
- Sample data from Amazon Redshift
Conclusion
This post showed to transform a complex reporting process into a streamlined operation. By implementing a single dashboard with pixel-perfect reports and row-level security controls, you can alleviate the need for multiple schedules while providing secure, personalized report delivery across your diverse customer base. This approach can significantly reduce operational overhead and simplify report management while maintaining strict data access controls for each user group.
Try out the solution for your own use case, and share your feedback in the comments.
About the authors
 Vaidy Janardhanam is a Solutions Architect at AWS, focusing on generative business intelligence. Vaidy works with customers to help them design and build data and analytics applications in the cloud. He has accelerated the path to production for customers across the globe using AWS services.