AWS Business Intelligence Blog
Amazon QuickSight BIOps – Part 1: A no-code guide to version control and collaboration
| All your trusted BI capabilities of Amazon QuickSight now come with powerful new AI features that integrate chat agents, deep research, and automation in one seamless experience with Amazon Quick Suite! Learn more » |
As business intelligence (BI) teams grow, managing dashboards, datasets, and analyses becomes increasingly complex. Collaboration without clear version control can lead to overwritten work, inconsistent reporting, and production errors. Business stakeholders demand rapid insights, but BI authors often lack tools to safely iterate and deploy changes with confidence.
Business intelligence operations (BIOps), inspired by DevOps principles, introduces version control and collaborative development to BI processes. This post demonstrates how to implement BIOps using the no-code console features of Amazon QuickSight. We show how to version dashboards, reuse visuals, collaborate in parallel, and safely deploy updates—all through the QuickSight UI. Our framework helps teams streamline administration and reduce manual work using the QuickSight built-in version control tools. This code-free approach can help both BI analysts and dashboard creators adopt these practices immediately.
QuickSight fundamentals
This section introduces the fundamentals of business intelligence operations (BIOps) in Amazon QuickSight. We examine three key areas: how QuickSight assets are categorized, the underlying permission model, and essential BIOps principles that guide our operations.
Asset categorization
QuickSight organizes assets into four categories, each serving a specific purpose in the BI workflow:
- Main assets – These are the core building blocks and are visible as standalone objects on the QuickSight console. These assets are interdependent. For example, an analysis depends on datasets, which in turn depend on data sources.
- Data sources connect to systems like Amazon Redshift, Amazon Athena, or Amazon Simple Storage Service (Amazon S3).
- Datasets are built from data sources and can include joins, custom SQL, and calculated fields.
- Analyses are interactive environments for building visuals.
- Dashboards are published, read-only versions of analyses.
- Amazon Q topics define the semantic layer for natural language queries.
- Auxiliary assets – These enhance the user experience but are not first-class objects in the QuickSight UI. For example, themes define the styling of dashboards and analyses but are not listed as standalone assets on the QuickSight console. However, themes can be managed as standalone objects programmatically through the API, which supports operations such as
list,describe,update, anddelete. - Second-class assets – These are internal components within main assets, such as custom SQL, tables, filters, calculated fields, and parameters. These elements are not standalone objects on the QuickSight console UI, and they’re not accessible through direct
listordescribeAPI calls. Instead, they are defined within the definitions of datasets, analyses, or dashboards. They play a critical role in defining the logic, structure, and interactivity of QuickSight content. - Folders – These are management assets used to organize main assets into a hierarchical structure. You can create personal or shared folders to categorize the assets. Folders support access permissions, and an asset can reside in multiple folders.
Permissions model
QuickSight main, auxiliary, and management assets support user and group-level permissions for secure collaboration.
BIOps basic workflow
BIOps includes three core capabilities:
- Asset backup and restore – This is typically scoped per AWS account or per AWS Region. This process makes sure QuickSight assets can be restored in case of accidental deletion, service disruption, or data corruption.
- Version control – This can be applied within the same AWS account, so BI teams can track changes to asset definitions (for example, datasets or dashboards), roll back to previous versions, or maintain different branches of development over time.
- Deployment – This supports promoting assets across environments (for example, from a development account to test, QA, or production accounts) and also across Regions (for example, deploying assets from
us-east-1tous-west-2).
With BIOps workflows, teams can manage deployments and backups at both asset and folder levels. When deploying a dashboard, teams can include dependent assets (datasets, data sources, and themes) to support functionality. Folder-level operations enable promoting related assets as a single package.Deployments across AWS accounts require careful permission management. Asset types have user or group permissions that must be properly recreated in the target environment to maintain security and prevent broken dependencies.
The following diagram provides a high-level explanation of the BIOps workflows. Version control can also be achieved through the QuickSight console UI.

Building and publishing a QuickSight dashboard
As shown in the following graph, the QuickSight dashboard development process begins with BI authors, who can be organized into groups for simplified access management.
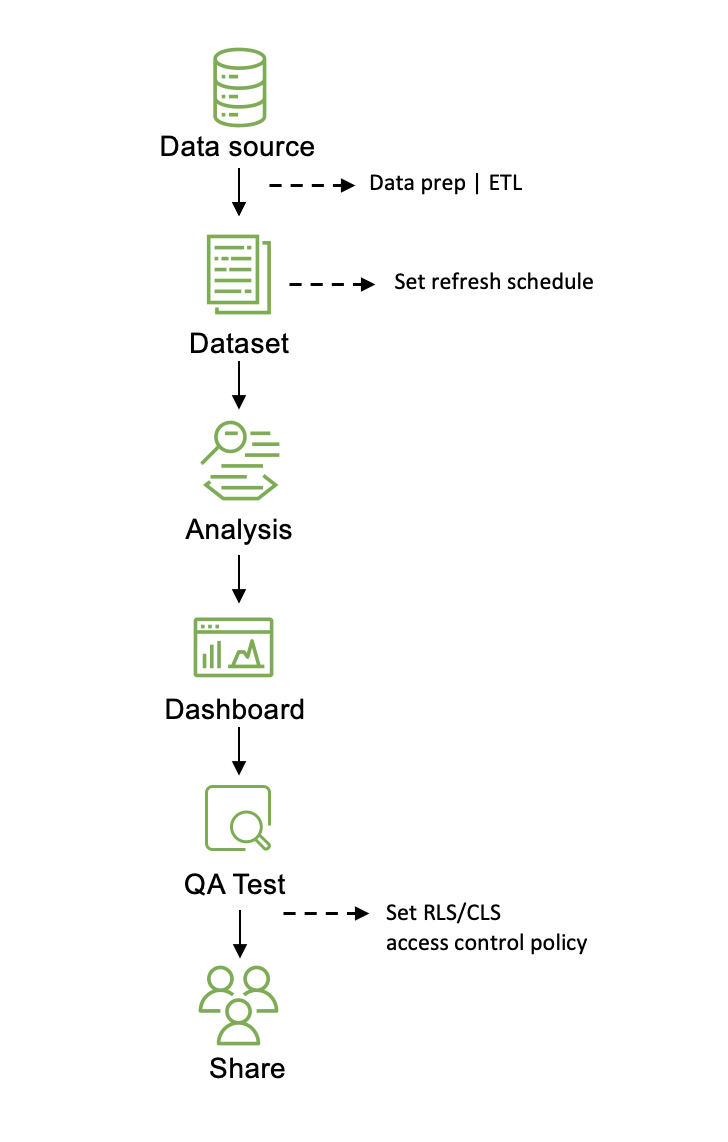
Authors first create a data source by connecting QuickSight to storage systems like Amazon Redshift. They then build datasets, adding transformations, joins, and custom fields. Dataset freshness is maintained through manual or scheduled refreshes, with monitoring capabilities.
Using these datasets, authors create analyses with visuals and interactive components. They can apply themes for consistent organizational branding. The final step is publishing the analysis as a dashboard and sharing it with specific users or groups. This process enables scalable self-service BI while maintaining governance.
Solution overview
This post covers three key QuickSight features:
- Dashboard versioning through the console UI
- Parallel team collaboration by publishing dashboards from different analyses
- Content reuse by importing visuals from other analyses and dashboards
These new features on the QuickSight console enable efficient BI collaboration and dashboard lifecycle management through a no-code interface. Authors can:
- Track version history of dashboards and datasets
- Roll back dashboards to previous versions
- Replicate assets manually
- Import and export visuals between analyses and dashboards
- Document changes through asset descriptions
- Create personalized views with bookmarks
- Manage analysis edits with undo/redo functionality
These features support streamlined governance and team collaboration without requiring coding experience.
This post focuses on no-code, UI-based workflows. Part 2 and Part 3 in this series will cover automated governance and deployment using QuickSight APIs and programmable approaches.
UI-based version control of dataset and dashboard
QuickSight introduced native dataset versioning in late 2021—users can track and manage up to 1,000 published versions directly within the QuickSight console UI. Dataset owners can preview historical states, revert to earlier versions, and maintain edit safety—with safeguards against incompatible changes (such as deleted sources or invalid calculations).
In April 2025, QuickSight introduced dashboard versioning, extending version control capabilities beyond datasets to full dashboards. Dashboard owners can now manage versions, track changes, and restore prior states through the UI—all without writing code. Although technical teams might still opt for API-based automation, analysts and business users can take advantage of these features to handle end-to-end dashboard lifecycle management with ease.
The following diagram illustrates a version-controlled continuous integration and delivery (CI/CD) workflow for QuickSight dashboard development.

The workflow begins with creating and editing an analysis (Version 1), followed by publishing it as Dashboard Version 1. After QA testing, if the dashboard passes, the analysis is updated to Version 2 and republished. If the QA test fails at any point, teams can either continue editing the current version or roll back to a previous version. The cycle continues with iterative development—publish, test, and update—making sure changes are validated before reaching production. Undo/redo actions support in-analysis changes, and version rollback enhances safety and agility for BI teams.
Undo and redo in analyses for minor edits
When editing an analysis in QuickSight, authors can use the Undo and Redo options to experiment without worrying about permanent changes. Up to 200 actions can be undone or redone within the analysis, accessible using the toolbar icons (see the following screenshot).

Dashboard publishing and version history
After an analysis is published as a dashboard, QuickSight automatically creates a new version. Dashboard owners can manage these versions by viewing the version history. To do so, open the dashboard and choose the Version history icon in the upper toolbar (see the following screenshot).

This opens a pane showing the current published version along with a list of all prior versions, including timestamps and the user who published each one. From there, you can review, compare, and restore previously published versions as needed. This feature provides a clear audit trail of dashboard changes and helps dashboard owners monitor how content has evolved over time.

If a mistake is discovered or a previous version is preferred, owners can roll back the dashboard to an earlier version with a single click.

This version control feature reduces manual rework by retaining full snapshots of each published dashboard. You can restore previous versions without losing access to other versions, enabling rapid iteration while maintaining stability.
UI-based parallel authoring and collaboration
The following diagram illustrates how multiple authors can collaborate in parallel within a single QuickSight development account. A shared folder—QA Assets—serves as a centralized location for reusable content, so authors can extend dashboards, reuse visuals, and manage versions independently.

In this example, three authors contribute to a shared development workflow:
- Ying creates Analysis 1 and publishes it as Dashboard 1, establishing a reusable asset for the team.
- Julia creates Analysis 2 and imports selected visuals from Dashboard 1, so they can build upon existing work while maintaining their own version. They then publish Dashboard 2.
- Rushabh uses the Save as option on Dashboard 2 to create Analysis 3, customizes it further, and publishes Dashboard 3. Rushabh can also update Dashboard 1 by publishing Analysis 3 to replace Dashboard 1.
This approach supports two key benefits:
- Parallel development – Each author works in isolation while referencing shared assets. This enables multiple dashboards or features to be developed concurrently without the risk of overwriting or conflicting changes.
- Safe fixes without collateral changes – If a production dashboard needs a quick fix, authors can start from the published version, make targeted edits, and republish—without introducing unfinished visuals or experimental changes from the original analysis still under development.
Together, these capabilities promote version traceability, minimize risk, and streamline collaboration at scale. Shared folders and modular workflows make QuickSight a powerful platform for enterprise BI teams.
Save dashboards as analyses
After publishing, a dashboard can be saved as an analysis for further modification. Authors can create a new analysis from a live dashboard using the Save as option (floppy disk icon), as shown in the following screenshot.

The new analysis appears in your personal list and can be freely edited—you can customize views or experiment with visuals without affecting the original dashboard.

Import visuals from another analysis or dashboard
With the import visuals feature in QuickSight, you can efficiently reuse and standardize dashboard components across analyses. From the analysis toolbar, choose Import visuals, then browse shared or personal assets to import one or more visuals. The imported visuals—including queries, formatting, and interactions—are copied into the current analysis, where they can be customized independently without impacting the original source. This capability streamlines dashboard development, promotes visual consistency, and reduces duplication across teams.

Publish a dashboard from an analysis
To replace an existing dashboard in QuickSight, choose Replace existing dashboard during publishing. This updates the dashboard with new changes without affecting its security settings or email report configurations.

By combining features like saving a dashboard as an analysis, publishing a dashboard from any analysis, and importing visuals from other analyses or dashboards, BI teams gain powerful flexibility in their development workflow. Teams can develop dashboards in parallel, with multiple authors working on different features or visuals independently. They can also safely fix issues in production dashboards without accidentally introducing in-progress or experimental visuals from the original analysis into the live version.This modular and controlled approach supports agile iteration while maintaining stability in production.
Replace datasets without dashboard breaking
Field types in QuickSight determine how visuals, filters, and calculations function. Dashboard failures can occur when dataset schema changes conflict with analysis requirements. The following screenshot shows an example of a movie ticket sales dashboard, built with SaleDate as a key field for filters and visualizations.

The dataset was updated. During this update, the SaleDate was changed from a Date field to an Integer.

After it was republished, the dashboard failed to load any visuals tied to SaleDate. Each affected visual displayed the message “The dataset changed too much for QuickSight to automatically update your analysis.”
The pie chart stopped rendering, the time comparison visuals failed, and the filter control for SalesDate no longer worked.

- If the schema change is intentional, you must:
- Recreate affected filters
- Update visuals to recognize the new data type
- If the schema change is not intended, you can:
- Revert to a previous dataset version that doesn’t include the unwanted change
When replacing datasets in QuickSight, visual breakage due to field mapping mismatches is also a common risk. To mitigate this, QuickSight now takes the following actions:
- Automatically prompts users to update field mapping when discrepancies are detected
- Attempts to automatically map fields based on schema similarity
- Displays a mismatch dialog for review if schemas don’t match exactly
You must manually align unmatched or misaligned fields. Although QuickSight enforces mapping for detected mismatches, it doesn’t verify user-provided mappings’ accuracy. Skipped or improper mappings will still cause visual breakage. Correct field mappings make sure visuals render as expected with the new dataset.
Conclusion
The new QuickSight console features enable code-free management of dashboard and dataset lifecycles. Teams can use version control, rollback capabilities, parallel development, and visual reuse to create safer, more efficient workflows.
For teams requiring automation, CI/CD integration, or programmatic governance, Part 2 and Part 3 of this series discuss API-based BIOps workflows.
About the authors
 Ying Wang is a Senior Specialist Solutions Architect in the Generative AI organization at AWS, specializing in Amazon QuickSight and Amazon Q to support large enterprise and ISV customers. She brings 16 years of experience in data analytics and data science, with a strong background as a data architect and software development engineering manager. As a data architect, Ying helped customers design and scale enterprise data architecture solutions in the cloud. In her role as an engineering manager, she enabled customers to unlock the power of their data through QuickSight by delivering new features and driving product innovation from both engineering and product perspectives.
 Julia Flash is a Senior Business Development Specialist in the Generative AI organization at AWS, leading QuickSight engagements for North America’s Enterprise segment. With 12 years of experience in AI, coding, and product strategy, she draws on a deep background as an engineer, technical product manager, and patent-holding innovator. Julia has designed and developed AI solutions, contributed to open-source data science, and has delivered high-impact, customer-facing engagements. Today, she continues to work with customers to drive adoption of QuickSight at scale.