AWS Big Data Blog
Develop and monitor a Spark application using existing data in Amazon S3 with Amazon SageMaker Unified Studio
Organizations face significant challenges managing their big data analytics workloads. Data teams struggle with fragmented development environments, complex resource management, inconsistent monitoring, and cumbersome manual scheduling processes. These issues lead to lengthy development cycles, inefficient resource utilization, reactive troubleshooting, and difficult-to-maintain data pipelines.These challenges are especially critical for enterprises processing terabytes of data daily for business intelligence (BI), reporting, and machine learning (ML). Such organizations need unified solutions that streamline their entire analytics workflow.
The next generation of Amazon SageMaker with Amazon EMR in Amazon SageMaker Unified Studio addresses these pain points through an integrated development environment (IDE) where data workers can develop, test, and refine Spark applications in one consistent environment. Amazon EMR Serverless alleviates cluster management overhead by dynamically allocating resources based on workload requirements, and built-in monitoring tools help teams quickly identify performance bottlenecks. Integration with Apache Airflow through Amazon Managed Workflows for Apache Airflow (Amazon MWAA) provides robust scheduling capabilities, and the pay-only-for-resources-used model delivers significant cost savings.
In this post, we demonstrate how to develop and monitor a Spark application using existing data in Amazon Simple Storage Service (Amazon S3) using SageMaker Unified Studio.
Solution overview
This solution uses SageMaker Unified Studio to execute and oversee a Spark application, highlighting its integrated capabilities. We cover the following key steps:
- Create an EMR Serverless compute environment for interactive applications using SageMaker Unified Studio.
- Create and configure a Spark application.
- Use TPC-DS data to build and run the Spark application using a Jupyter notebook in SageMaker Unified Studio.
- Monitor application performance and schedule recurring runs with Amazon MWAA integrated.
- Analyze results in SageMaker Unified Studio to optimize workflows.
Prerequisites
For this walkthrough, you must have the following prerequisites:
- An AWS account – If you don’t have an account, you can create one.
- A SageMaker Unified Studio domain – For instructions, refer to Create an Amazon SageMaker Unified Studio domain – quick setup.
- A demo project – Create a demo project in your SageMaker Unified Studio domain. For instructions, see Create a project. For this example, we choose All capabilities in the project profile section.
Add EMR Serverless as compute
Complete the following steps to create an EMR Serverless compute environment to build your Spark application:
- In SageMaker Unified Studio, open the project you created as a prerequisite and choose Compute.
- Choose Data processing, then choose Add compute.
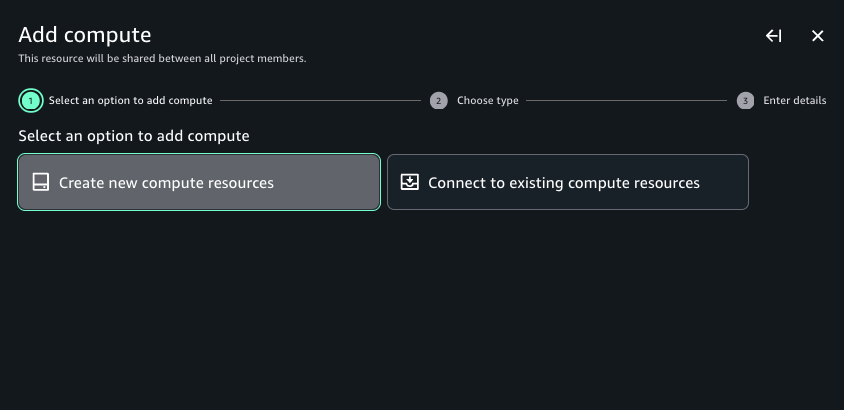
- Choose Create new compute resources, then choose Next.
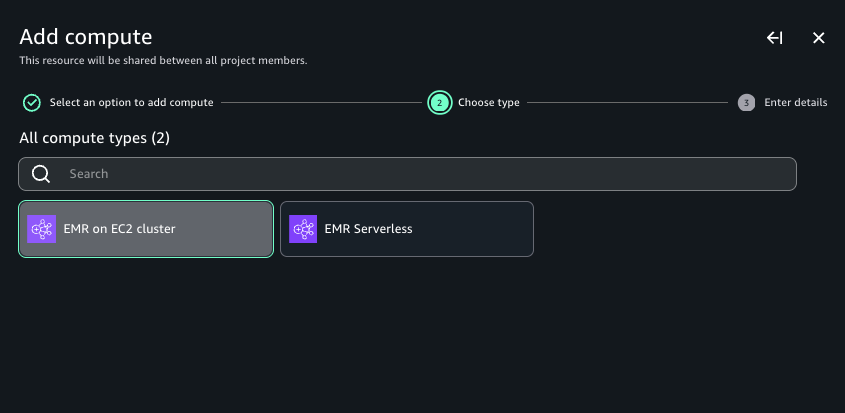
- Choose EMR Serverless, then choose Next.
- For Compute name, enter a name.
- For Release label, choose emr-7.5.0.
- For Permission mode, choose Compatibility.
- Choose Add compute.
It takes a few minutes to spin up the EMR Serverless application. After it’s created, you can view the compute in SageMaker Unified Studio.

The preceding steps demonstrate how you can set up an Amazon EMR Serverless application in SageMaker Unified Studio to run interactive PySpark workloads. In subsequent steps, we build and monitor Spark applications in an interactive JupyterLab workspace.
Develop, monitor, and debug a Spark application in a Jupyter notebook within SageMaker Unified Studio
In this section, we build a Spark application using the TPC-DS dataset within SageMaker Unified Studio. With Amazon SageMaker Data Processing, you can focus on transforming and analyzing your data without managing compute capacity or open source applications, saving you time and reducing costs. SageMaker Data Processing provides a unified developer experience from Amazon EMR, AWS Glue, Amazon Redshift, Amazon Athena, and Amazon MWAA in a single notebook and query interface. You can automatically provision your capacity on Amazon EMR on Amazon Elastic Compute Cloud (Amazon EC2) or EMR Serverless. Scaling rules manage changes to your compute demand to optimize performance and runtimes. Integration with Amazon MWAA simplifies workflow orchestration by alleviating infrastructure management needs. For this post, we use EMR Serverless to read and query the TPC-DS dataset within a notebook and run it using Amazon MWAA.
Complete the following steps:
- Upon completion of the previous steps and prerequisites, navigate to SageMaker Studio and open your project.
- Choose Build and then JupyterLab.
The notebook takes about 30 seconds to initialize and connect to the space.
- Under Notebook, choose Python 3 (ipykernel).
- In the first cell, next to Local Python, choose the dropdown menu and choose PySpark.
- Choose the dropdown menu next to Project.Spark and choose EMR-S Compute.
- Run the following code to develop your Spark application. This example reads a 3 TB TPC-DS dataset in Parquet format from a publicly accessible S3 bucket:
After the Spark session starts and execution logs start to populate, you can explore the Spark UI and driver logs to further debug and troubleshoot Spark progra The following screenshot shows an example of the Spark UI.
  The following screenshot shows an example of the driver logs.
  The following screenshot shows the Executors tab, which provides access to the driver and executor logs.
- Use the following code to read some more TPC-DS datasets. You can create temporary views and use the Spark UI to see the files being read. Refer to the appendix at the end of this for details on using the TPC-DS dataset within your buckets.
In each cell of your notebook, you can expand Spark Job Progress to view the stages of the job submitted to EMR Serverless for a specific cell. You can see the time taken to complete each stage. In addition, if a failure occurs, you can examine the logs, making troubleshooting a seamless experience.

Because the files are partitioned based on date key column, you can observe that Spark runs parallel tasks for reads.

- Next, get the count across the date time keys on data that is partitioned based on the time key using the following code:

Monitor jobs in the Spark UI
On the Jobs tab of the Spark UI, you can see a list of complete or actively running jobs, with the following details:
- The action that triggered the job
- The time it took (for this example, 41 seconds, but timing will vary)
- The number of stages (2) and tasks (3,428); these are for reference and specific to this specific example
You can choose the job to view more details, particularly around the stages. Our job has two stages; a new stage is created whenever there is a shuffle. We have one stage for the initial reading of each dataset, and one for the aggregation.  In the following example, we run some TPC-DS SQL statements that are used for performance and benchmarks:
You can monitor your Spark job in SageMaker Unified Studio using two methods. Jupyter notebooks provide basic monitoring, showing real-time job status and execution progress. For more detailed analysis, use the Spark UI. You can examine specific stages, tasks, and execution plans. The Spark UI is particularly useful for troubleshooting performance issues and optimizing queries. You can track estimated stages, running tasks, and task timing details. This comprehensive view helps you understand resource utilization and track job progress in depth.
In this section, we explained how you can EMR Serverless compute in SageMaker Unified Studio to build an interactive Spark application. Through the Spark UI, the interactive application provides fine-grained task-level status, I/O, and shuffle details, as well as links to corresponding logs of the task for this stage directly from your notebook, enabling a seamless troubleshooting experience.
Clean up
To avoid ongoing charges in your AWS account, delete the resources you created during this tutorial:
- Delete the connection.
- Delete the EMR job.
- Delete the EMR output S3 buckets.
- Delete the Amazon MWAA resources, such as workflows and environments.
Conclusion
In this post, we demonstrated how the next generation of SageMaker, combined with EMR Serverless, provides a powerful solution for developing, monitoring, and scheduling Spark applications using data in Amazon S3. The integrated experience significantly reduces complexity by offering a unified development environment, automatic resource management, and comprehensive monitoring capabilities through Spark UI, while maintaining cost-efficiency through a pay-as-you-go model. For businesses, this means faster time-to-insight, improved team collaboration, and reduced operational overhead, so data teams can focus on analytics rather than infrastructure management.
To get started, explore the Amazon SageMaker Unified Studio User Guide, set up a project in your AWS environment, and discover how this solution can transform your organization’s data analytics capabilities.
Appendix
In the following sections, we discuss how to run a workload on a schedule and provide details about the TPC-DS dataset for building the Spark application using EMR Serverless.
Run a workload on a schedule
In this section, we deploy a JupyterLab notebook and create a workflow using Amazon MWAA. You can use workflows to orchestrate notebooks, querybooks, and more in your project repositories. With workflows, you can define a collection of tasks organized as a directed acyclic graph (DAG) that can run on a user-defined schedule.Complete the following steps:
- In SageMaker Unified Studio, choose Build, and under Orchestration, choose Workflows.

- Choose Create Workflow in Editor.
You will be redirected to the JupyterLab notebook with a new DAG called untitled.py created under the /src/workflows/dag folder.
- We rename this notebook to
tpcds_data_queries.py. - You can reuse the existing template with the following updates:
- Update line 17 with the schedule you want your code to run.
- Update line 26 with your
NOTEBOOK_PATH. This should be insrc/<notebook_name>.ipynb. Note the name of the automatically generateddag_id; you can name it based on your requirements.

- Choose File and Save notebook.
To test, you can trigger a manual run of your workload.
- In SageMaker Unified Studio, choose Build, and under Orchestration, choose Workflows.
- Choose your workflow, then choose Run.
You can monitor the success of your job on the Runs tab.

To debug your notebook job by accessing the Spark UI within your Airflow job console, you must use EMR Serverless Airflow Operators to submit your job. The link is available on the Details tab of your query.
This option has the following key limitations: it’s not available for Amazon EMR on EC2, and SageMaker notebook job operators don’t work.
You can configure the operator to generate one-time links to the application UIs and Spark stdout logs by passing enable_application_ui_links=True as a parameter. After the job starts running, these links are available on the Details tab of the relevant task. If enable_application_ui_links=False, then the links will be present but grayed out.
Make sure you have the emr-serverless:GetDashboardForJobRun AWS Identity and Access Management (IAM) permissions to generate the dashboard link.
Open the Airflow UI for your job. The Spark UI and history server dashboard options are visible on the Details tab, as shown in the following screenshot.

The following screenshot shows the Jobs tab of the Spark UI.

Use the TPC-DS dataset to build the Spark application using EMR Serverless
To use the TPC-DS dataset to run the Spark application against a dataset in an S3 bucket, you need to copy the TPC-DS dataset into your S3 bucket:
- Create a new S3 bucket in your test account if needed. In the following code, replace
$YOUR_S3_BUCKETwith your S3 bucket name. We suggest you exportYOUR_S3_BUCKETas an environment variable:
- Copy the TPC-DS source data as input to your S3 bucket. If it’s not exported as an environment variable, replace
$YOUR_S3_BUCKETwith your S3 bucket name:
About the Authors
 Amit Maindola is a Senior Data Architect focused on data engineering, analytics, and AI/ML at Amazon Web Services. He helps customers in their digital transformation journey and enables them to build highly scalable, robust, and secure cloud-based analytical solutions on AWS to gain timely insights and make critical business decisions.
 Abhilash is a senior specialist solutions architect at Amazon Web Services (AWS), helping public sector customers on their cloud journey with a focus on AWS Data and AI services. Outside of work, Abhilash enjoys learning new technologies, watching movies, and visiting new places.