AWS Partner Network (APN) Blog
Real-Time Infrastructure Intelligence with Netdata and Amazon Bedrock
By: Satyadeep Ashwathnarayana, Chief Business Officer and Head of Product – Netdata
By: Shyam Sreevalsan, Vice President of Strategy, Partnerships, Product – Netdata
By: Pyone Thant Win, WW AI Acceleration Architect – AWS
 |
| Netdata |
 |
Modern infrastructure produces a firehose of telemetry – metrics, logs, and events. Yet, understanding what matters in real-time remains a challenge for operations and engineering teams. With distributed systems becoming increasingly complex and interdependent, traditional monitoring approaches leave teams drowning in alerts while missing critical insights. Especially when issues arise, the volume and speed of incoming data makes it challenging for human operators to analyze and connect signals in real-time. While traditional monitoring solutions offer basic anomaly detection, they lack the contextual awareness needed to distinguish between normal variations and truly problematic patterns.
Netdata is a high-resolution observability platform trusted by engineers worldwide. To address these monitoring challenges, Netdata has launched a new AI-powered feature called Netdata Insights. Netdata Insights leverages Amazon Bedrock and Anthropic Claude Sonnet, a high-performance model with exceptional reasoning and efficiency. Netdata Insights is part of Netdata Cloud, hosted on Amazon Web Services (AWS). In this blog, we will cover how this partnership brings true context-aware, actionable analysis to the world of infrastructure monitoring.
What is Netdata?
Netdata is an AWS Technology Partner with an open-source observability repository on GitHub. It has over 74,000 stars, and is downloaded over 1.5 million times per day by developers and Site Reliability Engineers (SREs) across the globe. Through its 800+ integrations, Netdata provides real-time monitoring and troubleshooting for infrastructure, from bare metal to containers to edge devices. Lightweight agents collect metrics every second and store them locally, avoiding centralized bottlenecks and egress costs.
Netdata is unique from other monitoring and observability platforms in a few distinct ways:
- True Real-Time Monitoring: Every metric is collected and visualized every second, with just 1-second latency from collection to visualization. No sampling, no smoothing, no hidden spikes – giving users instant feedback on system changes as seen in Figure 1.
- Automation-first Architecture: Netdata eliminates routine admin work by streamlining operations through its automation-first architecture. Auto-discovery feature by Netdata detects and monitors new data sources without configuration, allowing teams to solve problems instead of configuring monitoring tools.
- Decentralized architecture: Traditional monitoring tools become expensive when collecting high-resolution data from many sources, forcing companies to either reduce data quality or pay more. Netdata’s decentralized architecture processes data at the edge. This design enables organizations to monitor all their systems at 1-second granularity with long-term storage, while keeping infrastructure costs low.
- Troubleshooter’s toolkit: Netdata uses machine learning (ML) to detect anomalies across every metric in the infrastructure. The ML models, trained and deployed at the edge, reduces Mean Time to Resolution (MTTR) by enabling teams to identify and resolve issues 95% faster than traditional methods.
- Enterprise-Grade Security: Netdata uses Forward Secure Sealing (FSS) technology to protect against data tampering, while providing real-time security monitoring and anomaly detection. Netdata’s security features meet compliance requirements across industries, making it effective for security-sensitive environments.
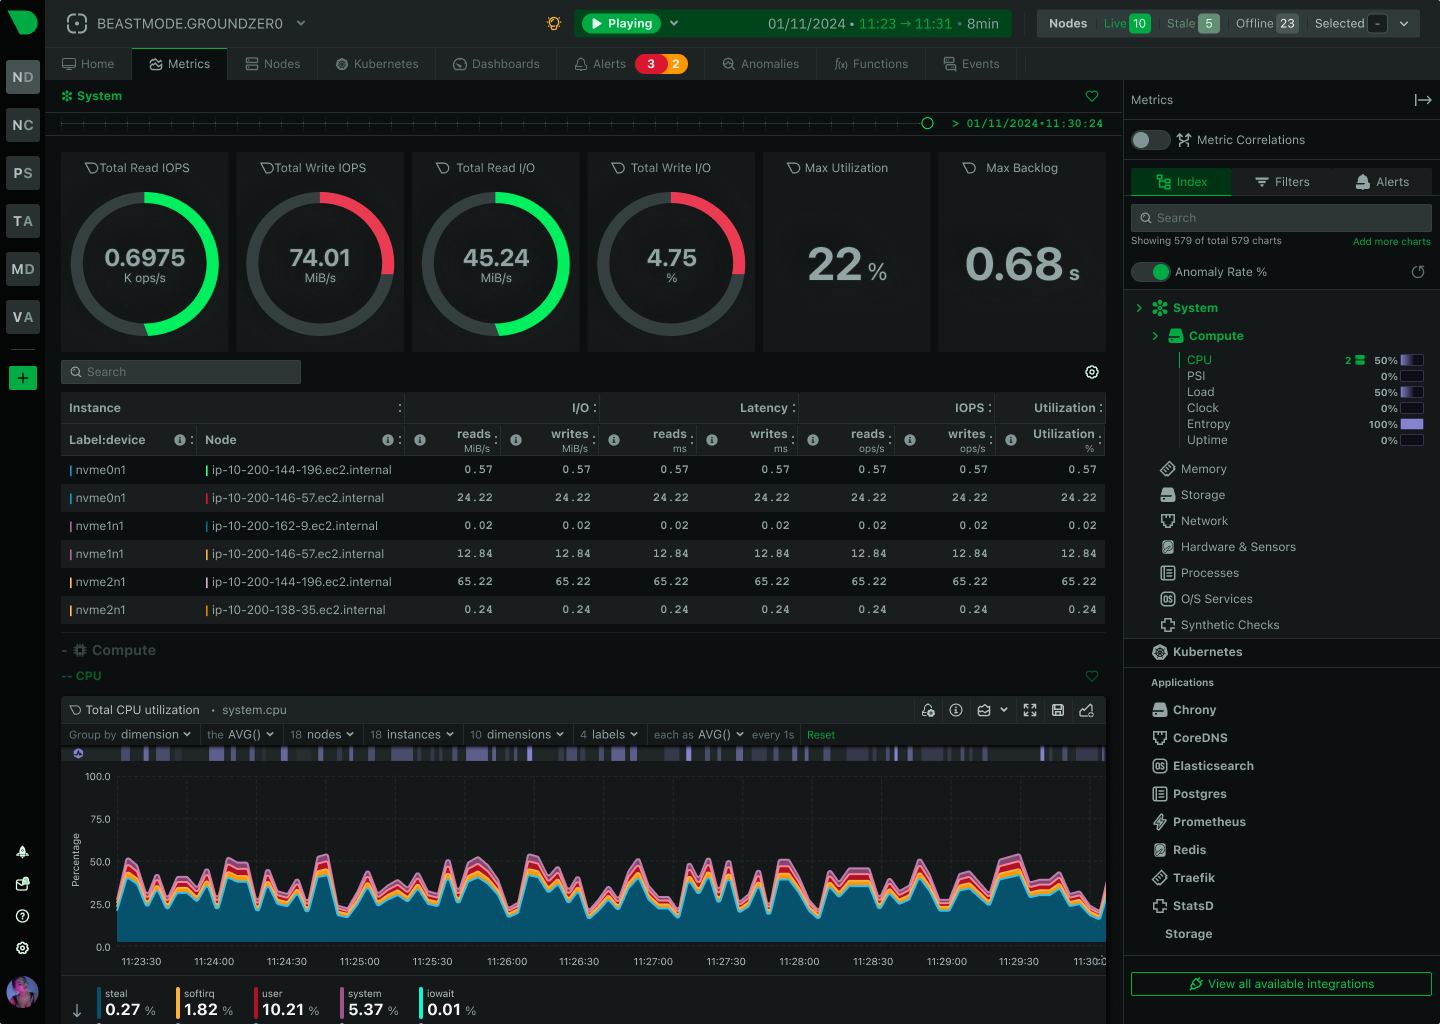
Figure 1 – Netdata Infrastructure Monitoring Dashboard
Introducing Netdata Insights
Netdata Insights brings reasoning capabilities directly into the user’s infrastructure observability stack. Building upon Netdata’s existing real-time per-second metrics, logs, and automated dashboards, this feature empowers users to extract valuable insights from their monitoring data. Powered by Amazon Bedrock, the feature generates detailed, structured reports for:
- Capacity planning – This report analyzes infrastructure resource usage and trends across your entire system or specific resources like compute, storage, and memory. Users can customize time ranges and focus areas to project future needs and identify potential bottlenecks.
- Performance optimization – These reports identify performance issues in applications and infrastructure. They provide key metrics analysis, deliver specific optimization steps, and offer actionable recommendations for improvement.
- Infrastructure summary – This feature summarizes critical infrastructure changes over selected periods, such as the last 24 hours, 48 hours, 7 days, or 30 days. It tracks the impact of deployments and system changes, eliminating the need for manual data analysis across multiple sources.
- Anomaly analysis – Netdata continuously runs anomaly detection on every metric. This report processes this data, surfacing the most relevant and actionable insights. It delivers clear, contextualized findings to help users quickly understand and address anomalies.
Reports can be generated on-demand or scheduled, providing natural-language explanations, relevant graphs, and specific recommendations based on all available telemetry in Netdata Cloud. Here are some illustrative examples of how users have been using Netdata Insights to solve real world problems.
Example 1: Kubernetes Performance Investigation – An SRE at a mid-size SaaS company encountered performance degradation in their production Kubernetes cluster. Monitoring dashboards showed elevated CPU usage, but this didn’t explain the intermittent slowdowns. Netdata Insights’ performance optimization report identified the root cause: memory pressure causing container throttling in specific namespaces, combined with inefficient resource requests creating artificial scarcity. The tool pinpointed affected pods and recommended memory limit adjustments. This reduced the investigation time from hours to 10 minutes, providing a clear diagnosis and actionable steps to resolve the issue.
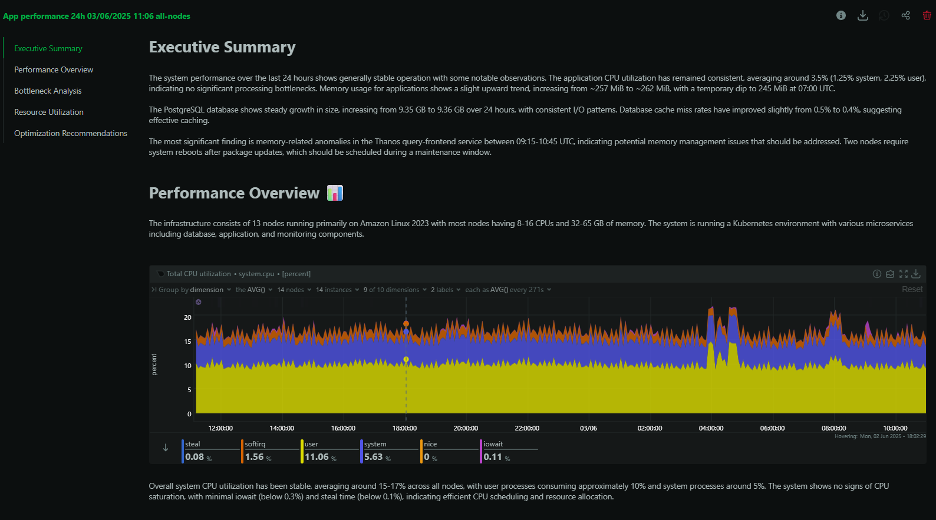
Figure 2 – Example of Performance Optimization Report by Netdata Insights
Example 2: Infrastructure Budget Justification – A platform engineering team needed to justify Q2 infrastructure expansion to their finance team. Gathering utilization data, creating projections, and building presentations typically takes a week. Netdata Insights’ capacity planning report analyzed three months of growth trends and identified bottlenecks in the database tier and API gateway layers. The report calculated when they would hit critical thresholds and provided timeline recommendations for upgrades. The team shared this report directly with leadership, reducing a week-long project to 5 minutes of report generation.
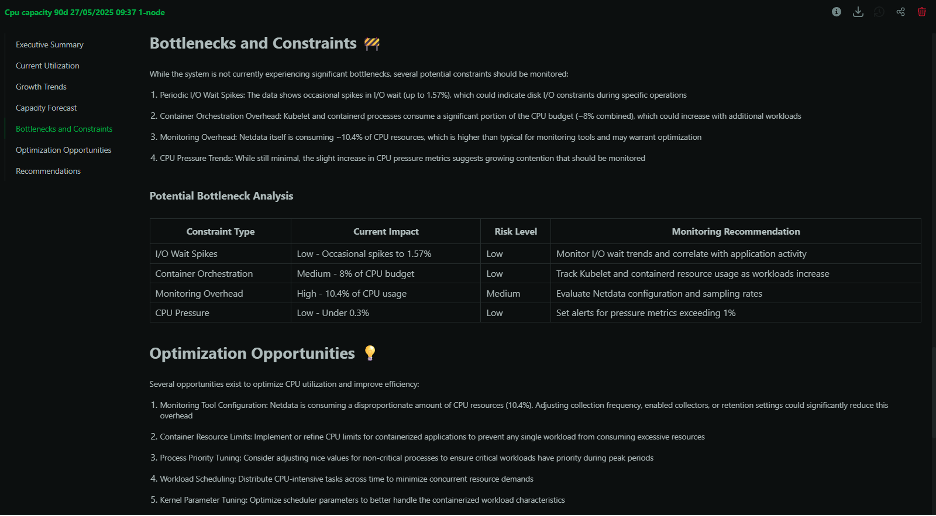
Figure 3 – Example of Capacity Planning Report by Netdata Insights
Example 3: Post-Weekend Incident Recovery – A DevOps lead returned on Monday to find cascading alerts from the weekend: high memory usage, disk space warnings, and multiple service restarts. Instead of manually piecing together the incident timeline from various monitoring dashboards and chat logs, they ran Netdata Insights’ infrastructure summary report for the weekend. The report identified a batch job that started consuming excessive memory on Saturday evening, triggering out of memory (OOM) kills and service restarts. It pinpointed the still-affected services and recommended immediate memory limit adjustments for two specific workloads. This provided the DevOps lead with a comprehensive incident overview and action plan in minutes, eliminating hours of investigation across multiple data sources.
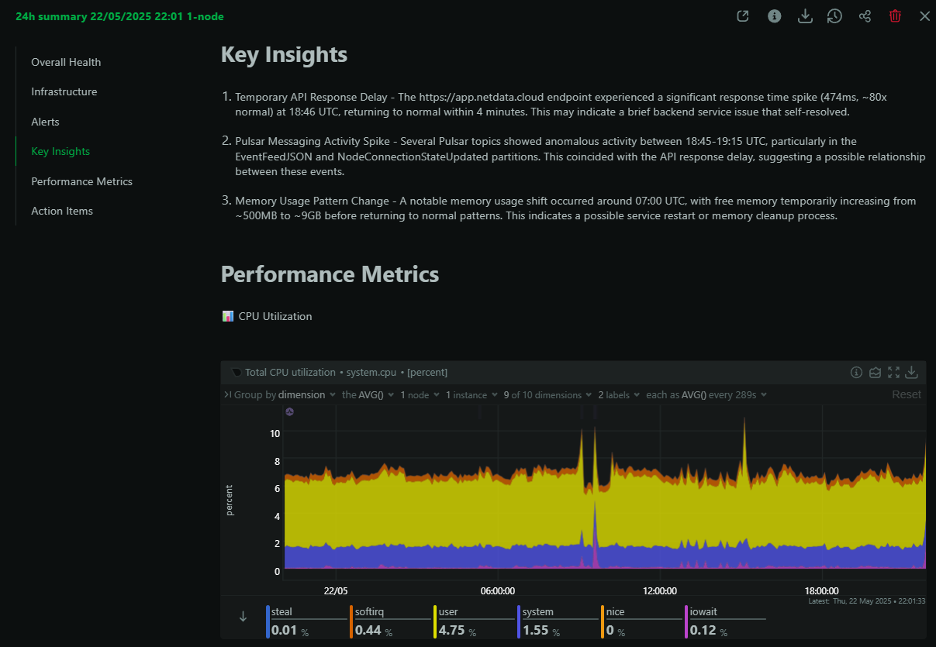
Figure 4 – Example of Infrastructure Summary Report by Netdata Insights
Why Amazon Bedrock
The solution currently leverages Anthropic’s Claude Sonnet because it excels at structured reasoning, summarization, and domain-aware analysis. These are all crucial for Netdata to convert raw telemetry into useful narratives. With Amazon Bedrock as the foundation, it’s easy to adapt to the rapidly evolving landscape of LLMs. As newer or more capable LLMs come to market, it’s easy for organizations to adopt new models and new model variants quickly using Amazon Bedrock. It provides a flexible foundation that allows organizations to select and switch between the most suitable models for their use cases. This flexibility enables organizations continuously improve their applications while keeping costs in check, instead of being locked into the newest or the most expensive models. Using Amazon Bedrock’s secure and scalable infrastructure gives Netdata the ability to:
- Scale LLM workloads elastically
- Maintain consistent low-latency inference
- Keep customer data secure inside AWS’s compliance envelope
This integration allows Netdata to keep its promise of real-time insights without tradeoffs in cost, control, or speed. Figure 5 below shows the deployment architecture of Netdata and how it provides a unified monitoring experience for different environments that customer may have.
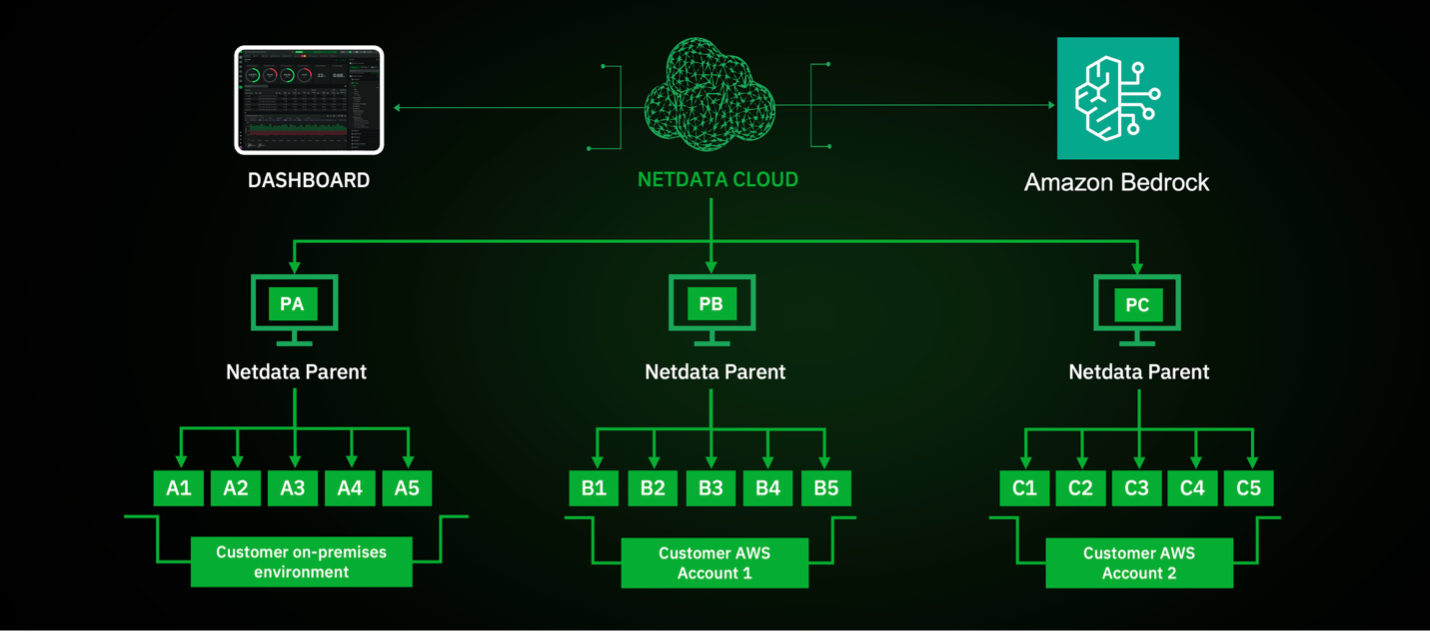
Figure 5 – Netdata Deployment Architecture
What’s Next for Netdata AI
While Insights starts with structured reports, Netdata’s vision extends far beyond. The long-term roadmap includes:
- Natural language queries: Ask questions like “What happened to my Redis node yesterday?” and get scoped, contextual answers.
- Inline explanations in dashboards: AI highlights anomalies and explains them directly on your live charts.
- Autonomous ops support: From incident root cause to postmortem analysis – automatically generated by your monitoring system.
The vision is to build an AI Co-Engineer that works autonomously. It will connect to not just Netdata but external tools like GitHub, Jira, and Slack. This integration would enable more holistic incident detection and resolution. In other words, Netdata envisions building an AI that acts, not just chats.
The value of Netdata’s approach is already evident in customer experiences.
“Netdata is the kind of software that gives more than you invest in it. A rare unicorn that obeys the ‘Pareto’ rule: for 20 percent of the effort, it solves 80 percent of the problem.”
– Eduard Porquet Mateu, DevOps Engineer at Transports Metropolitans de Barcelona (Barcelona Public Transport)
“Since implementing Netdata, we have reduced downtime by approximately 25% due to its real-time monitoring and alerting capabilities.”
– Carlos Salfate, Software Developer at Chile Atiende (Chilean government’s official platform)
Conclusion
In this blog, we explored Netdata Insights, which combines real-time monitoring with AI analytics powered by Amazon Bedrock. Through examples, we showed how it transforms infrastructure observability, reducing troubleshooting time and providing actionable insights. Amazon Bedrock enables Netdata to deliver Netdata Insights by simplifying AI infrastructure management. Netdata Insights empowers teams to make faster, more informed decisions about their infrastructure.
Netdata Insights is now available in Netdata Cloud. It’s free to try and instantly available with any infrastructure where the Netdata agent is deployed. No config files, no pipelines to maintain – just insights when you need them. Start monitoring smarter:
.
 .
.
Netdata – AWS Partner Spotlight
Netdata is an AWS Advanced Technology Partner offering an open-core monitoring platform focused on high-resolution metrics, real-time alerting, and zero-latency troubleshooting. Backed by a global community and deployed in millions of systems, Netdata brings clarity to complexity.